
Recommended
More Related Content
What's hot
What's hot (20)
Similar to Aaj ka trend 19.05.16
Similar to Aaj ka trend 19.05.16 (20)
Recently uploaded
Recently uploaded (20)
Aaj ka trend 19.05.16
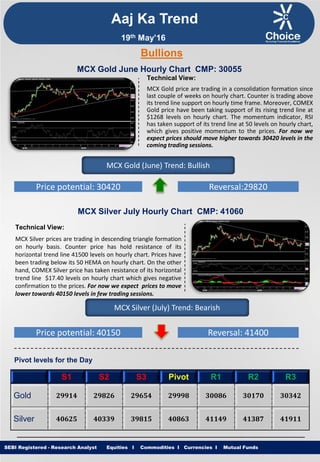
- 1. Equities I Commodities I Currencies I Mutual Funds Aaj Ka Trend Technical View: MCX Gold price are trading in a consolidation formation since last couple of weeks on hourly chart. Counter is trading above its trend line support on hourly time frame. Moreover, COMEX Gold price have been taking support of its rising trend line at $1268 levels on hourly chart. The momentum indicator, RSI has taken support of its trend line at 50 levels on hourly chart, which gives positive momentum to the prices. For now we expect prices should move higher towards 30420 levels in the coming trading sessions. SEBI Registered - Research Analyst Equities I Commodities I Currencies I Mutual Funds Bullions MCX Gold June Hourly Chart CMP: 30055 MCX Gold (June) Trend: Bullish Price potential: 30420 Reversal:29820 MCX Silver July Hourly Chart CMP: 41060 Technical View: MCX Silver prices are trading in descending triangle formation on hourly basis. Counter price has hold resistance of its horizontal trend line 41500 levels on hourly chart. Prices have been trading below its 50 HEMA on hourly chart. On the other hand, COMEX Silver price has taken resistance of its horizontal trend line $17.40 levels on hourly chart which gives negative confirmation to the prices. For now we expect prices to move lower towards 40150 levels in few trading sessions. MCX Silver (July) Trend: Bearish Price potential: 40150 Reversal: 41400 Pivot levels for the Day S1 S2 S3 Pivot R1 R2 R3 Gold 29914 29826 29654 29998 30086 30170 30342 Silver 40625 40339 39815 40863 41149 41387 41911 19th May’16
- 2. Equities I Commodities I Currencies I Mutual Funds Technical View: MCX Copper Prices have witnessed breakdown of its consolidation formation at 306.60 levels on hourly chart. However, MCX Copper prices is trading below its 50 HEMA on hourly chart which indicates short term trend remains weak. On the other hand, momentum indicator RSI is trading below 50 levels on hourly chart. Furthermore, momentum indictor MACD has shown negative crossover on hourly chart. For now we expect prices to move lower towards 301 levels in coming trading sessions. SEBI Registered - Research Analyst Equities I Commodities I Currencies I Mutual Funds MCX Copper June hourly Chart CMP: 311.40 MCX Copper (June) Trend: Bearish Price potential: 301 Reversal: 315 MCX Crude Oil May. Hourly Chart CMP: 3272 Technical View: As expected MCX Crude moved higher as per our line of expectation till 3277 levels. MCX Crude Oil prices are trading in a higher high higher bottom formation on hourly chart. Moreover, counter is trading above its 21 HEMA on hourly chart. On the other hand, momentum indicator MACD has given positive crossover on hourly chart which gives positive confirmation to the prices. For now we expect prices to move higher towards 3360 levels in coming trading sessions. MCX Crude Oil (May) Trend: Bullish Price potential: 3360 Reversal: 3220 Pivot levels for the Day S1 S2 S3 Pivot R1 R2 R3 Copper 306.9 304.2 299.7 308.8 311.5 313.3 317.9 Crude 3226 3190 3128 3252 3288 3314 3376 Base Metal Energy Aaj Ka Trend 19th May’16
- 3. Equities I Commodities I Currencies I Mutual FundsSEBI Registered - Research Analyst Equities I Commodities I Currencies I Mutual Funds Other Base Metals & Energy S1 S2 S3 Pivot R1 R2 R3 Trend Copper 306.9 304.2 299.7 308.8 311.5 313.3 317.9 Aluminum 103.0 102.0 100.4 103.6 104.6 105.2 106.8 Lead 113.6 113.0 111.5 114.4 115.0 115.9 117.3 Nickel 575.7 571.5 562.7 580.3 584.5 589.1 597.9 Zinc 125.1 124.2 122.7 125.8 126.6 127.3 128.9 Natural Gas 133.8 132.7 129.5 135.9 137.0 139.1 142.3 Fundamental News: Gold held overnight gain in Asia as investors looked ahead to the Wednesday release of Federal Reserve minutes expected to shed some light on prospects for rate hikes this year. Gold futures were lower in European trade on Tuesday, after posting modest overnight gains, as market players looked ahead to minutes of the Federal Reserve’s April policy meeting, which many feared could be more hawkish than the statement. Investors will be focusing on minutes of the Federal Reserve’s April policy meeting due on Wednesday at 18:00GMT, or 2:00PM ET, for some clarity on where the U.S. central bank stands on its path toward rate hikes. Oil prices held near the prior session’s seven-month highs in European trade on Wednesday, amid speculation weekly supply data due later in the session will show U.S. crude inventories fell for the second straight week. Brent crude prices eased on Wednesday, after hitting 2016 highs in the previous session, as the impact of unplanned supply disruptions in Nigeria and Canada was tempered by rising supplies elsewhere. West Texas Intermediate oil futures moved away from intraday highs in North America trade on Wednesday, after data showed that oil supplies in the U.S. registered an unexpected increase. U.S. crude stocks rose unexpectedly last week even as gasoline and distillate inventories fell more than expected, data from the Energy Information Administration showed on Wednesday. China's central government-controlled firms will cut steel production capacity by 10 percent over the 2016-2017 period, the cabinet said on its microblog on Wednesday. Aaj Ka Trend 19th May’16
- 4. Equities I Commodities I Currencies I Mutual FundsSEBI Registered - Research Analyst Equities I Commodities I Currencies I Mutual Funds International Market Commodity Closing Price Gold 1260.42 Silver 16.88 Crude Oil 47.80 Brent Crude Oil 48.42 Natural Gas 2.01 COMEX/NYMEX/ICE ( Precious Metals & Energy) Currency & Commodity Index Currency (Spot) Current Price USD / INR 66.98 Dollar Index 95.20 EUR / USD 1.1220 CRB Index* 185.39 Closing as on 18.05.16 *Closing as on 18.05.16 LME (Base Metals) ( $ per tones) Commodity Closing Price Copper 4612.50 Aluminum 1551.50 Zinc 1888 Lead 1703 Nickel 8635 SHFE (Base Metals) (Yuan per tones) Commodity Closing Price Copper 35460 Aluminum 12375 Zinc 15235 Lead 15050 Closing as on 18.05.16 Closing as on 18.05.16 LME INVENTORY DATA Aaj Ka Trend 12-May-16 13-May-16 16-May-16 17-May-16 18-May-16 Aluminium -8900 -4825 -6625 -2050 -4600 Copper -1625 -3325 -2350 -2275 100 Lead 750 25 -250 -175 4800 Nickel -6 -1674 -5880 -606 -1680 Zinc -1100 -1125 -325 -575 -1000 19th May’16
- 5. Equities I Commodities I Currencies I Mutual Funds This is solely for information of clients of Choice Broking and does not construe to be an investment advice. It is also not intended as an offer or solicitation for the purchase and sale of any financial instruments. Any action taken by you on the basis of the information contained herein is your responsibility alone and Choice Broking its subsidiaries or its employees or associates will not be liable in any manner for the consequences of such action taken by you. We have exercised due diligence in checking the correctness and authenticity of the information contained in this recommendation, but Choice Broking or any of its subsidiaries or associates or employees shall not be in any way responsible for any loss or damage that may arise to any person from any inadvertent error in the information contained in this recommendation or any action taken on basis of this information. Technical analysis studies market psychology, price patterns and volume levels. It is used to forecast future price and market movements. Technical analysis is complementary to fundamental analysis and news sources. The recommendations issued herewith might be contrary to recommendations issued by Choice Broking in the company research undertaken as the recommendations stated in this report is derived purely from technical analysis. Choice Broking has based this document on information obtained from sources it believes to be reliable but which it has not independently verified; Choice Broking makes no guarantee, representation or warranty and accepts no responsibility or liability as to its accuracy or completeness. The opinions contained within the report are based upon publicly available information at the time of publication and are subject to change without notice. The information and any disclosures provided herein are in summary form and have been prepared for informational purposes. The recommendations and suggested price levels are intended purely for trading purposes. The recommendations are valid for the day of the report however trading trends and volumes might vary substantially on an intraday basis and the recommendations may be subject to change. The information and any disclosures provided herein may be considered confidential. Any use, distribution, modification, copying, forwarding or disclosure by any person is strictly prohibited. The information and any disclosures provided herein do not constitute a solicitation or offer to purchase or sell any security or other financial product or instrument. The current performance may be unaudited. Past performance does not guarantee future returns. There can be no assurance that investments will achieve any targeted rates of return, and there is no guarantee against the loss of your entire investment. POTENTIAL CONFLICT OF INTEREST DISCLOSURE (as on date of report) Disclosure of interest statement – • Analyst interest of the stock /Instrument(s): - No. • Firm interest of the stock / Instrument (s): - No. Disclaimer Contact Us Amit Pathania Research Associate amit.pathania@choiceindia.com Rohan Patil Research Associate rohan.patil@choiceindia.com www.choiceindia.comcustomercare@choiceindia.com SEBI Registered - Research Analyst Equities I Commodities I Currencies I Mutual Funds Aaj Ka Trend 19th May’16 Neeraj Yadav Research Advisor neeraj.yadav@choiceindia.com Anish Vyas Senior Research Associate anish.vyas@choiceindia.com Amit Pathania Digitally signed by Amit Pathania DN: cn=Amit Pathania, o=Choice Equity Broking Pvt. ltd, ou=Research Department, email=amit.pathania@choiceindia.com, c=IN Date: 2016.05.19 08:33:02 +05'30'