
Recommended
More Related Content
What's hot
What's hot (20)
Viewers also liked
Viewers also liked (20)
Similar to Aaj ka trend 31.01.17
Similar to Aaj ka trend 31.01.17 (20)
Recently uploaded
Recently uploaded (20)
Aaj ka trend 31.01.17
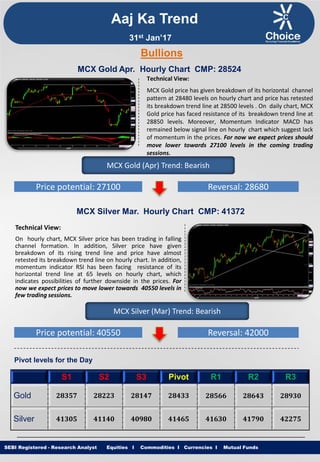
- 1. Equities I Commodities I Currencies I Mutual Funds Aaj Ka Trend Technical View: MCX Gold price has given breakdown of its horizontal channel pattern at 28480 levels on hourly chart and price has retested its breakdown trend line at 28500 levels . On daily chart, MCX Gold price has faced resistance of its breakdown trend line at 28850 levels. Moreover, Momentum Indicator MACD has remained below signal line on hourly chart which suggest lack of momentum in the prices. For now we expect prices should move lower towards 27100 levels in the coming trading sessions. SEBI Registered - Research Analyst Equities I Commodities I Currencies I Mutual Funds Bullions MCX Gold Apr. Hourly Chart CMP: 28524 MCX Gold (Apr) Trend: Bearish Price potential: 27100 Reversal: 28680 MCX Silver Mar. Hourly Chart CMP: 41372 Technical View: On hourly chart, MCX Silver price has been trading in falling channel formation. In addition, Silver price have given breakdown of its rising trend line and price have almost retested its breakdown trend line on hourly chart. In addition, momentum indicator RSI has been facing resistance of its horizontal trend line at 65 levels on hourly chart, which indicates possibilities of further downside in the prices. For now we expect prices to move lower towards 40550 levels in few trading sessions. MCX Silver (Mar) Trend: Bearish Price potential: 40550 Reversal: 42000 Pivot levels for the Day S1 S2 S3 Pivot R1 R2 R3 Gold 28357 28223 28147 28433 28566 28643 28930 Silver 41305 41140 40980 41465 41630 41790 42275 31st Jan’17
- 2. Equities I Commodities I Currencies I Mutual Funds Technical View: MCX Copper price has shown breakdown of its Head & Shoulder neck line at 403 levels on hourly chart and price have retested its breakdown neck line at 403 levels . On hourly chart MCX Copper prices have been trading below its 21 HEMA. Furthermore, momentum indicator RSI has been remained below 40 levels on hourly time frame, which suggest further downside momentum can be seen in the prices. For now we expect prices to move lower towards 390 levels in coming trading sessions. SEBI Registered - Research Analyst Equities I Commodities I Currencies I Mutual Funds MCX Copper Feb. Hourly Chart CMP: 398 MCX Copper (Feb) Trend: Bearish Price potential: 390 Reversal: 403 MCX Crude Oil Feb. Hourly Chart CMP: 3581 Technical View: MCX Crude Oil price has given breakdown of its symmetrical triangle pattern at hourly chart. NYMEX Crude Oil prices has given breakdown of its rising trend line at $53.40 levels on hourly chart. MCX Crude Oil has faced resistance of its horizontal trend line at 3680 levels. Moreover, Momentum indicator RSI has remained below 60 levels on hourly chart which suggest negative movement in the prices. For now we expect prices to move lower towards 3500 levels in coming trading sessions. MCX Crude Oil (Feb) Trend: Bearish Price potential: 3500 Reversal: 3660 Pivot levels for the Day S1 S2 S3 Pivot R1 R2 R3 Copper 394.9 392.2 387.2 400 403 408 420 Crude 3566 3547 3509 3604 3623 3661 3755 Base Metal Energy Aaj Ka Trend 31st Jan’17
- 3. Equities I Commodities I Currencies I Mutual FundsSEBI Registered - Research Analyst Equities I Commodities I Currencies I Mutual Funds Other Base Metals & Energy S1 S2 S3 Pivot R1 R2 R3 Trend Copper 394.9 392.2 387.2 400 403 408 420 Aluminum 121.7 120.9 119.6 123.0 123.7 125.0 128.4 Lead 155.7 154.5 153.3 156.9 158.1 159.3 162.8 Nickel 646.2 639.6 635.2 650.6 657.2 661.6 677.0 Zinc 187.0 186.3 185.6 187.7 188.4 189.1 191.3 Natural Gas 218.1 214.8 209.9 223.0 226.3 231.2 244.4 Fundamental News: Gold prices were higher in European morning trade on Monday, starting the week off with gains as the dollar slumped after immigration curbs introduced by U.S. President Donald Trump heightened concerns about the impact of the new administration's policies on trade and the economy. Trump on Friday put a four-month hold on allowing refugees into the U.S. and temporarily barred travelers from Syria and six other Muslim-majority countries, saying the moves would help protect Americans from terrorist attacks. Headlines from Washington will most likely continue to dictate market sentiment this week, as traders focus on Trump for further details on his promises of tax reform, infrastructure spending and deregulation as well as trade policies. The annual rate of economic growth slowed to 1.9% in the three months to December the Commerce Department reported Friday, slowing sharply from the 3.5% rate of growth seen in the third quarter. Oil was mixed Monday on concerns increased U.S. supply could curtail the positive impact of output cuts agreed by other producers. Baker Hughes weekly data Friday showed an increase in the number of rigs operating in the U.S. of 15 to 556. OPEC and non-OPEC producers have agreed to cut output by some 1.8 million barrels a day in the first half of this year. U.S. natural gas futures declined on Monday, starting the week off with heavy losses as forecasts showing cold weather receding in key regions in the U.S. during the next few weeks dampened demand for the heating fuel. Aaj Ka Trend 31st Jan’17
- 4. Equities I Commodities I Currencies I Mutual FundsSEBI Registered - Research Analyst Equities I Commodities I Currencies I Mutual Funds International Market Commodity Closing Price Gold 1201.24 Silver 17.18 Crude Oil 52.39 Brent Crude Oil 55.06 Natural Gas 3.198 COMEX/NYMEX/ICE ( Precious Metals & Energy) Currency & Commodity Index Currency (Spot) Current Price USD / INR 67.95 Dollar Index 100.24 EUR / USD 1.0704 CRB Index* 191.26 Closing as on 30.01.17 *Closing as on 30.01.17 LME (Base Metals) ( $ per tones) Commodity Closing Price Copper 5820 Aluminum 1802 Zinc 2777 Lead 2342 Nickel 9680 SHFE (Base Metals) (Yuan per tones) Commodity Closing Price Copper 46560 Aluminum 13735 Zinc 22450 Lead 18340 Closing as on 30.01.17 Closing as on 30.01.17 LME INVENTORY DATA Aaj Ka Trend 24-Jan-17 25-Jan-17 25-Jan-17 27-Jan-17 30-Jan-17 Aluminium -1550 -6600 -6600 -4150 Copper -2500 -4500 -4500 -5200 Lead -250 -650 -650 -1600 Nickel 3534 4540 4540 -288 Zinc -2475 -2675 -2675 -2725 31st Jan’17
- 5. Equities I Commodities I Currencies I Mutual Funds This is solely for information of clients of Choice Broking and does not construe to be an investment advice. It is also not intended as an offer or solicitation for the purchase and sale of any financial instruments. Any action taken by you on the basis of the information contained herein is your responsibility alone and Choice Broking its subsidiaries or its employees or associates will not be liable in any manner for the consequences of such action taken by you. We have exercised due diligence in checking the correctness and authenticity of the information contained in this recommendation, but Choice Broking or any of its subsidiaries or associates or employees shall not be in any way responsible for any loss or damage that may arise to any person from any inadvertent error in the information contained in this recommendation or any action taken on basis of this information. Technical analysis studies market psychology, price patterns and volume levels. It is used to forecast future price and market movements. Technical analysis is complementary to fundamental analysis and news sources. The recommendations issued herewith might be contrary to recommendations issued by Choice Broking in the company research undertaken as the recommendations stated in this report is derived purely from technical analysis. Choice Broking has based this document on information obtained from sources it believes to be reliable but which it has not independently verified; Choice Broking makes no guarantee, representation or warranty and accepts no responsibility or liability as to its accuracy or completeness. The opinions contained within the report are based upon publicly available information at the time of publication and are subject to change without notice. The information and any disclosures provided herein are in summary form and have been prepared for informational purposes. The recommendations and suggested price levels are intended purely for trading purposes. The recommendations are valid for the day of the report however trading trends and volumes might vary substantially on an intraday basis and the recommendations may be subject to change. The information and any disclosures provided herein may be considered confidential. Any use, distribution, modification, copying, forwarding or disclosure by any person is strictly prohibited. The information and any disclosures provided herein do not constitute a solicitation or offer to purchase or sell any security or other financial product or instrument. The current performance may be unaudited. Past performance does not guarantee future returns. There can be no assurance that investments will achieve any targeted rates of return, and there is no guarantee against the loss of your entire investment. POTENTIAL CONFLICT OF INTEREST DISCLOSURE (as on date of report) Disclosure of interest statement – • Analyst interest of the stock /Instrument(s): - No. • Firm interest of the stock / Instrument (s): - No. Disclaimer Contact Us Amit Pathania Research Associate amit.pathania@choiceindia.com www.choicebroking.incustomercare@choiceindia.com SEBI Registered - Research Analyst Equities I Commodities I Currencies I Mutual Funds Aaj Ka Trend 31st Jan’17 Neeraj Yadav Research Advisor neeraj.yadav@choiceindia.com Anish Vyas Senior Research Associate anish.vyas@choiceindia.com Anish Vyas Digitally signed by Anish Vyas DN: cn=Anish Vyas, o=Choice Merchandise Broking Pvt. Ltd, ou=Sr. Research Associate, email=anish.vyas@choiceindia.com, c=IN Date: 2017.01.31 09:02:05 +05'30'