
Recommended
More Related Content
What's hot
What's hot (20)
Similar to Aaj ka trend 07.07.16
Similar to Aaj ka trend 07.07.16 (20)
Recently uploaded
Recently uploaded (20)
Aaj ka trend 07.07.16
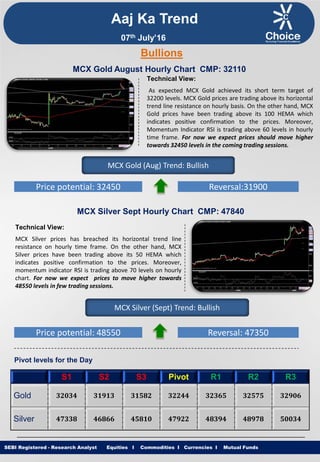
- 1. Equities I Commodities I Currencies I Mutual Funds Aaj Ka Trend Technical View: As expected MCX Gold achieved its short term target of 32200 levels. MCX Gold prices are trading above its horizontal trend line resistance on hourly basis. On the other hand, MCX Gold prices have been trading above its 100 HEMA which indicates positive confirmation to the prices. Moreover, Momentum Indicator RSI is trading above 60 levels in hourly time frame. For now we expect prices should move higher towards 32450 levels in the coming trading sessions. SEBI Registered - Research Analyst Equities I Commodities I Currencies I Mutual Funds Bullions MCX Gold August Hourly Chart CMP: 32110 MCX Gold (Aug) Trend: Bullish Price potential: 32450 Reversal:31900 MCX Silver Sept Hourly Chart CMP: 47840 Technical View: MCX Silver prices has breached its horizontal trend line resistance on hourly time frame. On the other hand, MCX Silver prices have been trading above its 50 HEMA which indicates positive confirmation to the prices. Moreover, momentum indicator RSI is trading above 70 levels on hourly chart. For now we expect prices to move higher towards 48550 levels in few trading sessions. MCX Silver (Sept) Trend: Bullish Price potential: 48550 Reversal: 47350 Pivot levels for the Day S1 S2 S3 Pivot R1 R2 R3 Gold 32034 31913 31582 32244 32365 32575 32906 Silver 47338 46866 45810 47922 48394 48978 50034 07th July’16
- 2. Equities I Commodities I Currencies I Mutual Funds Technical View: MCX Copper prices has witnessed Upward Channel breakdown at 322.10 levels on hourly chart. Furthermore, prices have been trading below its 50 HEMA on hourly chart. Moreover, Counter is trading below its Super Trend indicator on hourly time frame. On the other hand, momentum indicator RSI is trading below 40 levels on hourly chart. For now we expect prices to move lower towards 315.30 levels in coming trading sessions. SEBI Registered - Research Analyst Equities I Commodities I Currencies I Mutual Funds MCX Copper June hourly Chart CMP: 324.70 MCX Copper (June) Trend: Bearish Price potential: 315.30 Reversal: 328 MCX Crude Oil July. Hourly Chart CMP: 3206 Technical View: MCX Crude Oil prices have retest its horizontal trend line resistance on hourly basis. On the other hand prices have been trading below its 21 HEMA on MCX Crude Oil hourly chart. Furthermore, Negative Crossover is observed in momentum Indicator MACD on hourly basis. Moreover, Momentum indicator RSI is trading below 50 levels on hourly chart. For now we expect prices to move lower towards 3090 levels in coming trading sessions. MCX Crude Oil (July) Trend: Bearish Price potential: 3090 Reversal: 3220 Pivot levels for the Day S1 S2 S3 Pivot R1 R2 R3 Copper 321.5 319.2 313.9 324.5 326.8 329.8 335.1 Crude 3119 3080 3019 3141 3180 3202 3263 Base Metal Energy Aaj Ka Trend 07th July’16
- 3. Equities I Commodities I Currencies I Mutual FundsSEBI Registered - Research Analyst Equities I Commodities I Currencies I Mutual Funds Other Base Metals & Energy S1 S2 S3 Pivot R1 R2 R3 Trend Copper 321.5 319.2 313.9 324.5 326.8 329.8 335.1 Aluminum 110.6 109.8 108.6 111.0 111.8 112.2 113.4 Lead 122.0 120.5 118.0 122.9 124.4 125.4 127.8 Nickel 659.9 644.2 620.6 667.8 683.5 691.4 715.0 Zinc 140.4 138.6 135.9 141.4 143.2 144.1 146.9 Natural Gas 184.0 181.1 176.1 186.1 189.0 191.1 196.1 Fundamental News: Gold gained on Brexit concerns and silver continued its impressive sprint in Asia on Wednesday in thin trade with several markets shut to mark Eid al-Fitr and no major regional data ahead. Gold prices surged in European trade on Wednesday, climbing to the highest level since March 2014 as uncertainty surrounding global growth in wake of Britain’s vote to exit the EU sent investors flooding into safe haven assets. Gold rallied to its highest since 2014 on Wednesday and oil struggled to recover from deep losses, as renewed fears over the impact of Britain's exit from the European Union pushed investors toward safe havens. Gold prices jumped to the highest level since March 2014 on Wednesday, as fears over the Brexit fallout again took a toll on markets, sending investors flooding into safe haven assets. Oil prices stabilized in European trade on Wednesday, after plunging by as much as 5% overnight on the back of renewed concerns over the economic impact of Britain's vote to leave the European Union. Oil edged lower on Wednesday, extending losses to a third straight session, as investors grew concerned over consumption due to weaker demand from refineries and potentially slower economic growth after Britain's decision to leave the EU. Oil prices extended overnight loses in North American trade on Wednesday, falling towards two-month lows as Brexit-related uncertainties continued to spook the market. U.S. natural gas futures were down again on Wednesday, one day after posting its biggest daily loss in eight months as warm temperatures in key U.S. gas-consumption regions gave way to cooler readings. Aaj Ka Trend 07th July’16
- 4. Equities I Commodities I Currencies I Mutual FundsSEBI Registered - Research Analyst Equities I Commodities I Currencies I Mutual Funds International Market Commodity Closing Price Gold 1368.87 Silver 20.17 Crude Oil 47.71 Brent Crude Oil 49.08 Natural Gas 2.79 COMEX/NYMEX/ICE ( Precious Metals & Energy) Currency & Commodity Index Currency (Spot) Current Price USD / INR 67.45 Dollar Index 96.13 EUR / USD 1.1097 CRB Index* 189.95 Closing as on 06.07.16 *Closing as on 06.07.16 LME (Base Metals) ( $ per tones) Commodity Closing Price Copper 4750 Aluminum 1653 Zinc 2106 Lead 1834 Nickel 9985 SHFE (Base Metals) (Yuan per tones) Commodity Closing Price Copper 37200 Aluminum 12590 Zinc 16495 Lead 13000 Closing as on 06.07.16 Closing as on 06.07.16 LME INVENTORY DATA Aaj Ka Trend 29-June-16 30-June-16 01-July-16 04-July-16 06-July-16 Aluminium -6700 -5750 -5750 -7025 -6825 Copper 1250 -2675 -2400 -725 10525 Lead 900 -948 -75 -75 -350 Nickel -978 -1025 -228 -1452 -1266 Zinc -2350 16950 -475 -600 -350 07th July’16
- 5. Equities I Commodities I Currencies I Mutual Funds This is solely for information of clients of Choice Broking and does not construe to be an investment advice. It is also not intended as an offer or solicitation for the purchase and sale of any financial instruments. Any action taken by you on the basis of the information contained herein is your responsibility alone and Choice Broking its subsidiaries or its employees or associates will not be liable in any manner for the consequences of such action taken by you. We have exercised due diligence in checking the correctness and authenticity of the information contained in this recommendation, but Choice Broking or any of its subsidiaries or associates or employees shall not be in any way responsible for any loss or damage that may arise to any person from any inadvertent error in the information contained in this recommendation or any action taken on basis of this information. Technical analysis studies market psychology, price patterns and volume levels. It is used to forecast future price and market movements. Technical analysis is complementary to fundamental analysis and news sources. The recommendations issued herewith might be contrary to recommendations issued by Choice Broking in the company research undertaken as the recommendations stated in this report is derived purely from technical analysis. Choice Broking has based this document on information obtained from sources it believes to be reliable but which it has not independently verified; Choice Broking makes no guarantee, representation or warranty and accepts no responsibility or liability as to its accuracy or completeness. The opinions contained within the report are based upon publicly available information at the time of publication and are subject to change without notice. The information and any disclosures provided herein are in summary form and have been prepared for informational purposes. The recommendations and suggested price levels are intended purely for trading purposes. The recommendations are valid for the day of the report however trading trends and volumes might vary substantially on an intraday basis and the recommendations may be subject to change. The information and any disclosures provided herein may be considered confidential. Any use, distribution, modification, copying, forwarding or disclosure by any person is strictly prohibited. The information and any disclosures provided herein do not constitute a solicitation or offer to purchase or sell any security or other financial product or instrument. The current performance may be unaudited. Past performance does not guarantee future returns. There can be no assurance that investments will achieve any targeted rates of return, and there is no guarantee against the loss of your entire investment. POTENTIAL CONFLICT OF INTEREST DISCLOSURE (as on date of report) Disclosure of interest statement – • Analyst interest of the stock /Instrument(s): - No. • Firm interest of the stock / Instrument (s): - No. Disclaimer Contact Us Amit Pathania Research Associate amit.pathania@choiceindia.com Rohan Patil Research Associate rohan.patil@choiceindia.com www.choiceindia.comcustomercare@choiceindia.com SEBI Registered - Research Analyst Equities I Commodities I Currencies I Mutual Funds Aaj Ka Trend 07th July’16 Neeraj Yadav Research Advisor neeraj.yadav@choiceindia.com Anish Vyas Senior Research Associate anish.vyas@choiceindia.com Anish Vyas Digitally signed by Anish Vyas DN: cn=Anish Vyas, o=Choice Merchandise Broking Pvt. Ltd, ou=Sr. Research Associate, email=anish.vyas@choiceindia.com, c=IN Date: 2016.07.07 08:33:32 +05'30'