
Recommended
More Related Content
What's hot
What's hot (20)
Viewers also liked
Similar to Aaj ka trend 04.11.16
Similar to Aaj ka trend 04.11.16 (20)
Recently uploaded
Recently uploaded (20)
Aaj ka trend 04.11.16
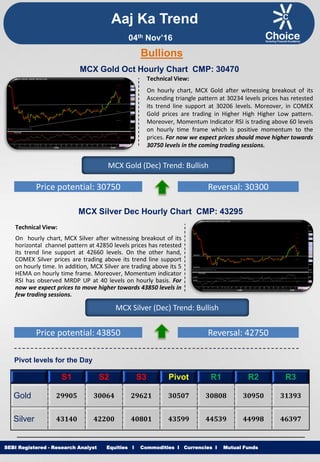
- 1. Equities I Commodities I Currencies I Mutual Funds Aaj Ka Trend Technical View: On hourly chart, MCX Gold after witnessing breakout of its Ascending triangle pattern at 30234 levels prices has retested its trend line support at 30206 levels. Moreover, in COMEX Gold prices are trading in Higher High Higher Low pattern. Moreover, Momentum Indicator RSI is trading above 60 levels on hourly time frame which is positive momentum to the prices. For now we expect prices should move higher towards 30750 levels in the coming trading sessions. SEBI Registered - Research Analyst Equities I Commodities I Currencies I Mutual Funds Bullions MCX Gold Oct Hourly Chart CMP: 30470 MCX Gold (Dec) Trend: Bullish Price potential: 30750 Reversal: 30300 MCX Silver Dec Hourly Chart CMP: 43295 Technical View: On hourly chart, MCX Silver after witnessing breakout of its horizontal channel pattern at 42850 levels prices has retested its trend line support at 42660 levels. On the other hand, COMEX Silver prices are trading above its trend line support on hourly time. In addition, MCX Silver are trading above its 5 HEMA on hourly time frame. Moreover, Momentum indicator RSI has observed MRDP UP at 40 levels on hourly basis. For now we expect prices to move higher towards 43850 levels in few trading sessions. MCX Silver (Dec) Trend: Bullish Price potential: 43850 Reversal: 42750 Pivot levels for the Day S1 S2 S3 Pivot R1 R2 R3 Gold 29905 30064 29621 30507 30808 30950 31393 Silver 43140 42200 40801 43599 44539 44998 46397 04th Nov’16
- 2. Equities I Commodities I Currencies I Mutual Funds Technical View: On hourly chart MCX Copper has observed breakout of its Pennant pattern at 329.75 levels. Moreover, prices have breached its trend line resistance on daily chart. Furthermore, MCX Copper is trading above its 21 HEMA on hourly time frame. Moreover, momentum indicator RSI is trading above 60 levels on hourly time frame which is bullish sign. For now we expect prices to move higher towards 338.50 levels in coming trading sessions. SEBI Registered - Research Analyst Equities I Commodities I Currencies I Mutual Funds MCX Copper Nov hourly Chart CMP: 331.85 MCX Copper (Nov) Trend: Bullish Price potential: 338.50 Reversal: 327 MCX Crude Oil Nov. Hourly Chart CMP: 2978 Technical View: MCX Crude Oil prices have been moving in rising wedge formation from past few months and price has witnessed breakdown at 3095 levels on hourly chart. In addition, Counter has witnessed breakdown of its Rising Channel pattern in NYMEX at $45.02 levels on daily chart. Moreover, Momentum indicator RSI is trading below 30 levels on hourly chart which suggest the negative movement in the prices. For now we expect prices to move lower 2930 towards levels in coming trading sessions. MCX Crude Oil (Nov) Trend: Bearish Price potential: 2930 Reversal: 3060 Pivot levels for the Day S1 S2 S3 Pivot R1 R2 R3 Copper 326.8 325.2 320.9 329.4 331.0 333.7 337.9 Crude 2992 2959 2887 3031 3064 3103 3175 Base Metal Energy Aaj Ka Trend 04th Nov’16
- 3. Equities I Commodities I Currencies I Mutual FundsSEBI Registered - Research Analyst Equities I Commodities I Currencies I Mutual Funds Other Base Metals & Energy S1 S2 S3 Pivot R1 R2 R3 Trend Copper 326.8 325.2 320.9 329.4 331.0 333.7 337.9 Aluminum 114.0 113.4 111.9 114.9 115.5 116.4 117.9 Lead 136.9 136.1 134.1 138.1 138.9 140.1 142.1 Nickel 689.7 688.4 681.4 695.4 696.7 702.4 709.4 Zinc 160.4 158.8 154.5 163.2 164.8 167.5 171.9 Natural Gas 184.6 180.2 173.4 187.0 191.4 193.8 200.6 Fundamental News: Gold prices fell in Asia on Thursday as expectations of a Fed rate hike by the end of the remained intact following the latest policy review. Gold prices held near the prior session's one-month high during European hours on Thursday, as the Federal Reserve signaled it could hike interest rates in December, while the uncertain U.S. election continued to cloud the market's outlook. Gold prices fell back below the $1,300-level during North American hours on Thursday, pulling back from the prior session's one-month high as the U.S. dollar and global stocks stabilized. Oil prices were higher during European hours on Thursday, after plunging nearly 3% to five-week lows in the prior session after data showed that crude supplies in the U.S. rose by the most since records began last week. Crude oil futures edged up on Thursday, supported by news of an attack on a Nigerian oil pipeline and a weaker U.S. dollar, after four days of falls over skepticism that a global glut in crude supplies could be stemmed. Oil Thursday recovered from five-week lows after a militant attack on an oil pipeline in Nigeria threatened supply. Oil prices stabilized during North American hours on Thursday, after plunging nearly 3% to five-week lows in the prior session after data showed that crude supplies in the U.S. rose by the most since records began last week. U.S. natural gas futures pushed higher on Thursday morning, after data showed that natural gas supplies in storage in the U.S. rose slightly less than forecast last week. Aaj Ka Trend 04th Nov’16
- 4. Equities I Commodities I Currencies I Mutual FundsSEBI Registered - Research Analyst Equities I Commodities I Currencies I Mutual Funds International Market Commodity Closing Price Gold 1300.01 Silver 18.24 Crude Oil 44.77 Brent Crude Oil 46.46 Natural Gas 2.80 COMEX/NYMEX/ICE ( Precious Metals & Energy) Currency & Commodity Index Currency (Spot) Current Price USD / INR 66.71 Dollar Index 97.28 EUR / USD 1.10 CRB Index* 183.38 Closing as on 03.11.16 *Closing as on 03.11.16 LME (Base Metals) ( $ per tones) Commodity Closing Price Copper 4915 Aluminum 1724 Zinc 2456 Lead 2070 Nickel 10400 SHFE (Base Metals) (Yuan per tones) Commodity Closing Price Copper 37570 Aluminum 13120 Zinc 17820 Lead 16120 Closing as on 03.11.16 Closing as on 03.11.16 LME INVENTORY DATA Aaj Ka Trend 27-Oct-16 31-Oct-16 01-Nov-16 02-Nov-16 03-Nov-16 Aluminium -5051 -4851 -4851 -3200 -4400 Copper -4774 -5049 -5049 -475 -8400 Lead -148 850 850 0 -125 Nickel -236 -524 -524 -102 174 Zinc -349 -174 -174 -150 -200 04th Nov’16
- 5. Equities I Commodities I Currencies I Mutual Funds This is solely for information of clients of Choice Broking and does not construe to be an investment advice. It is also not intended as an offer or solicitation for the purchase and sale of any financial instruments. Any action taken by you on the basis of the information contained herein is your responsibility alone and Choice Broking its subsidiaries or its employees or associates will not be liable in any manner for the consequences of such action taken by you. We have exercised due diligence in checking the correctness and authenticity of the information contained in this recommendation, but Choice Broking or any of its subsidiaries or associates or employees shall not be in any way responsible for any loss or damage that may arise to any person from any inadvertent error in the information contained in this recommendation or any action taken on basis of this information. Technical analysis studies market psychology, price patterns and volume levels. It is used to forecast future price and market movements. Technical analysis is complementary to fundamental analysis and news sources. The recommendations issued herewith might be contrary to recommendations issued by Choice Broking in the company research undertaken as the recommendations stated in this report is derived purely from technical analysis. Choice Broking has based this document on information obtained from sources it believes to be reliable but which it has not independently verified; Choice Broking makes no guarantee, representation or warranty and accepts no responsibility or liability as to its accuracy or completeness. The opinions contained within the report are based upon publicly available information at the time of publication and are subject to change without notice. The information and any disclosures provided herein are in summary form and have been prepared for informational purposes. The recommendations and suggested price levels are intended purely for trading purposes. The recommendations are valid for the day of the report however trading trends and volumes might vary substantially on an intraday basis and the recommendations may be subject to change. The information and any disclosures provided herein may be considered confidential. Any use, distribution, modification, copying, forwarding or disclosure by any person is strictly prohibited. The information and any disclosures provided herein do not constitute a solicitation or offer to purchase or sell any security or other financial product or instrument. The current performance may be unaudited. Past performance does not guarantee future returns. There can be no assurance that investments will achieve any targeted rates of return, and there is no guarantee against the loss of your entire investment. POTENTIAL CONFLICT OF INTEREST DISCLOSURE (as on date of report) Disclosure of interest statement – • Analyst interest of the stock /Instrument(s): - No. • Firm interest of the stock / Instrument (s): - No. Disclaimer Contact Us Amit Pathania Research Associate amit.pathania@choiceindia.com Rohan Patil Research Associate rohan.patil@choiceindia.com www.choicebroking.incustomercare@choiceindia.com SEBI Registered - Research Analyst Equities I Commodities I Currencies I Mutual Funds Aaj Ka Trend 04th Nov’16 Neeraj Yadav Research Advisor neeraj.yadav@choiceindia.com Anish Vyas Senior Research Associate anish.vyas@choiceindia.com Amit Pathania Digitally signed by Amit Pathania DN: cn=Amit Pathania, o=Choice Equity Broking Pvt. ltd, ou=Research Department, email=amit.pathania@choiceindia.com, c=IN Date: 2016.11.04 08:42:37 +05'30'