
Recommended
More Related Content
What's hot
What's hot (20)
Viewers also liked
Viewers also liked (17)
Similar to Aaj ka trend 14.02.17
Similar to Aaj ka trend 14.02.17 (20)
Recently uploaded
Recently uploaded (20)
Aaj ka trend 14.02.17
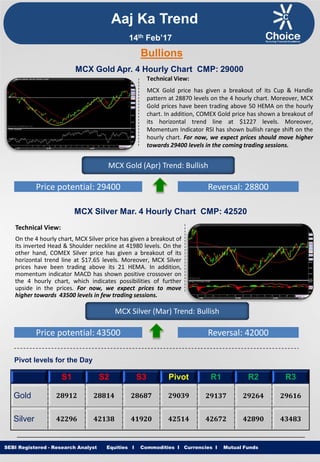
- 1. Equities I Commodities I Currencies I Mutual Funds Aaj Ka Trend Technical View: MCX Gold price has given a breakout of its Cup & Handle pattern at 28870 levels on the 4 hourly chart. Moreover, MCX Gold prices have been trading above 50 HEMA on the hourly chart. In addition, COMEX Gold price has shown a breakout of its horizontal trend line at $1227 levels. Moreover, Momentum Indicator RSI has shown bullish range shift on the hourly chart. For now, we expect prices should move higher towards 29400 levels in the coming trading sessions. SEBI Registered - Research Analyst Equities I Commodities I Currencies I Mutual Funds Bullions MCX Gold Apr. 4 Hourly Chart CMP: 29000 MCX Gold (Apr) Trend: Bullish Price potential: 29400 Reversal: 28800 MCX Silver Mar. 4 Hourly Chart CMP: 42520 Technical View: On the 4 hourly chart, MCX Silver price has given a breakout of its inverted Head & Shoulder neckline at 41980 levels. On the other hand, COMEX Silver price has given a breakout of its horizontal trend line at $17.65 levels. Moreover, MCX Silver prices have been trading above its 21 HEMA. In addition, momentum indicator MACD has shown positive crossover on the 4 hourly chart, which indicates possibilities of further upside in the prices. For now, we expect prices to move higher towards 43500 levels in few trading sessions. MCX Silver (Mar) Trend: Bullish Price potential: 43500 Reversal: 42000 Pivot levels for the Day S1 S2 S3 Pivot R1 R2 R3 Gold 28912 28814 28687 29039 29137 29264 29616 Silver 42296 42138 41920 42514 42672 42890 43483 14th Feb’17
- 2. Equities I Commodities I Currencies I Mutual Funds Technical View: MCX Copper price has given the breakout of its horizontal channel pattern at 411.50 levels on the hourly chart. On the hourly chart, COMEX Copper price has shown a breakout of its horizontal trend line at 2.75 levels. Furthermore, momentum indicator MACD has shown positive crossover and moved above its signal line levels on the hourly time frame, which suggests some huge upside momentum in the prices. For now, we expect prices to move higher towards 420 levels in coming trading sessions. SEBI Registered - Research Analyst Equities I Commodities I Currencies I Mutual Funds MCX Copper Feb. Hourly Chart CMP: 412 MCX Copper (Feb) Trend: Bullish Price potential: 420 Reversal: 406 MCX Crude Oil Feb. Hourly Chart CMP: 3550 Technical View: MCX Crude Oil price has given a breakdown of its rising trend line at 3590 levels and price has retested its breakdown trend line at 3620 levels. channel pattern at 3531 levels on the hourly chart. NYMEX Crude Oil prices have given a breakdown of its rising trend line at $53.90 levels on the hourly chart. Moreover, Momentum indicator RSI has remained below 60 levels on the hourly chart which suggests negative movement in the prices. For now, we expect prices to move lower towards 3450 levels in coming trading sessions. MCX Crude Oil (Feb) Trend: Bearish Price potential: 3450 Reversal: 3610 Pivot levels for the Day S1 S2 S3 Pivot R1 R2 R3 Copper 409.3 406.8 404.1 412 415 417 425 Crude 3520 3492 3447 3565 3593 3638 3756 Base Metal Energy Aaj Ka Trend 14th Feb’17
- 3. Equities I Commodities I Currencies I Mutual FundsSEBI Registered - Research Analyst Equities I Commodities I Currencies I Mutual Funds Other Base Metals & Energy S1 S2 S3 Pivot R1 R2 R3 Trend Copper 409.3 406.8 404.1 412 415 417 425 Aluminum 125.1 124.5 124.1 125.6 126.2 126.6 128.1 Lead 163.0 161.5 160.4 164.1 165.6 166.7 170.4 Nickel 713.7 708.6 704.7 717.6 722.7 726.6 739.6 Zinc 196.1 195.0 193.8 197.3 198.4 199.6 203.2 Natural Gas 197.8 195.8 193.5 200.1 202.1 204.4 211.1 Fundamental News: Gold prices were slightly lower in European morning trade on Monday, as recent actions by U.S. President Donald Trump helped soothe investor worries about uncertainty surrounding the new administration’s controversial policies. Prices of the yellow metal rallied to a three-month high of $1,246.60 last week amid growing concerns over political risks in Europe and economic uncertainty in the U.S. But futures pulled back as markets shifted focus back on Trump's efforts to boost economic growth after the president said his administration would be announcing "something phenomenal in terms of tax“ over "the next two or three weeks" during a meeting with airline executives last Thursday. Trump and Japanese Prime Minister Shinzo Abe appeared to have established a quick friendship, allaying investor fears of the meeting ending acrimoniously with Trump talking tough on trade, currency and security issues. Investors will also keep an eye out on a number of U.S. economic reports in the week ahead, including the January producer price index on Tuesday, the January consumer price index and retail sales on Wednesday and housing-related data on Thursday. Oil prices held on to overnight losses during North American morning hours on Monday, despite signs that major crude producers are adhering to planned output cuts. In its monthly oil market report released earlier, OPEC said its members pumped 32.14 million barrels per day in January, down 890,200 barrels per day from December, making a strong start to implementation of its first production cut in eight years. Aaj Ka Trend 14th Feb’17
- 4. Equities I Commodities I Currencies I Mutual FundsSEBI Registered - Research Analyst Equities I Commodities I Currencies I Mutual Funds International Market Commodity Closing Price Gold 1235 Silver 17.95 Crude Oil 53.87 Brent Crude Oil 56.79 Natural Gas 3.04 COMEX/NYMEX/ICE ( Precious Metals & Energy) Currency & Commodity Index Currency (Spot) Current Price USD / INR 66.84 Dollar Index 100.71 EUR / USD 1.06 CRB Index* 194.03 Closing as on 13.02.17 *Closing as on 13.02.17 LME (Base Metals) ( $ per tones) Commodity Closing Price Copper 6090 Aluminum 1875 Zinc 2924 Lead 2400 Nickel 10660 SHFE (Base Metals) (Yuan per tones) Commodity Closing Price Copper 49500 Aluminum 13940 Zinc 23780 Lead 19600 Closing as on 13.02.17 Closing as on 13.02.17 LME INVENTORY DATA Aaj Ka Trend 07-Feb-17 08-Feb-17 09-Feb-17 10-Feb-17 13-Feb-17 Aluminium 5524 -9251 -7902 -6201 -5450 Copper -247 1274 -3202 -3324 -375 Lead 100 -424 -74 -202 -50 Nickel 1115 -50 -661 -719 1176 Zinc -2802 -1452 -1049 -752 225 14th Feb’17
- 5. Equities I Commodities I Currencies I Mutual Funds This is solely for information of clients of Choice Broking and does not construe to be an investment advice. It is also not intended as an offer or solicitation for the purchase and sale of any financial instruments. Any action taken by you on the basis of the information contained herein is your responsibility alone and Choice Broking its subsidiaries or its employees or associates will not be liable in any manner for the consequences of such action taken by you. We have exercised due diligence in checking the correctness and authenticity of the information contained in this recommendation, but Choice Broking or any of its subsidiaries or associates or employees shall not be in any way responsible for any loss or damage that may arise to any person from any inadvertent error in the information contained in this recommendation or any action taken on basis of this information. Technical analysis studies market psychology, price patterns and volume levels. It is used to forecast future price and market movements. Technical analysis is complementary to fundamental analysis and news sources. The recommendations issued herewith might be contrary to recommendations issued by Choice Broking in the company research undertaken as the recommendations stated in this report is derived purely from technical analysis. Choice Broking has based this document on information obtained from sources it believes to be reliable but which it has not independently verified; Choice Broking makes no guarantee, representation or warranty and accepts no responsibility or liability as to its accuracy or completeness. The opinions contained within the report are based upon publicly available information at the time of publication and are subject to change without notice. The information and any disclosures provided herein are in summary form and have been prepared for informational purposes. The recommendations and suggested price levels are intended purely for trading purposes. The recommendations are valid for the day of the report however trading trends and volumes might vary substantially on an intraday basis and the recommendations may be subject to change. The information and any disclosures provided herein may be considered confidential. Any use, distribution, modification, copying, forwarding or disclosure by any person is strictly prohibited. The information and any disclosures provided herein do not constitute a solicitation or offer to purchase or sell any security or other financial product or instrument. The current performance may be unaudited. Past performance does not guarantee future returns. There can be no assurance that investments will achieve any targeted rates of return, and there is no guarantee against the loss of your entire investment. POTENTIAL CONFLICT OF INTEREST DISCLOSURE (as on date of report) Disclosure of interest statement – • Analyst interest of the stock /Instrument(s): - No. • Firm interest of the stock / Instrument (s): - No. Disclaimer Contact Us Amit Pathania Research Associate amit.pathania@choiceindia.com www.choicebroking.incustomercare@choiceindia.com SEBI Registered - Research Analyst Equities I Commodities I Currencies I Mutual Funds Aaj Ka Trend 14th Feb’17 Neeraj Yadav Research Advisor neeraj.yadav@choiceindia.com Anish Vyas Senior Research Associate anish.vyas@choiceindia.com Kkunal Parar Digitally signed by Kkunal Parar DN: cn=Kkunal Parar, o=Choice Equity Broking Pvt Ltd., ou=Research Dept., email=kkunal.parar@choiceindia.com, c=IN Date: 2017.02.14 09:35:50 +05'30'