
Recommended
More Related Content
What's hot
What's hot (20)
Similar to Aaj ka trend 30.06.16
Similar to Aaj ka trend 30.06.16 (20)
Recently uploaded
Recently uploaded (20)
Aaj ka trend 30.06.16
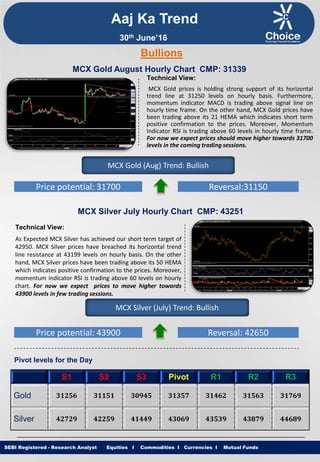
- 1. Equities I Commodities I Currencies I Mutual Funds Aaj Ka Trend Technical View: MCX Gold prices is holding strong support of its horizontal trend line at 31250 levels on hourly basis. Furthermore, momentum indicator MACD is trading above signal line on hourly time frame. On the other hand, MCX Gold prices have been trading above its 21 HEMA which indicates short term positive confirmation to the prices. Moreover, Momentum Indicator RSI is trading above 60 levels in hourly time frame. For now we expect prices should move higher towards 31700 levels in the coming trading sessions. SEBI Registered - Research Analyst Equities I Commodities I Currencies I Mutual Funds Bullions MCX Gold August Hourly Chart CMP: 31339 MCX Gold (Aug) Trend: Bullish Price potential: 31700 Reversal:31150 MCX Silver July Hourly Chart CMP: 43251 Technical View: As Expected MCX Silver has achieved our short term target of 42950. MCX Silver prices have breached its horizontal trend line resistance at 43199 levels on hourly basis. On the other hand, MCX Silver prices have been trading above its 50 HEMA which indicates positive confirmation to the prices. Moreover, momentum indicator RSI is trading above 60 levels on hourly chart. For now we expect prices to move higher towards 43900 levels in few trading sessions. MCX Silver (July) Trend: Bullish Price potential: 43900 Reversal: 42650 Pivot levels for the Day S1 S2 S3 Pivot R1 R2 R3 Gold 31256 31151 30945 31357 31462 31563 31769 Silver 42729 42259 41449 43069 43539 43879 44689 30th June’16
- 2. Equities I Commodities I Currencies I Mutual Funds Technical View: MCX Copper is trading in Rising Channel formation on hourly chart. Furthermore, prices have been trading above its 50 HEMA on hourly chart. Moreover, Counter is trading above its Super Trend indicator on hourly time frame. On the other hand, momentum indicator RSI is trading above 50 levels on hourly chart. For now we expect prices to move higher towards 333.50 levels in coming trading sessions. SEBI Registered - Research Analyst Equities I Commodities I Currencies I Mutual Funds MCX Copper June hourly Chart CMP: 325.30 MCX Copper (June) Trend: Bullish Price potential: 333.50 Reversal: 319 MCX Crude Oil July. Hourly Chart CMP: 3347 Technical View: As Expected MCX Crude oil has achieved our short term target of 3300. MCX Crude Oil has witnessed breakout of its Falling Channel Pattern at 3282 on hourly basis. On the other hand prices have been trading above its 21 HEMA on MCX Crude Oil hourly chart. Furthermore, counter is trading in Higher High Higher Low formation on daily chart. Moreover, Momentum indicator RSI is trading above 60 levels on hourly chart. For now we expect prices to move higher towards 3400 levels in coming trading sessions. MCX Crude Oil (July) Trend: Bullish Price potential: 3400 Reversal: 3270 Pivot levels for the Day S1 S2 S3 Pivot R1 R2 R3 Copper 322.8 320.9 317.7 324.1 326.0 327.3 330.5 Crude 3267 3207 3114 3300 3360 3393 3486 Base Metal Energy Aaj Ka Trend 30th June’16
- 3. Equities I Commodities I Currencies I Mutual FundsSEBI Registered - Research Analyst Equities I Commodities I Currencies I Mutual Funds Other Base Metals & Energy S1 S2 S3 Pivot R1 R2 R3 Trend Copper 322.8 320.9 317.7 324.1 326.0 327.3 330.5 Aluminum 109.1 108.5 107.6 109.5 110.0 110.4 111.4 Lead 117.6 116.1 113.8 118.4 119.9 120.7 123.0 Nickel 625.4 619.9 610.7 629.1 634.6 638.3 647.5 Zinc 139.4 138.3 136.4 140.2 141.3 142.1 144.0 Natural Gas 191.8 188.4 180.2 196.6 200.0 204.8 213.0 Fundamental News: Gold gained in Asia on Wednesday as investors noted continued friction over the timing of Britain's expected notification to exit the European Union. Gold prices were higher in European trade on Wednesday, bouncing back from the prior session’s losses as market players all but ruled out further rate hikes by the Federal Reserve this year in the aftermath of Britain’s shock vote to leave the EU. Gold prices were higher in North American trade on Wednesday, holding on to solid overnight gains after data showed that core PCE prices rose in line with market expectations in May. Oil prices pushed higher in European trade on Wednesday, extending overnight gains, amid speculation weekly supply data due later in the session will show U.S. crude inventories fell at a faster pace than expected last week. Oil futures Wednesday extended their recovery from Brexit as U.S. crude inventories fell. West Texas Intermediate oil futures extended overnight gains in North America trade on Wednesday, after data showed that oil supplies in the U.S. fell more than expected last week. Oil prices jumped more than 2 percent on Wednesday after the U.S. government reported a larger-than- expected weekly drawdown in crude inventories, adding fuel to an existing rally on fading concerns over Britain's exit from the European Union. U.S. natural gas futures rallied for the third straight session on Wednesday, to hit the highest level in more than a year as hot summer temperatures across most parts of the U.S. raised expectations for power generation demand to meet air conditioning needs. Aaj Ka Trend 30th June’16
- 4. Equities I Commodities I Currencies I Mutual FundsSEBI Registered - Research Analyst Equities I Commodities I Currencies I Mutual Funds International Market Commodity Closing Price Gold 1315.20 Silver 18.21 Crude Oil 49.47 Brent Crude Oil 50.10 Natural Gas 2.87 COMEX/NYMEX/ICE ( Precious Metals & Energy) Currency & Commodity Index Currency (Spot) Current Price USD / INR 67.68 Dollar Index 95.69 EUR / USD 1.1122 CRB Index* 194.63 Closing as on 29.06.16 *Closing as on 29.06.16 LME (Base Metals) ( $ per tones) Commodity Closing Price Copper 4838 Aluminum 1635.50 Zinc 2088 Lead 1770 Nickel 9440 SHFE (Base Metals) (Yuan per tones) Commodity Closing Price Copper 37580 Aluminum 12485 Zinc 16410 Lead 12960 Closing as on 29.06.16 Closing as on 29.06.16 LME INVENTORY DATA Aaj Ka Trend 23-June-16 24-June-16 27-June-16 28-June-16 29-June-16 Aluminium -6650 -5625 -6900 -8675 -6700 Copper 3675 -2000 -675 1250 1250 Lead -25 -25 -25 -275 900 Nickel -2064 -13985 -312 -708 -978 Zinc 18600 -1525 17625 -1200 -2350 30th June’16
- 5. Equities I Commodities I Currencies I Mutual Funds This is solely for information of clients of Choice Broking and does not construe to be an investment advice. It is also not intended as an offer or solicitation for the purchase and sale of any financial instruments. Any action taken by you on the basis of the information contained herein is your responsibility alone and Choice Broking its subsidiaries or its employees or associates will not be liable in any manner for the consequences of such action taken by you. We have exercised due diligence in checking the correctness and authenticity of the information contained in this recommendation, but Choice Broking or any of its subsidiaries or associates or employees shall not be in any way responsible for any loss or damage that may arise to any person from any inadvertent error in the information contained in this recommendation or any action taken on basis of this information. Technical analysis studies market psychology, price patterns and volume levels. It is used to forecast future price and market movements. Technical analysis is complementary to fundamental analysis and news sources. The recommendations issued herewith might be contrary to recommendations issued by Choice Broking in the company research undertaken as the recommendations stated in this report is derived purely from technical analysis. Choice Broking has based this document on information obtained from sources it believes to be reliable but which it has not independently verified; Choice Broking makes no guarantee, representation or warranty and accepts no responsibility or liability as to its accuracy or completeness. The opinions contained within the report are based upon publicly available information at the time of publication and are subject to change without notice. The information and any disclosures provided herein are in summary form and have been prepared for informational purposes. The recommendations and suggested price levels are intended purely for trading purposes. The recommendations are valid for the day of the report however trading trends and volumes might vary substantially on an intraday basis and the recommendations may be subject to change. The information and any disclosures provided herein may be considered confidential. Any use, distribution, modification, copying, forwarding or disclosure by any person is strictly prohibited. The information and any disclosures provided herein do not constitute a solicitation or offer to purchase or sell any security or other financial product or instrument. The current performance may be unaudited. Past performance does not guarantee future returns. There can be no assurance that investments will achieve any targeted rates of return, and there is no guarantee against the loss of your entire investment. POTENTIAL CONFLICT OF INTEREST DISCLOSURE (as on date of report) Disclosure of interest statement – • Analyst interest of the stock /Instrument(s): - No. • Firm interest of the stock / Instrument (s): - No. Disclaimer Contact Us Amit Pathania Research Associate amit.pathania@choiceindia.com Rohan Patil Research Associate rohan.patil@choiceindia.com www.choiceindia.comcustomercare@choiceindia.com SEBI Registered - Research Analyst Equities I Commodities I Currencies I Mutual Funds Aaj Ka Trend 30th June’16 Neeraj Yadav Research Advisor neeraj.yadav@choiceindia.com Anish Vyas Senior Research Associate anish.vyas@choiceindia.com Anish Vyas Digitally signed by Anish Vyas DN: cn=Anish Vyas, o=Choice Merchandise Broking Pvt. Ltd, ou=Sr. Research Associate, email=anish.vyas@choiceindia.com, c=IN Date: 2016.06.30 08:52:29 +05'30'