1. Equities I Commodities I Currencies I Mutual Funds
Aaj Ka Trend
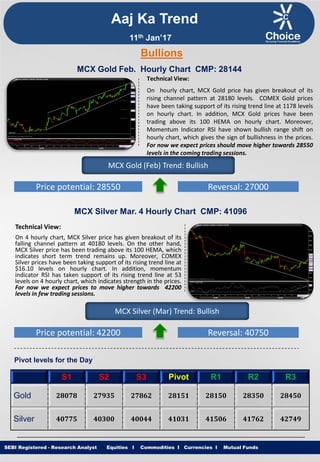
Technical View:
On hourly chart, MCX Gold price has given breakout of its
rising channel pattern at 28180 levels. COMEX Gold prices
have been taking support of its rising trend line at 1178 levels
on hourly chart. In addition, MCX Gold prices have been
trading above its 100 HEMA on hourly chart. Moreover,
Momentum Indicator RSI have shown bullish range shift on
hourly chart, which gives the sign of bullishness in the prices.
For now we expect prices should move higher towards 28550
levels in the coming trading sessions.
SEBI Registered - Research Analyst Equities I Commodities I Currencies I Mutual Funds
Bullions
MCX Gold Feb. Hourly Chart CMP: 28144
MCX Gold (Feb) Trend: Bullish
Price potential: 28550 Reversal: 27000
MCX Silver Mar. 4 Hourly Chart CMP: 41096
Technical View:
On 4 hourly chart, MCX Silver price has given breakout of its
falling channel pattern at 40180 levels. On the other hand,
MCX Silver price has been trading above its 100 HEMA, which
indicates short term trend remains up. Moreover, COMEX
Silver prices have been taking support of its rising trend line at
$16.10 levels on hourly chart. In addition, momentum
indicator RSI has taken support of its rising trend line at 53
levels on 4 hourly chart, which indicates strength in the prices.
For now we expect prices to move higher towards 42200
levels in few trading sessions.
MCX Silver (Mar) Trend: Bullish
Price potential: 42200 Reversal: 40750
Pivot levels for the Day
S1 S2 S3 Pivot R1 R2 R3
Gold 28078 27935 27862 28151 28150 28350 28450
Silver 40775 40300 40044 41031 41506 41762 42749
11th Jan’17
2. Equities I Commodities I Currencies I Mutual Funds
Technical View:
MCX Copper price has given breakout of its rising wedge
pattern at 390 levels on hourly chart. In addition MCX
Copper prices are trading below its 200 HEMA. On daily
chart MCX Copper price has shown breakout of its falling
channel pattern at 391 levels. Furthermore, momentum
indicator RSI has remained above 60 on daily time frame,
which suggest further upside momentum can be seen. For
now we expect prices to move higher towards 405 levels
in coming trading sessions.
SEBI Registered - Research Analyst Equities I Commodities I Currencies I Mutual Funds
MCX Copper Feb. Daily Chart CMP: 395.15
MCX Copper (Feb) Trend: Bullish
Price potential: 405 Reversal: 387
MCX Crude Oil Jan. Hourly Chart CMP: 3513
Technical View:
MCX Crude Oil prices has given breakdown of its rising trend
line at 3610 levels on hourly chart. MCX Crude Oil is trading
below its 50 HEMA on hourly chart. On the other hand,
NYMEX WTI Crude oil price has shown breakdown of its rising
trend line at $54 levels. Moreover, Momentum indicator
MACD has shown negative crossover and moving below its
signal line on hourly chart which suggest negative movement
in the prices. For now we expect prices to move lower
towards 3420 levels in coming trading sessions.
MCX Crude Oil (Jan) Trend: Bearish
Price potential: 3420 Reversal: 3670
Pivot levels for the Day
S1 S2 S3 Pivot R1 R2 R3
Copper 387.4 379.7 375.1 392.0 399.7 404.3 421.3
Crude 3486 3455 3411 3530 3561 3605 3725
Base Metal
Energy
Aaj Ka Trend
11th Jan’17
3. Equities I Commodities I Currencies I Mutual FundsSEBI Registered - Research Analyst Equities I Commodities I Currencies I Mutual Funds
Other Base Metals & Energy
S1 S2 S3 Pivot R1 R2 R3 Trend
Copper 387.4 379.7 375.1 392.0 399.7 404.3 421.3
Aluminum 119.9 120.6 122.0 118.6 117.9 116.5 113.2
Lead 145.7 142.3 140.6 147.4 150.8 152.5 159.4
Nickel 712.1 702.1 695.5 718.7 728.7 735.3 758.6
Zinc 182.7 180.2 177.6 185.3 187.8 190.4 198.0
Natural Gas 217.4 208.7 204.2 221.9 230.6 235.1 252.9
Fundamental News:
Gold prices rose to a six-week high on Tuesday, as the U.S. dollar weakened amid uncertainty surrounding the
Federal Reserve’s pace of interest-rate hikes.
The U.S. dollar index, which measures the greenback’s strength against a trade-weighted basket of six major
currencies, was down 0.2% at 101.72 in early trade. The index fell to as low as 101.48, pulling further away from
last week's 14-year high of 103.82.
Gold has been well-supported in recent sessions after minutes from the Fed’s December meeting unsettled
investors’ expectations about the pace of future interest rate hikes.
The U.S. central bank had indicated in December that at least three rate increases were in the offing for 2017,
according to a forecast of interest rates from members of the central bank, known as the dot-plot.
In addition, there are a handful of Fed speakers on tap, including Chair Janet Yellen on Thursday, as traders look
for more clues on the likelihood of higher interest rates later this year.
The focus remains on compliance with agreed output cuts of 1.8 million barrels a day by OPEC and non-OPEC
producers.
American Petroleum Institute U.S. crude inventory figures are due out later in the session.
These will be followed Wednesday by official Energy Information Administration figures on Wednesday.
Oil prices were modestly higher on Tuesday, rebounding from the prior session's sharp losses as market players
looked ahead to weekly data from the U.S. on stockpiles of crude and refined products.
Aaj Ka Trend
11th Jan’17
4. Equities I Commodities I Currencies I Mutual FundsSEBI Registered - Research Analyst Equities I Commodities I Currencies I Mutual Funds
International Market
Commodity Closing Price
Gold 1187.58
Silver 16.81
Crude Oil 50.97
Brent Crude Oil 53.76
Natural Gas 3.269
COMEX/NYMEX/ICE ( Precious Metals & Energy) Currency & Commodity Index
Currency (Spot) Current Price
USD / INR 68.18
Dollar Index 102.14
EUR / USD 1.0543
CRB Index* 191.13
Closing as on 10.01.17 *Closing as on 10.01.17
LME (Base Metals) ( $ per tones)
Commodity Closing Price
Copper 5758
Aluminum 1749
Zinc 2720
Lead 2189
Nickel 10615
SHFE (Base Metals) (Yuan per tones)
Commodity Closing Price
Copper 47010
Aluminum 12950
Zinc 22425
Lead 18675
Closing as on 10.01.17 Closing as on 10.01.17
LME INVENTORY DATA
Aaj Ka Trend
04-Jan-17 05-Jan-17 06-Jan-17 09-Jan-17 10-Jan-17
Aluminium -5701 25975 5425 -1101 16801
Copper -5949 -4100 -6650 -224 -1498
Lead -1000 -25 -175 -402 -402
Nickel -343 -804 -805 1094 -49
Zinc 54 -175 -75 -375 -801
11th Jan’17
5. Equities I Commodities I Currencies I Mutual Funds
This is solely for information of clients of Choice Broking and does not construe to be an investment advice. It is also not intended as an offer or solicitation
for the purchase and sale of any financial instruments. Any action taken by you on the basis of the information contained herein is your responsibility alone
and Choice Broking its subsidiaries or its employees or associates will not be liable in any manner for the consequences of such action taken by you. We
have exercised due diligence in checking the correctness and authenticity of the information contained in this recommendation, but Choice Broking or any of
its subsidiaries or associates or employees shall not be in any way responsible for any loss or damage that may arise to any person from any inadvertent
error in the information contained in this recommendation or any action taken on basis of this information. Technical analysis studies market psychology,
price patterns and volume levels. It is used to forecast future price and market movements. Technical analysis is complementary to fundamental analysis
and news sources. The recommendations issued herewith might be contrary to recommendations issued by Choice Broking in the company research
undertaken as the recommendations stated in this report is derived purely from technical analysis. Choice Broking has based this document on information
obtained from sources it believes to be reliable but which it has not independently verified; Choice Broking makes no guarantee, representation or warranty
and accepts no responsibility or liability as to its accuracy or completeness. The opinions contained within the report are based upon publicly available
information at the time of publication and are subject to change without notice. The information and any disclosures provided herein are in summary form
and have been prepared for informational purposes. The recommendations and suggested price levels are intended purely for trading purposes. The
recommendations are valid for the day of the report however trading trends and volumes might vary substantially on an intraday basis and the
recommendations may be subject to change. The information and any disclosures provided herein may be considered confidential. Any use, distribution,
modification, copying, forwarding or disclosure by any person is strictly prohibited. The information and any disclosures provided herein do not constitute a
solicitation or offer to purchase or sell any security or other financial product or instrument. The current performance may be unaudited. Past performance
does not guarantee future returns. There can be no assurance that investments will achieve any targeted rates of return, and there is no guarantee against
the loss of your entire investment.
POTENTIAL CONFLICT OF INTEREST DISCLOSURE (as on date of report) Disclosure of interest statement – • Analyst interest of the stock
/Instrument(s): - No. • Firm interest of the stock / Instrument (s): - No.
Disclaimer
Contact Us
Amit Pathania
Research Associate
amit.pathania@choiceindia.com
www.choicebroking.incustomercare@choiceindia.com
SEBI Registered - Research Analyst Equities I Commodities I Currencies I Mutual Funds
Aaj Ka Trend
11th Jan’17
Neeraj Yadav
Research Advisor
neeraj.yadav@choiceindia.com
Anish Vyas
Senior Research Associate
anish.vyas@choiceindia.com
Anish Vyas
Digitally signed by Anish Vyas
DN: cn=Anish Vyas, o=Choice Merchandise
Broking Pvt. Ltd, ou=Sr. Research Associate,
email=anish.vyas@choiceindia.com, c=IN
Date: 2017.01.11 09:20:57 +05'30'