1. Equities I Commodities I Currencies I Mutual Funds
Aaj Ka Trend
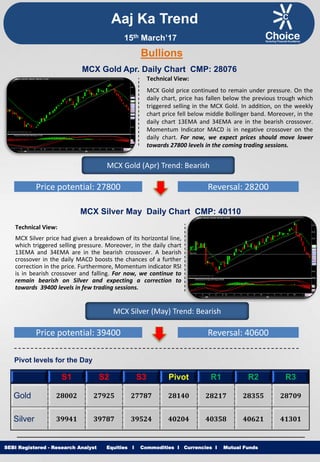
Technical View:
MCX Gold price continued to remain under pressure. On the
daily chart, price has fallen below the previous trough which
triggered selling in the MCX Gold. In addition, on the weekly
chart price fell below middle Bollinger band. Moreover, in the
daily chart 13EMA and 34EMA are in the bearish crossover.
Momentum Indicator MACD is in negative crossover on the
daily chart. For now, we expect prices should move lower
towards 27800 levels in the coming trading sessions.
SEBI Registered - Research Analyst Equities I Commodities I Currencies I Mutual Funds
Bullions
MCX Gold Apr. Daily Chart CMP: 28076
MCX Gold (Apr) Trend: Bearish
Price potential: 27800 Reversal: 28200
MCX Silver May Daily Chart CMP: 40110
Technical View:
MCX Silver price had given a breakdown of its horizontal line,
which triggered selling pressure. Moreover, in the daily chart
13EMA and 34EMA are in the bearish crossover. A bearish
crossover in the daily MACD boosts the chances of a further
correction in the price. Furthermore, Momentum indicator RSI
is in bearish crossover and falling. For now, we continue to
remain bearish on Silver and expecting a correction to
towards 39400 levels in few trading sessions.
MCX Silver (May) Trend: Bearish
Price potential: 39400 Reversal: 40600
Pivot levels for the Day
S1 S2 S3 Pivot R1 R2 R3
Gold 28002 27925 27787 28140 28217 28355 28709
Silver 39941 39787 39524 40204 40358 40621 41301
15th March’17
2. Equities I Commodities I Currencies I Mutual Funds
Technical View:
During the session, MCX Copper price has found resistance
at 21 EMA on the 4 hourly chart. In addition, on the daily
chart, a bearish crossover in the 13 EMA and 34 EMA
boosted the selling momentum at the higher levels.
Momentum indicator MACD has shown negative crossover
on the daily time frame, which suggests further downside
momentum in the price. For now, we expect prices to
move lower towards 375 levels in coming trading
sessions.
SEBI Registered - Research Analyst Equities I Commodities I Currencies I Mutual Funds
MCX Copper Apr. Daily Chart CMP: 385.85
MCX Copper (Apr) Trend: Bearish
Price potential: 375 Reversal: 391
MCX Crude Oil March. Daily Chart CMP: 3139
Technical View:
MCX Crude Oil price has slipped below previous session low
and corrected towards the previous trough of 3093 on the
daily chart. On the higher end 200 EMA has acted as
resistance for the rising price. On the lower end, immediate
support seen around the previous trough of 3093; sustained
trade below that level may attract more selling pressure. In
addition, bearish crossover in the daily MACD boosts the
bearishness in the Crude Oil price. For now, we expect
prices to move lower towards 3000 levels in the few trading
session.
MCX Crude Oil (March) Trend: Bearish
Price potential: 3000 Reversal: 3200
Pivot levels for the Day
S1 S2 S3 Pivot R1 R2 R3
Copper 380.3 376.2 372.8 384 388 391 402
Crude 3070 3027 2946 3151 3194 3275 3479
Base Metal
Energy
Aaj Ka Trend
15th March’17
3. Equities I Commodities I Currencies I Mutual FundsSEBI Registered - Research Analyst Equities I Commodities I Currencies I Mutual Funds
Other Base Metals & Energy
S1 S2 S3 Pivot R1 R2 R3 Trend
Copper 380.3 376.2 372.8 384 388 391 402
Aluminum 121.1 120.0 118.3 122.7 123.8 125.5 129.9
Lead 143.0 140.0 136.0 147.0 150.0 154.0 165.0
Nickel 663.7 655.3 648.7 670.3 678.7 685.3 707.0
Zinc 176.9 173.8 171.1 179.6 182.7 185.4 193.8
Natural Gas 190.8 187.5 181.6 196.7 200.0 205.9 221.1
Fundamental News:
Oil slumped Tuesday as Saudi Arabia reportedly raised its oil output in February. Saudi Arabia reportedly raised
output by 236,000 b/d to over 10 mn b/d in February from January.
Gold prices struggled near a six-week low during European morning hours on Tuesday, as investors prepared for
a rate hike by the Federal Reserve while focusing on political developments in Europe.
The dollar was higher against a basket of the other major currencies on Tuesday ahead of an expected interest
rate hike by the Federal Reserve, while sterling hit two-month lows as the prospect of Britain triggering its exit
from the European Union loomed.
Sterling fell to two-month lows against the dollar on Tuesday as the prospect of Britain triggering its exit from
the European Union and a second Scottish independence referendum weighed.
U.S. producer prices increased more than expected in February, and the year-on-year gain was the largest in
nearly five years, pointing to a steady rise inflation pressures.
The mood among German investors improved less than expected in March, a survey showed on Tuesday, as
uncertainty about the outcome of major European elections and their effect on the growth outlook for Europe's
biggest economy remained high.
Russia’s trade balance fell unexpectedly last month, official data showed on Tuesday.
In a report, Russian Federation State Committee on Statistics said that Russian Trade Balance fell to a seasonally
adjusted annual rate of 11.44B, from 11.83B in the preceding month.
Aaj Ka Trend
15th March’17
4. Equities I Commodities I Currencies I Mutual FundsSEBI Registered - Research Analyst Equities I Commodities I Currencies I Mutual Funds
International Market
Commodity Closing Price
Gold 1200.70
Silver 16.92
Crude Oil 48.46
Brent Crude Oil 51.59
Natural Gas 2.94
COMEX/NYMEX/ICE ( Precious Metals & Energy) Currency & Commodity Index
Currency (Spot) Current Price
USD / INR 66.75
Dollar Index 101.55
EUR / USD 1.06
CRB Index* 182.11
Closing as on 14.03.17 *Closing as on 14.03.17
LME (Base Metals) ( $ per tones)
Commodity Closing Price
Copper 5820
Aluminum 1860
Zinc 2744
Lead 2223
Nickel 10230
SHFE (Base Metals) (Yuan per tones)
Commodity Closing Price
Copper 47580
Aluminum 13680
Zinc 22740
Lead 17950
Closing as on 14.03.17 Closing as on 14.03.17
LME INVENTORY DATA
Aaj Ka Trend
07-March-17 08-March-17 09-March-17 13-March-17 14-March-17
Aluminium -23650 -16325 -16750 -16275 -14100
Copper 26725 26550 38775 -1800 5700
Lead -25 -25 675 675 675
Nickel 3816 5022 -288 -852 -1068
Zinc -425 -2175 -2175 -2475 3200
15th March’17
5. Equities I Commodities I Currencies I Mutual Funds
This is solely for information of clients of Choice Broking and does not construe to be an investment advice. It is also not intended as an offer or solicitation
for the purchase and sale of any financial instruments. Any action taken by you on the basis of the information contained herein is your responsibility alone
and Choice Broking its subsidiaries or its employees or associates will not be liable in any manner for the consequences of such action taken by you. We
have exercised due diligence in checking the correctness and authenticity of the information contained in this recommendation, but Choice Broking or any of
its subsidiaries or associates or employees shall not be in any way responsible for any loss or damage that may arise to any person from any inadvertent
error in the information contained in this recommendation or any action taken on basis of this information. Technical analysis studies market psychology,
price patterns and volume levels. It is used to forecast future price and market movements. Technical analysis is complementary to fundamental analysis
and news sources. The recommendations issued herewith might be contrary to recommendations issued by Choice Broking in the company research
undertaken as the recommendations stated in this report is derived purely from technical analysis. Choice Broking has based this document on information
obtained from sources it believes to be reliable but which it has not independently verified; Choice Broking makes no guarantee, representation or warranty
and accepts no responsibility or liability as to its accuracy or completeness. The opinions contained within the report are based upon publicly available
information at the time of publication and are subject to change without notice. The information and any disclosures provided herein are in summary form
and have been prepared for informational purposes. The recommendations and suggested price levels are intended purely for trading purposes. The
recommendations are valid for the day of the report however trading trends and volumes might vary substantially on an intraday basis and the
recommendations may be subject to change. The information and any disclosures provided herein may be considered confidential. Any use, distribution,
modification, copying, forwarding or disclosure by any person is strictly prohibited. The information and any disclosures provided herein do not constitute a
solicitation or offer to purchase or sell any security or other financial product or instrument. The current performance may be unaudited. Past performance
does not guarantee future returns. There can be no assurance that investments will achieve any targeted rates of return, and there is no guarantee against
the loss of your entire investment.
POTENTIAL CONFLICT OF INTEREST DISCLOSURE (as on date of report) Disclosure of interest statement – • Analyst interest of the stock
/Instrument(s): - No. • Firm interest of the stock / Instrument (s): - No.
Disclaimer
Contact Us
Amit Pathania
Research Associate
amit.pathania@choiceindia.com
www.choicebroking.incustomercare@choiceindia.com
SEBI Registered - Research Analyst Equities I Commodities I Currencies I Mutual Funds
Aaj Ka Trend
15th March’17
Neeraj Yadav
Research Advisor
neeraj.yadav@choiceindia.com
Anish Vyas
Senior Research Associate
anish.vyas@choiceindia.com
Amit Pathania
Digitally signed by Amit Pathania
DN: cn=Amit Pathania, o=Choice Equity Broking Pvt.
ltd, ou=Research Department,
email=amit.pathania@choiceindia.com, c=IN
Date: 2017.03.15 08:18:56 +05'30'