Aaj ka trend 04.05.16
•
0 likes•77 views

Bullions: MCX Gold June Hourly Chart CMP:30224: Technical View: MCX Gold Prices has broke its horizontal trend line resistance at 30240 levels on hourly chart. Furthermore, Counter has witnessed Rectangle formation breakout on daily time frame.

Recommended
More Related Content
What's hot
What's hot (20)
Viewers also liked
Viewers also liked (16)
Similar to Aaj ka trend 04.05.16
Similar to Aaj ka trend 04.05.16 (20)
Recently uploaded
Recently uploaded (20)
Aaj ka trend 04.05.16
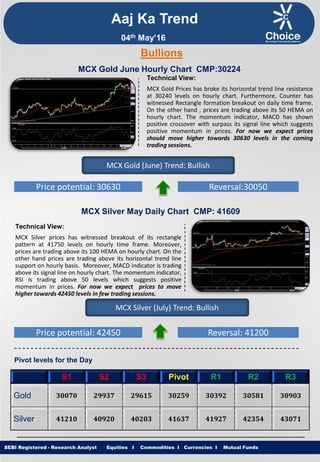
- 1. Equities I Commodities I Currencies I Mutual Funds Aaj Ka Trend Technical View: MCX Gold Prices has broke its horizontal trend line resistance at 30240 levels on hourly chart. Furthermore, Counter has witnessed Rectangle formation breakout on daily time frame. On the other hand , prices are trading above its 50 HEMA on hourly chart. The momentum indicator, MACD has shown positive crossover with surpass its signal line which suggests positive momentum in prices. For now we expect prices should move higher towards 30630 levels in the coming trading sessions. SEBI Registered - Research Analyst Equities I Commodities I Currencies I Mutual Funds Bullions MCX Gold June Hourly Chart CMP:30224 MCX Gold (June) Trend: Bullish Price potential: 30630 Reversal:30050 MCX Silver May Daily Chart CMP: 41609 Technical View: MCX Silver prices has witnessed breakout of its rectangle pattern at 41750 levels on hourly time frame. Moreover, prices are trading above its 100 HEMA on hourly chart. On the other hand prices are trading above its horizontal trend line support on hourly basis. Moreover, MACD indicator is trading above its signal line on hourly chart. The momentum indicator, RSI is trading above 50 levels which suggests positive momentum in prices. For now we expect prices to move higher towards 42450 levels in few trading sessions. MCX Silver (July) Trend: Bullish Price potential: 42450 Reversal: 41200 Pivot levels for the Day S1 S2 S3 Pivot R1 R2 R3 Gold 30070 29937 29615 30259 30392 30581 30903 Silver 41210 40920 40203 41637 41927 42354 43071 04th May’16
- 2. Equities I Commodities I Currencies I Mutual Funds Technical View: MCX Copper Prices have breached its upward slanting trend line support at 328.85 on hourly charts. However, MCX Copper prices is trading below its 21 HEMA on hourly chart which indicates short term trend remains down. Furthermore, in COMEX Copper has witnessed Head & Shoulder Breakdown at $ 2.228. On the other hand momentum indicator RSI has moved below 40 levels on hourly chart which gives negative confirmation to the prices. For now we expect prices to move lower towards 321 levels in coming trading sessions. SEBI Registered - Research Analyst Equities I Commodities I Currencies I Mutual Funds MCX Copper June hourly Chart CMP: 329.25 MCX Copper (June) Trend: Bearish Price potential: 321 Reversal: 335 MCX Crude Oil May. Hourly Chart CMP: 2912 Technical View: On Weekly chart, the MCX Crude Oil price has completed a “Bearish White Swan Harmonic Pattern” at 3115 levels, the co-ordinates of which are as follows. XA of the leg from 3989 to 2577 ,AB of the leg completed at 3303 (i.e.50% of XA leg.),BC of the leg completed at 1805 (i.e. 200% Fibonacci Projection of AB leg.) and CD of the leg completed at 3115 levels (i.e. 38.20% of XA and 88.60% Fibonacci Projection of BC leg.) For now we expect prices to move lower towards 2815 levels in coming trading sessions. MCX Crude Oil (May) Trend: Bearish Price potential: 2815 Reversal: 2955 Pivot levels for the Day S1 S2 S3 Pivot R1 R2 R3 Copper 327.4 325.1 319.1 331.1 333.4 337.1 343.1 Crude 2865 2822 2706 2938 2981 3054 3170 Base Metal Energy Aaj Ka Trend 04th May’16
- 3. Equities I Commodities I Currencies I Mutual FundsSEBI Registered - Research Analyst Equities I Commodities I Currencies I Mutual Funds Other Base Metals & Energy S1 S2 S3 Pivot R1 R2 R3 Trend Copper 327.4 325.1 319.1 331.1 333.4 337.1 343.1 Aluminum 107.5 106.1 102.7 109.6 111.0 113.0 116.5 Lead 116.7 115.9 113.7 118.0 118.8 120.2 122.3 Nickel 622.5 611.5 588.4 634.6 645.6 657.7 680.8 Zinc 125.2 124.0 121.2 126.9 128.0 129.7 132.6 Natural Gas 136.6 134.4 130.2 138.6 140.8 142.8 147.0 Fundamental News: Gold drifted higher Tuesday on a weaker than expected Caixin manufacturing survey for April in China, raising prospects of continued easy monetary policy. Gold futures climbed back above the key $1,300-level in European trade on Tuesday, as the U.S. dollar crashed to 15-month lows against a basket of other major currencies. Gold futures hovered around the key $1,300-level in North American trade on Tuesday, as investors monitored movements in the currency market while awaiting comments from a pair of Federal Reserve officials. Oil fell on Tuesday, as rising output from the Middle East and North Sea renewed concerns about a global supply overhang. Oil prices turned lower on Tuesday as the dollar pared back early losses and as rising Middle East output and fears over China's economic health weighed. OPEC has yet to agree on a long-term strategy as Saudi Arabia objects to a proposal from arch-rival Iran that the exporter group aim for tighter control of the oil market, sources said, pointing to deep divisions over the way forward. Oil prices were lower in North American trade on Tuesday, reversing its overnight gains, as market players looked ahead to fresh weekly information on U.S. stockpiles of crude and refined products. U.S. natural gas futures were higher on Tuesday, one day after plunging by the most in three months, as traders returned to the market to seek cheap valuations. Total U.S. natural gas storage stood at 2.557 trillion cubic feet as of last week, according to the U.S. Energy Information Administration, 34% higher than levels at this time a year ago and 32.6% above the five-year average for this time of year. Aaj Ka Trend 04th May’16
- 4. Equities I Commodities I Currencies I Mutual FundsSEBI Registered - Research Analyst Equities I Commodities I Currencies I Mutual Funds International Market Commodity Closing Price Gold 1286.15 Silver 17.47 Crude Oil 43.83 Brent Crude Oil 45.19 Natural Gas 2.08 COMEX/NYMEX/ICE ( Precious Metals & Energy) Currency & Commodity Index Currency (Spot) Current Price USD / INR 66.42 Dollar Index 93.02 EUR / USD 1.1501 CRB Index* 179.84 Closing as on 03.05.16 *Closing as on 03.05.16 LME (Base Metals) ( $ per tones) Commodity Closing Price Copper 4920 Aluminum 1633 Zinc 1898 Lead 1767 Nickel 9520 SHFE (Base Metals) (Yuan per tones) Commodity Closing Price Copper 37220 Aluminum 12535 Zinc 14925 Lead 14500 Closing as on 03.05.16 Closing as on 03.05.16 LME INVENTORY DATA Aaj Ka Trend 27-Apr-16 28-Apr-16 29-Apr-16 02-May-16 03-May-16 Aluminium -7075 -4250 -6750 0 -6650 Copper -275 -1475 -1225 0 5175 Lead 50 -375 75 0 -700 Nickel -1704 -600 1686 0 66 Zinc -225 -1175 -2525 0 -2475 04th May’16
- 5. Equities I Commodities I Currencies I Mutual Funds This is solely for information of clients of Choice Broking and does not construe to be an investment advice. It is also not intended as an offer or solicitation for the purchase and sale of any financial instruments. Any action taken by you on the basis of the information contained herein is your responsibility alone and Choice Broking its subsidiaries or its employees or associates will not be liable in any manner for the consequences of such action taken by you. We have exercised due diligence in checking the correctness and authenticity of the information contained in this recommendation, but Choice Broking or any of its subsidiaries or associates or employees shall not be in any way responsible for any loss or damage that may arise to any person from any inadvertent error in the information contained in this recommendation or any action taken on basis of this information. Technical analysis studies market psychology, price patterns and volume levels. It is used to forecast future price and market movements. Technical analysis is complementary to fundamental analysis and news sources. The recommendations issued herewith might be contrary to recommendations issued by Choice Broking in the company research undertaken as the recommendations stated in this report is derived purely from technical analysis. Choice Broking has based this document on information obtained from sources it believes to be reliable but which it has not independently verified; Choice Broking makes no guarantee, representation or warranty and accepts no responsibility or liability as to its accuracy or completeness. The opinions contained within the report are based upon publicly available information at the time of publication and are subject to change without notice. The information and any disclosures provided herein are in summary form and have been prepared for informational purposes. The recommendations and suggested price levels are intended purely for trading purposes. The recommendations are valid for the day of the report however trading trends and volumes might vary substantially on an intraday basis and the recommendations may be subject to change. The information and any disclosures provided herein may be considered confidential. Any use, distribution, modification, copying, forwarding or disclosure by any person is strictly prohibited. The information and any disclosures provided herein do not constitute a solicitation or offer to purchase or sell any security or other financial product or instrument. The current performance may be unaudited. Past performance does not guarantee future returns. There can be no assurance that investments will achieve any targeted rates of return, and there is no guarantee against the loss of your entire investment. POTENTIAL CONFLICT OF INTEREST DISCLOSURE (as on date of report) Disclosure of interest statement – • Analyst interest of the stock /Instrument(s): - No. • Firm interest of the stock / Instrument (s): - No. Disclaimer Contact Us Amit Pathania Research Associate amit.pathania@choiceindia.com Rohan Patil Research Associate rohan.patil@choiceindia.com www.choiceindia.comcustomercare@choiceindia.com SEBI Registered - Research Analyst Equities I Commodities I Currencies I Mutual Funds Aaj Ka Trend 04th May’16 Neeraj Yadav Research Advisor neeraj.yadav@choiceindia.com Anish Vyas Senior Research Associate anish.vyas@choiceindia.com Amit Pathania Digitally signed by Amit Pathania DN: cn=Amit Pathania, o=Choice Equity Broking Pvt. ltd, ou=Research Department, email=amit.pathania@choiceindia.com, c=IN Date: 2016.05.04 08:46:11 +05'30'