1. Equities I Commodities I Currencies I Mutual Funds
Aaj Ka Trend
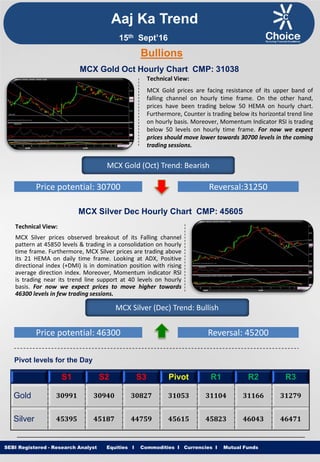
Technical View:
MCX Gold prices are facing resistance of its upper band of
falling channel on hourly time frame. On the other hand,
prices have been trading below 50 HEMA on hourly chart.
Furthermore, Counter is trading below its horizontal trend line
on hourly basis. Moreover, Momentum Indicator RSI is trading
below 50 levels on hourly time frame. For now we expect
prices should move lower towards 30700 levels in the coming
trading sessions.
SEBI Registered - Research Analyst Equities I Commodities I Currencies I Mutual Funds
Bullions
MCX Gold Oct Hourly Chart CMP: 31038
MCX Gold (Oct) Trend: Bearish
Price potential: 30700 Reversal:31250
MCX Silver Dec Hourly Chart CMP: 45605
Technical View:
MCX Silver prices observed breakout of its Falling channel
pattern at 45850 levels & trading in a consolidation on hourly
time frame. Furthermore, MCX Silver prices are trading above
its 21 HEMA on daily time frame. Looking at ADX, Positive
directional index (+DMI) is in domination position with rising
average direction index. Moreover, Momentum indicator RSI
is trading near its trend line support at 40 levels on hourly
basis. For now we expect prices to move higher towards
46300 levels in few trading sessions.
MCX Silver (Dec) Trend: Bullish
Price potential: 46300 Reversal: 45200
Pivot levels for the Day
S1 S2 S3 Pivot R1 R2 R3
Gold 30991 30940 30827 31053 31104 31166 31279
Silver 45395 45187 44759 45615 45823 46043 46471
15th Sept’16
2. Equities I Commodities I Currencies I Mutual Funds
Technical View:
On Daily chart, MCX Copper has completed a “Bullish
Cypher Harmonic Pattern” at 305.60 levels, the co-
ordinates of which are as follows. Technical Parameter: XA
of the leg from 298.05 to 337.10 ,AB of the leg completed
at 317.25 (i.e.50% of XA leg.),BC of the leg completed at
339.90 (i.e. 113% Fibonacci Projection of AB leg.) and CD of
the leg completed at 305.60 levels (i.e. 78.60% of XA and
141.40% Fibonacci Projection of BC leg). For now we expect
prices to move higher towards 329 levels in coming
trading sessions.
SEBI Registered - Research Analyst Equities I Commodities I Currencies I Mutual Funds
MCX Copper Nov hourly Chart CMP: 322.55
MCX Copper (Nov) Trend: Bullish
Price potential: 329 Reversal: 316
MCX Crude Oil Sept. Hourly Chart CMP: 2938
Technical View:
MCX Crude Oil prices have completed Bullish AB = CD
pattern at 2926 levels on hourly time frame. Furthermore,
Counter is trading above its 200 DEMA on daily chart.
Moreover, Momentum indicator RSI is trading near its trend
line support at 40 levels on hourly basis. For now we expect
prices to move higher towards 3015 levels in coming trading
sessions.
MCX Crude Oil (Sept) Trend: Bullish
Price potential: 3015 Reversal: 2900
Pivot levels for the Day
S1 S2 S3 Pivot R1 R2 R3
Copper 317.5 313.2 306.1 320.3 324.6 327.4 334.5
Crude 2898 2856 2744 2968 3010 3080 3192
Base Metal
Energy
Aaj Ka Trend
15th Sept’16
3. Equities I Commodities I Currencies I Mutual FundsSEBI Registered - Research Analyst Equities I Commodities I Currencies I Mutual Funds
Other Base Metals & Energy
S1 S2 S3 Pivot R1 R2 R3 Trend
Copper 317.5 313.2 306.1 320.3 324.6 327.4 334.5
Aluminum 104.3 103.4 102.0 104.9 105.8 106.3 107.8
Lead 127.1 124.0 119.0 129.1 132.2 134.1 139.2
Nickel 652.7 646.9 634.8 659.0 664.8 671.1 683.2
Zinc 149.5 147.1 143.0 151.2 153.6 155.3 159.4
Natural Gas 188.3 185.3 176.8 193.8 196.8 202.3 210.8
Fundamental News:
Gold price rose in early Asia on Wednesday, keeping momentum from overnight as investors generally doubt
the Federal Reserve will raise rates at next week's FOMC meeting.
Gold price eased in Asia on Wednesday after an initial gain as investors await the Federal Reserve's latest
decision on interest rates at next week's FOMC meeting.
Gold prices struggled near the lowest level in almost two weeks during Europe's session on Wednesday, ahead
of a closely-watched U.S. retail sales report on Thursday, which is expected to shape the market's near-term
interest rate expectations.
Oil prices firmed on Wednesday after falling by as much as 3 percent in the previous session, as data from an
industry group showed a smaller-than-expected build in U.S. crude stockpiles.
European and U.S. regulators have criticized China's farm policies for years but the country's leaders have
prioritized the sector to ensure self-sufficiency in staple food crops and boost rural incomes to address widening
inequalities with urban residents. To do that, Beijing has set goals to provide jobs across the farm belt, feed its
growing urban population and reduce its dependence on imports.
West Texas Intermediate oil futures pared losses, moving off a one-week low, in North American trade on
Wednesday, after data showed that oil supplies in the U.S. unexpectedly fell.
U.S. crude stocks unexpectedly fell in the latest week, official data showed Wednesday.
The Canadian dollar fell to fresh five-week lows against the U.S. dollar on Wednesday as continued weakness in
oil prices pressured the risk-sensitive commodity-linked currency lower.
Aaj Ka Trend
15th Sept’16
4. Equities I Commodities I Currencies I Mutual FundsSEBI Registered - Research Analyst Equities I Commodities I Currencies I Mutual Funds
International Market
Commodity Closing Price
Gold 1324.38
Silver 19.01
Crude Oil 43.64
Brent Crude Oil 46.04
Natural Gas 2.880
COMEX/NYMEX/ICE ( Precious Metals & Energy) Currency & Commodity Index
Currency (Spot) Current Price
USD / INR 66.89
Dollar Index 95.31
EUR / USD 1.1246
CRB Index* 179.49
Closing as on 14.09.16 *Closing as on 14.09.16
LME (Base Metals) ( $ per tones)
Commodity Closing Price
Copper 4771.50
Aluminum 1586
Zinc 2274
Lead 1960.50
Nickel 9840
SHFE (Base Metals) (Yuan per tones)
Commodity Closing Price
Copper 36640
Aluminum 11925
Zinc 17620
Lead 14045
Closing as on 14.09.16 Closing as on 14.09.16
LME INVENTORY DATA
Aaj Ka Trend
07-Sept-16 08-Sept-16 09-Sept-16 13-Sept-16 14-Sept-16
Aluminium -5450 -6700 -7052 -6300 -9250
Copper 10300 -1375 12378 3602 -1875
Lead -425 200 1148 0 0
Nickel -744 105 80 -182 84
Zinc -1350 -175 -1001 -801 -1125
15th Sept’16
5. Equities I Commodities I Currencies I Mutual Funds
This is solely for information of clients of Choice Broking and does not construe to be an investment advice. It is also not intended as an offer or solicitation
for the purchase and sale of any financial instruments. Any action taken by you on the basis of the information contained herein is your responsibility alone
and Choice Broking its subsidiaries or its employees or associates will not be liable in any manner for the consequences of such action taken by you. We
have exercised due diligence in checking the correctness and authenticity of the information contained in this recommendation, but Choice Broking or any of
its subsidiaries or associates or employees shall not be in any way responsible for any loss or damage that may arise to any person from any inadvertent
error in the information contained in this recommendation or any action taken on basis of this information. Technical analysis studies market psychology,
price patterns and volume levels. It is used to forecast future price and market movements. Technical analysis is complementary to fundamental analysis
and news sources. The recommendations issued herewith might be contrary to recommendations issued by Choice Broking in the company research
undertaken as the recommendations stated in this report is derived purely from technical analysis. Choice Broking has based this document on information
obtained from sources it believes to be reliable but which it has not independently verified; Choice Broking makes no guarantee, representation or warranty
and accepts no responsibility or liability as to its accuracy or completeness. The opinions contained within the report are based upon publicly available
information at the time of publication and are subject to change without notice. The information and any disclosures provided herein are in summary form
and have been prepared for informational purposes. The recommendations and suggested price levels are intended purely for trading purposes. The
recommendations are valid for the day of the report however trading trends and volumes might vary substantially on an intraday basis and the
recommendations may be subject to change. The information and any disclosures provided herein may be considered confidential. Any use, distribution,
modification, copying, forwarding or disclosure by any person is strictly prohibited. The information and any disclosures provided herein do not constitute a
solicitation or offer to purchase or sell any security or other financial product or instrument. The current performance may be unaudited. Past performance
does not guarantee future returns. There can be no assurance that investments will achieve any targeted rates of return, and there is no guarantee against
the loss of your entire investment.
POTENTIAL CONFLICT OF INTEREST DISCLOSURE (as on date of report) Disclosure of interest statement – • Analyst interest of the stock
/Instrument(s): - No. • Firm interest of the stock / Instrument (s): - No.
Disclaimer
Contact Us
Amit Pathania
Research Associate
amit.pathania@choiceindia.com
Rohan Patil
Research Associate
rohan.patil@choiceindia.com
www.choicebroking.incustomercare@choiceindia.com
SEBI Registered - Research Analyst Equities I Commodities I Currencies I Mutual Funds
Aaj Ka Trend
15th Sept’16
Neeraj Yadav
Research Advisor
neeraj.yadav@choiceindia.com
Anish Vyas
Senior Research Associate
anish.vyas@choiceindia.com
Anish Vyas
Digitally signed by Anish Vyas
DN: cn=Anish Vyas, o=Choice Merchandise
Broking Pvt. Ltd, ou=Sr. Research Associate,
email=anish.vyas@choiceindia.com, c=IN
Date: 2016.09.15 09:07:12 +05'30'