
Recommended
More Related Content
What's hot
What's hot (20)
Viewers also liked
Viewers also liked (20)
Similar to Aaj ka trend 20.06.16
Similar to Aaj ka trend 20.06.16 (19)
Recently uploaded
Recently uploaded (20)
Aaj ka trend 20.06.16
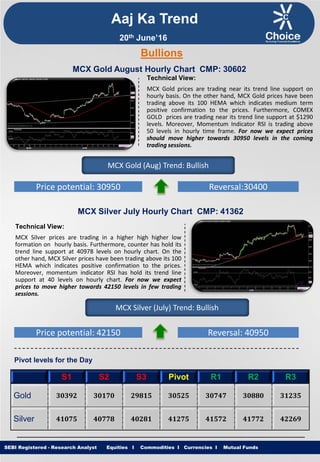
- 1. Equities I Commodities I Currencies I Mutual Funds Aaj Ka Trend Technical View: MCX Gold prices are trading near its trend line support on hourly basis. On the other hand, MCX Gold prices have been trading above its 100 HEMA which indicates medium term positive confirmation to the prices. Furthermore, COMEX GOLD prices are trading near its trend line support at $1290 levels. Moreover, Momentum Indicator RSI is trading above 50 levels in hourly time frame. For now we expect prices should move higher towards 30950 levels in the coming trading sessions. SEBI Registered - Research Analyst Equities I Commodities I Currencies I Mutual Funds Bullions MCX Gold August Hourly Chart CMP: 30602 MCX Gold (Aug) Trend: Bullish Price potential: 30950 Reversal:30400 MCX Silver July Hourly Chart CMP: 41362 Technical View: MCX Silver prices are trading in a higher high higher low formation on hourly basis. Furthermore, counter has hold its trend line support at 40978 levels on hourly chart. On the other hand, MCX Silver prices have been trading above its 100 HEMA which indicates positive confirmation to the prices. Moreover, momentum indicator RSI has hold its trend line support at 40 levels on hourly chart. For now we expect prices to move higher towards 42150 levels in few trading sessions. MCX Silver (July) Trend: Bullish Price potential: 42150 Reversal: 40950 Pivot levels for the Day S1 S2 S3 Pivot R1 R2 R3 Gold 30392 30170 29815 30525 30747 30880 31235 Silver 41075 40778 40281 41275 41572 41772 42269 20th June’16
- 2. Equities I Commodities I Currencies I Mutual Funds Technical View: MCX Copper prices have given breakdown of its Rising Channel formation at 304 levels on hourly chart. Furthermore, prices have been trading below its 21 HEMA on hourly chart. Moreover, momentum indicator MACD is trading below its signal line on hourly chart. On the other hand, momentum indicator RSI is trading below 50 levels on hourly chart. For now we expect prices to move lower towards 297 levels in coming trading sessions. SEBI Registered - Research Analyst Equities I Commodities I Currencies I Mutual Funds MCX Copper June hourly Chart CMP: 305 MCX Copper (June) Trend: Bearish Price potential: 297 Reversal: 310 MCX Crude Oil July. Hourly Chart CMP: 3246 Technical View: On Hourly chart MCX Crude Oil prices have given breakout of its Falling wedge pattern at 3251 levels. On the other hand prices have been trading above its 21 HEMA on MCX Crude Oil hourly chart. Counter is trading above its trend line support on hourly basis. Moreover, Momentum indicator RSI has rise above 60 levels on hourly chart. For now we expect prices to move higher towards 3335 levels in coming trading sessions. MCX Crude Oil (July) Trend: Bullish Price potential: 3335 Reversal: 3195 Pivot levels for the Day S1 S2 S3 Pivot R1 R2 R3 Copper 303.1 301.2 296.8 305.7 307.5 310.1 314.6 Crude 3203 3158 3086 3230 3275 3302 3374 Base Metal Energy Aaj Ka Trend 20th June’16
- 3. Equities I Commodities I Currencies I Mutual FundsSEBI Registered - Research Analyst Equities I Commodities I Currencies I Mutual Funds Other Base Metals & Energy S1 S2 S3 Pivot R1 R2 R3 Trend Copper 303.1 301.2 296.8 305.7 307.5 310.1 314.6 Aluminum 107.2 106.6 105.3 107.8 108.5 109.1 110.3 Lead 113.3 112.4 110.1 114.6 115.5 116.9 119.1 Nickel 597.6 589.1 575.0 603.2 611.7 617.3 631.4 Zinc 131.3 129.8 126.0 133.6 135.1 137.4 141.2 Natural Gas 173.0 170.3 165.9 174.7 177.4 179.1 183.5 Fundamental News: Gold prices slid lower on Friday, as traders locked in profits from the precious metal’s rally to 23-month highs on Thursday, sparked by a broadly weaker U.S. dollar. Gold retreated from 22-month highs on Friday amid heavy profit taking, as officials suspended Brexit campaigning for a second consecutive day following the tragic death of a Parliament member, throwing next week's closely-watched referendum into limbo. Gold soared nearly 2% to hit 22-month highs, as the Bank of Japan and Bank of England followed the lead of the Federal Reserve by standing pat at a pair of closely-watched central bank meetings. U.S. oil futures moved higher on Friday, after six consecutive sessions in the red as a weaker U.S. dollar lent support to the commodity and as concerns over a potential British exit from the European Union, Brexit, temporarily eased. Oil futures rose Friday for the first time in seven sessions as concerns about the prospect of Brexit abated. Crude oil prices rose on Friday for the first time in seven days, but are set to end the week lower as trading remains volatile before Britain's June 23 referendum on its EU membership. Crude futures halted a six-day losing streak on Friday, closing near session-highs, after shrugging off reports of a third consecutive weekly gain among U.S. oil rigs. Hedge funds and other big speculators cut their bullish bets on U.S. crude to the lowest in two months, trade data showed on Friday, as a resurgent dollar challenged oil bulls' attempts to keep the market above $50 a barrel. Aaj Ka Trend 20th June’16
- 4. Equities I Commodities I Currencies I Mutual FundsSEBI Registered - Research Analyst Equities I Commodities I Currencies I Mutual Funds International Market Commodity Closing Price Gold 1301.75 Silver 17.51 Crude Oil 48.26 Brent Crude Oil 49.38 Natural Gas 2.64 COMEX/NYMEX/ICE ( Precious Metals & Energy) Currency & Commodity Index Currency (Spot) Current Price USD / INR 67.06 Dollar Index 94.30 EUR / USD 1.1277 CRB Index* 192.37 Closing as on 17.06.16 *Closing as on 17.06.16 LME (Base Metals) ( $ per tones) Commodity Closing Price Copper 4554 Aluminum 1615 Zinc 1981 Lead 1693 Nickel 9065 SHFE (Base Metals) (Yuan per tones) Commodity Closing Price Copper 35320 Aluminum 19940 Zinc 15525 Lead 12650 Closing as on 17.06.16 Closing as on 17.06.16 LME INVENTORY DATA Aaj Ka Trend 13-June-16 14-June-16 15-June-16 16-June-16 17-June-16 Aluminium -5375 -7025 -2475 -6450 -6200 Copper -3050 -4350 -1125 -3125 -3100 Lead -930 -25 -150 -150 -50 Nickel -84 -3072 -1524 -516 -2382 Zinc -325 -4000 -875 -925 -17750 20th June’16
- 5. Equities I Commodities I Currencies I Mutual Funds This is solely for information of clients of Choice Broking and does not construe to be an investment advice. It is also not intended as an offer or solicitation for the purchase and sale of any financial instruments. Any action taken by you on the basis of the information contained herein is your responsibility alone and Choice Broking its subsidiaries or its employees or associates will not be liable in any manner for the consequences of such action taken by you. We have exercised due diligence in checking the correctness and authenticity of the information contained in this recommendation, but Choice Broking or any of its subsidiaries or associates or employees shall not be in any way responsible for any loss or damage that may arise to any person from any inadvertent error in the information contained in this recommendation or any action taken on basis of this information. Technical analysis studies market psychology, price patterns and volume levels. It is used to forecast future price and market movements. Technical analysis is complementary to fundamental analysis and news sources. The recommendations issued herewith might be contrary to recommendations issued by Choice Broking in the company research undertaken as the recommendations stated in this report is derived purely from technical analysis. Choice Broking has based this document on information obtained from sources it believes to be reliable but which it has not independently verified; Choice Broking makes no guarantee, representation or warranty and accepts no responsibility or liability as to its accuracy or completeness. The opinions contained within the report are based upon publicly available information at the time of publication and are subject to change without notice. The information and any disclosures provided herein are in summary form and have been prepared for informational purposes. The recommendations and suggested price levels are intended purely for trading purposes. The recommendations are valid for the day of the report however trading trends and volumes might vary substantially on an intraday basis and the recommendations may be subject to change. The information and any disclosures provided herein may be considered confidential. Any use, distribution, modification, copying, forwarding or disclosure by any person is strictly prohibited. The information and any disclosures provided herein do not constitute a solicitation or offer to purchase or sell any security or other financial product or instrument. The current performance may be unaudited. Past performance does not guarantee future returns. There can be no assurance that investments will achieve any targeted rates of return, and there is no guarantee against the loss of your entire investment. POTENTIAL CONFLICT OF INTEREST DISCLOSURE (as on date of report) Disclosure of interest statement – • Analyst interest of the stock /Instrument(s): - No. • Firm interest of the stock / Instrument (s): - No. Disclaimer Contact Us Amit Pathania Research Associate amit.pathania@choiceindia.com Rohan Patil Research Associate rohan.patil@choiceindia.com www.choiceindia.comcustomercare@choiceindia.com SEBI Registered - Research Analyst Equities I Commodities I Currencies I Mutual Funds Aaj Ka Trend 20th June’16 Neeraj Yadav Research Advisor neeraj.yadav@choiceindia.com Anish Vyas Senior Research Associate anish.vyas@choiceindia.com Amit Pathania Digitally signed by Amit Pathania DN: cn=Amit Pathania, o=Choice Equity Broking Pvt. ltd, ou=Research Department, email=amit.pathania@choiceindia.com, c=IN Date: 2016.06.18 15:49:56 +05'30'