Aaj ka trend 01.06.16
•
0 likes•75 views

#ChoiceBroking #Aajkatrend : #Bullions: #MCX Gold June Hourly Chart CMP: 28595

Recommended
More Related Content
What's hot
What's hot (20)
Viewers also liked
Viewers also liked (15)
Similar to Aaj ka trend 01.06.16
Similar to Aaj ka trend 01.06.16 (17)
Recently uploaded
Recently uploaded (20)
Aaj ka trend 01.06.16
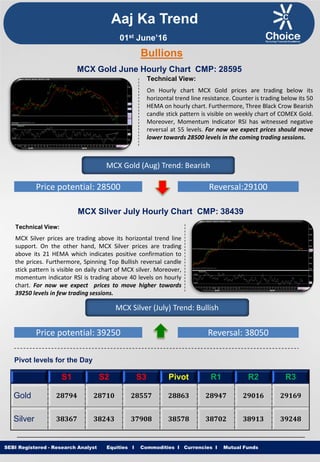
- 1. Equities I Commodities I Currencies I Mutual Funds Aaj Ka Trend Technical View: On Hourly chart MCX Gold prices are trading below its horizontal trend line resistance. Counter is trading below its 50 HEMA on hourly chart. Furthermore, Three Black Crow Bearish candle stick pattern is visible on weekly chart of COMEX Gold. Moreover, Momentum Indicator RSI has witnessed negative reversal at 55 levels. For now we expect prices should move lower towards 28500 levels in the coming trading sessions. SEBI Registered - Research Analyst Equities I Commodities I Currencies I Mutual Funds Bullions MCX Gold June Hourly Chart CMP: 28595 MCX Gold (Aug) Trend: Bearish Price potential: 28500 Reversal:29100 MCX Silver July Hourly Chart CMP: 38439 Technical View: MCX Silver prices are trading above its horizontal trend line support. On the other hand, MCX Silver prices are trading above its 21 HEMA which indicates positive confirmation to the prices. Furthermore, Spinning Top Bullish reversal candle stick pattern is visible on daily chart of MCX silver. Moreover, momentum indicator RSI is trading above 40 levels on hourly chart. For now we expect prices to move higher towards 39250 levels in few trading sessions. MCX Silver (July) Trend: Bullish Price potential: 39250 Reversal: 38050 Pivot levels for the Day S1 S2 S3 Pivot R1 R2 R3 Gold 28794 28710 28557 28863 28947 29016 29169 Silver 38367 38243 37908 38578 38702 38913 39248 01st June’16
- 2. Equities I Commodities I Currencies I Mutual Funds Technical View: On Hourly chart MCX Copper prices are trading in channel formation. However, MCX Copper prices are trading near its horizontal trend line support on hourly chart which indicates bulls to resume its uptrend. Furthermore, Counter is trading above its 100 HEMA on hourly time frame. On the other hand, momentum indicator RSI is trading near its support of 40 levels on hourly chart. For now we expect prices to move higher towards 322.50 levels in coming trading sessions. SEBI Registered - Research Analyst Equities I Commodities I Currencies I Mutual Funds MCX Copper June hourly Chart CMP: 312.70 MCX Copper (June) Trend: Bullish Price potential: 322.50 Reversal: 308.50 MCX Crude Oil June. Hourly Chart CMP: 3325 Technical View: On Hourly chart MCX Crude Oil prices are trading in rising channel formation. Moreover prices has formed higher top higher bottom formation on hourly basis. On the other hand counter is trading above its 100 HEMA on MCX Crude Oil hourly chart. Furthermore, COMEX Crude prices are trading above its trend line support. Moreover, MACD Indicator has witnessed positive crossover on hourly chart. For now we expect prices to move higher towards 3430 levels in coming trading sessions. MCX Crude Oil (June) Trend: Bullish Price potential: 3430 Reversal: 3300 Pivot levels for the Day S1 S2 S3 Pivot R1 R2 R3 Copper 312.4 311.1 308.3 313.9 315.2 316.7 319.5 Crude 3332 3306 3261 3351 3377 3396 3441 Base Metal Energy Aaj Ka Trend 01st June’16
- 3. Equities I Commodities I Currencies I Mutual FundsSEBI Registered - Research Analyst Equities I Commodities I Currencies I Mutual Funds Other Base Metals & Energy S1 S2 S3 Pivot R1 R2 R3 Trend Copper 312.4 311.1 308.3 313.9 315.2 316.7 319.5 Aluminum 104.3 103.9 103.0 104.7 105.2 105.6 106.4 Lead 113.7 113.0 111.4 114.5 115.3 116.1 117.6 Nickel 567.7 563.6 553.4 573.8 577.9 584.0 594.2 Zinc 127.8 126.5 124.3 128.7 130.0 130.9 133.1 Natural Gas 148.7 143.8 136.4 151.2 156.1 158.6 166.0 Fundamental News: Gold prices fell in early Asia on Tuesday with sentiment downbeat on prospects for a rate hike by the Federal Reserve this summer seen growing. Gold futures struggled near the lowest level in more than three months in European trade on Tuesday, as investors returning from the long Memorial Day weekend awaited data that could back some Federal Reserve officials' relatively optimistic views on the U.S. economy. Gold futures fell back towards the $1,200-level in North American trade on Tuesday, adding to overnight losses after data showed U.S. consumer spending surged by the most in seven years in April, supporting the case for the Federal Reserve to raise interest rates in coming months. Brent crude prices fell on Tuesday on rising output from the Middle East and ahead of an OPEC meeting on Thursday, while U.S. crude edged higher as the summer driving season began. Oil futures were mixed on Tuesday as investors weigh up the impact of an expected increase in supply from the Middle East. Global oversupply in crude oil is likely to limit price gains this year despite a series of unplanned outages and shrinking U.S. shale production, a Reuters poll showed on Tuesday. With the Organization of the Petroleum Exporting Countries preparing to meet later this week, analysts at Morgan Stanley said Tuesday that any coordinated action on cuts is unlikely. U.S. oil prices added to gains in North American trade on Tuesday, after a report from industry research group Genscape showed that supplies at the Cushing, Oklahoma delivery point for U.S. crude fell last week. U.S. natural gas futures rallied sharply on Tuesday, as forecasts for the coming week turned warmer, boosting near-term demand expectations for the heating fuel. Forecasts originally called for mild summer weather during the period. Aaj Ka Trend 01st June’16
- 4. Equities I Commodities I Currencies I Mutual FundsSEBI Registered - Research Analyst Equities I Commodities I Currencies I Mutual Funds International Market Commodity Closing Price Gold 1219.50 Silver 15.98 Crude Oil 48.87 Brent Crude Oil 49.57 Natural Gas 2.28 COMEX/NYMEX/ICE ( Precious Metals & Energy) Currency & Commodity Index Currency (Spot) Current Price USD / INR 67.26 Dollar Index 95.83 EUR / USD 1.1134 CRB Index* 186.15 Closing as on 31.05.16 *Closing as on 31.05.16 LME (Base Metals) ( $ per tones) Commodity Closing Price Copper 4671 Aluminum 1556 Zinc 1923 Lead 1700 Nickel 8435 SHFE (Base Metals) (Yuan per tones) Commodity Closing Price Copper 35330 Aluminum 12165 Zinc 14995 Lead 12680 Closing as on 31.05.16 Closing as on 31.05.16 LME INVENTORY DATA Aaj Ka Trend 25-May-16 26-May-16 27-May-16 30-May-16 31-May-16 Aluminium -5375 -4425 -5900 0 -4900 Copper -2000 725 -2225 0 -2025 Lead 5575 -275 -25 0 225 Nickel -630 -978 1848 0 -978 Zinc -600 -50 -2025 0 -2300 01st June’16
- 5. Equities I Commodities I Currencies I Mutual Funds This is solely for information of clients of Choice Broking and does not construe to be an investment advice. It is also not intended as an offer or solicitation for the purchase and sale of any financial instruments. Any action taken by you on the basis of the information contained herein is your responsibility alone and Choice Broking its subsidiaries or its employees or associates will not be liable in any manner for the consequences of such action taken by you. We have exercised due diligence in checking the correctness and authenticity of the information contained in this recommendation, but Choice Broking or any of its subsidiaries or associates or employees shall not be in any way responsible for any loss or damage that may arise to any person from any inadvertent error in the information contained in this recommendation or any action taken on basis of this information. Technical analysis studies market psychology, price patterns and volume levels. It is used to forecast future price and market movements. Technical analysis is complementary to fundamental analysis and news sources. The recommendations issued herewith might be contrary to recommendations issued by Choice Broking in the company research undertaken as the recommendations stated in this report is derived purely from technical analysis. Choice Broking has based this document on information obtained from sources it believes to be reliable but which it has not independently verified; Choice Broking makes no guarantee, representation or warranty and accepts no responsibility or liability as to its accuracy or completeness. The opinions contained within the report are based upon publicly available information at the time of publication and are subject to change without notice. The information and any disclosures provided herein are in summary form and have been prepared for informational purposes. The recommendations and suggested price levels are intended purely for trading purposes. The recommendations are valid for the day of the report however trading trends and volumes might vary substantially on an intraday basis and the recommendations may be subject to change. The information and any disclosures provided herein may be considered confidential. Any use, distribution, modification, copying, forwarding or disclosure by any person is strictly prohibited. The information and any disclosures provided herein do not constitute a solicitation or offer to purchase or sell any security or other financial product or instrument. The current performance may be unaudited. Past performance does not guarantee future returns. There can be no assurance that investments will achieve any targeted rates of return, and there is no guarantee against the loss of your entire investment. POTENTIAL CONFLICT OF INTEREST DISCLOSURE (as on date of report) Disclosure of interest statement – • Analyst interest of the stock /Instrument(s): - No. • Firm interest of the stock / Instrument (s): - No. Disclaimer Contact Us Amit Pathania Research Associate amit.pathania@choiceindia.com Rohan Patil Research Associate rohan.patil@choiceindia.com www.choiceindia.comcustomercare@choiceindia.com SEBI Registered - Research Analyst Equities I Commodities I Currencies I Mutual Funds Aaj Ka Trend 01st June’16 Neeraj Yadav Research Advisor neeraj.yadav@choiceindia.com Anish Vyas Senior Research Associate anish.vyas@choiceindia.com Anish Vyas Digitally signed by Anish Vyas DN: cn=Anish Vyas, o=Choice Merchandise Broking Pvt. Ltd, ou=Sr. Research Associate, email=anish.vyas@choiceindia.com, c=IN Date: 2016.06.01 08:56:03 +05'30'