
Recommended
More Related Content
What's hot
What's hot (20)
Viewers also liked
Viewers also liked (9)
Similar to Currency high lights 17.03.17
Similar to Currency high lights 17.03.17 (20)
Recently uploaded
Recently uploaded (20)
Currency high lights 17.03.17
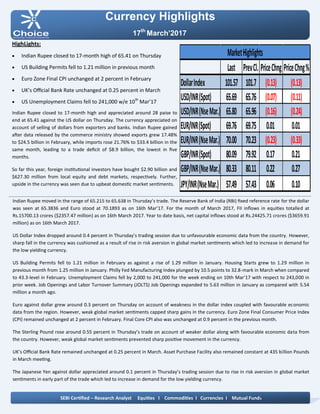
- 1. Currency Highlights 17th March’2017 HighLights: Indian Rupee closed to 17-month high of 65.41 on Thursday US Building Permits fell to 1.21 million in previous month Euro Zone Final CPI unchanged at 2 percent in February UK’s Official Bank Rate unchanged at 0.25 percent in March US Unemployment Claims fell to 241,000 w/e 10th Mar’17 Indian Rupee closed to 17-month high and appreciated around 28 paise to end at 65.41 against the US dollar on Thursday. The currency appreciated on account of selling of dollars from exporters and banks. Indian Rupee gained after data released by the commerce ministry showed exports grew 17.48% to $24.5 billion in February, while imports rose 21.76% to $33.4 billion in the same month, leading to a trade deficit of $8.9 billion, the lowest in five months. So far this year, foreign institutional investors have bought $2.90 billion and $627.30 million from local equity and debt markets, respectively. Further, upside in the currency was seen due to upbeat domestic market sentiments. Indian Rupee moved in the range of 65.215 to 65.638 in Thursday’s trade. The Reserve Bank of India (RBI) fixed reference rate for the dollar was seen at 65.3836 and Euro stood at 70.1893 as on 16th Mar’17. For the month of March 2017, FII inflows in equities totalled at Rs.15700.13 crores ($2357.47 million) as on 16th March 2017. Year to date basis, net capital inflows stood at Rs.24425.71 crores ($3659.91 million) as on 16th March 2017. US Dollar Index dropped around 0.4 percent in Thursday’s trading session due to unfavourable economic data from the country. However, sharp fall in the currency was cushioned as a result of rise in risk aversion in global market sentiments which led to increase in demand for the low yielding currency. US Building Permits fell to 1.21 million in February as against a rise of 1.29 million in January. Housing Starts grew to 1.29 million in previous month from 1.25 million in January. Philly Fed Manufacturing Index plunged by 10.5 points to 32.8-mark in March when compared to 43.3-level in February. Unemployment Claims fell by 2,000 to 241,000 for the week ending on 10th Mar’17 with respect to 243,000 in prior week. Job Openings and Labor Turnover Summary (JOLTS) Job Openings expanded to 5.63 million in January as compared with 5.54 million a month ago. Euro against dollar grew around 0.3 percent on Thursday on account of weakness in the dollar index coupled with favourable economic data from the region. However, weak global market sentiments capped sharp gains in the currency. Euro Zone Final Consumer Price Index (CPI) remained unchanged at 2 percent in February. Final Core CPI also was unchanged at 0.9 percent in the previous month. The Sterling Pound rose around 0.55 percent in Thursday’s trade on account of weaker dollar along with favourable economic data from the country. However, weak global market sentiments prevented sharp positive movement in the currency. UK’s Official Bank Rate remained unchanged at 0.25 percent in March. Asset Purchase Facility also remained constant at 435 billion Pounds in March meeting. The Japanese Yen against dollar appreciated around 0.1 percent in Thursday’s trading session due to rise in risk aversion in global market sentiments in early part of the trade which led to increase in demand for the low yielding currency. SEBI Certified – Research Analyst Equities I Commodities I Currencies I Mutual Funds Last PrevCl. PriceChng PriceChng% DollarIndex 101.57 101.7 (0.13) (0.13) USD/INR(Spot) 65.69 65.76 (0.07) (0.11) USD/INR(NseMar.) 65.80 65.96 (0.16) (0.24) EUR/INR(Spot) 69.76 69.75 0.01 0.01 EUR/INR(NseMar.) 70.00 70.23 (0.23) (0.33) GBP/INR(Spot) 80.09 79.92 0.17 0.21 GBP/INR(NseMar.) 80.33 80.11 0.22 0.27 JPY/INR(NseMar.) 57.49 57.43 0.06 0.10 MarketHighlights
- 2. Technical View: On a daily chart, the pair has been trading in horizontal channel pattern from past few months and price has taken the support of its horizontal channel pattern at 57.25 levels. Moreover, prices have been trading above its 10 HSMA which gives the sign of bullishness in the prices. On daily chart momentum indicator, RSI is taking support at 30 levels which indicate pull back in the prices. In addition, momentum indicator MACD has shown positive crossover which suggests strength in the prices on a daily chart. So for trading perspective, one can buy JPYINR in the range of 57.60 with SL of 58.10 for the target of 57.40 levels. Pivot levels for the Day Technical View: The pair has given a breakdown of its “Symmetrical Triangle” pattern at 66.60 levels on a daily chart. Moreover, prices have been trading above its 50 DSMA which gives the sign of bearishness in the prices. Furthermore, the price has shown a breakdown of its consolidation range from 67.40 to 66.60 levels on a daily chart. A momentum indicator RSI has remained below 45 levels, which suggest further negative momentum can be seen in the prices. In addition, momentum indicator MACD has shown negative crossover and moving below its signal line on a daily chart. So for trading perspective, one can sell USDINR in the range of 65.60 with SL of 66.80 for the target of 65.20 levels. Currency Highlights 17th March’2017 USDINR JPYINR SEBI Certified – Research Analyst Equities I Commodities I Currencies I Mutual Funds S3 S2 S1 Pivot R1 R2 R3 USDINR 64.89 65.32 65.56 65.75 65.99 66.18 66.61 JPYINR 56.62 57.00 57.25 57.38 57.63 57.76 58.14
- 3. Pivot levels for the Day Currency Highlights 17th March’2017 GBPINR EURINR Technical View: On a daily chart, prices have been trading in falling channel pattern from past few weeks and price has taken the support of its lower band of channel pattern at 69.60 levels. The price has taken the support of its falling trend line at 69.50 levels o daily chart. The pair has been trading above its 10 HSMA on the hourly chart, which suggests further positive momentum can be seen in the prices. On daily chart momentum oscillator, RSI has been taking support at 35 levels on a daily chart, which suggests bullishness in the prices. A momentum indicator MACD has shown positive crossover on the hourly chart, which supports our bullish view on the prices. For now, we can expect prices should move higher towards 70.90 levels in the coming trading session. Technical View: The pair has been trading in “Falling Wedge” pattern from past few weeks and price has taken support of its lower band of pattern at 80 levels on a daily chart. Moreover, prices have been trading above 10 HSMA, which suggest short term trend looks up. Moreover, momentum indicator MACD has given positive crossover on the hourly chart, which gives the sign of bullishness in the prices. The momentum indicator RSI has been trading near its support levels on the daily chart, which suggest the possibilities of further up side momentum in the prices. For now, we expect prices should move higher towards 81.10 levels in the coming trading sessions. SEBI Certified – Research Analyst Equities I Commodities I Currencies I Mutual Funds S3 S2 S1 Pivot R1 R2 R3 GBPINR 78.62 79.41 79.87 80.20 80.66 80.99 81.78 EURINR 69.03 69.50 69.87 69.97 70.34 70.44 70.91
- 4. Currency Highlights SEBI Certified – Research Analyst Equities I Commodities I Currencies I Mutual Funds 17th March’2017 Economic Indicators Date Time Data Prior Expected Impact Day 1 Day 1 G20 Meetings 17.03.17 07:30 PM Prelim UoM Consumer Senti- ment 96.1 97.1 Actual > Forecast = Good for currency; USDINR
- 5. Currency Highlights 17th March’2017 SEBI Certified – Research Analyst Equities I Commodities I Currencies I Mutual Funds Anish Vyas Digitally signed by Anish Vyas DN: cn=Anish Vyas, o=Choice Merchandise Broking Pvt. Ltd, ou=Sr. Research Associate, email=anish.vyas@choiceindia.com, c=IN Date: 2017.03.17 08:26:41 +05'30'