
Recommended
More Related Content
What's hot
What's hot (19)
Similar to Aaj ka trend 13.02.17
Similar to Aaj ka trend 13.02.17 (20)
Recently uploaded
Recently uploaded (20)
Aaj ka trend 13.02.17
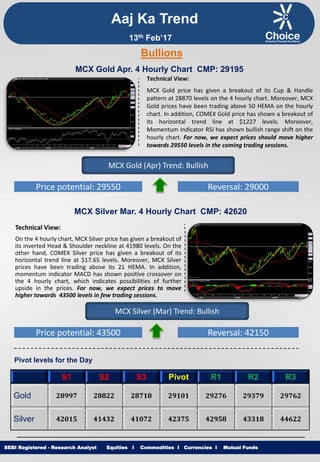
- 1. Equities I Commodities I Currencies I Mutual Funds Aaj Ka Trend Technical View: MCX Gold price has given a breakout of its Cup & Handle pattern at 28870 levels on the 4 hourly chart. Moreover, MCX Gold prices have been trading above 50 HEMA on the hourly chart. In addition, COMEX Gold price has shown a breakout of its horizontal trend line at $1227 levels. Moreover, Momentum Indicator RSI has shown bullish range shift on the hourly chart. For now, we expect prices should move higher towards 29550 levels in the coming trading sessions. SEBI Registered - Research Analyst Equities I Commodities I Currencies I Mutual Funds Bullions MCX Gold Apr. 4 Hourly Chart CMP: 29195 MCX Gold (Apr) Trend: Bullish Price potential: 29550 Reversal: 29000 MCX Silver Mar. 4 Hourly Chart CMP: 42620 Technical View: On the 4 hourly chart, MCX Silver price has given a breakout of its inverted Head & Shoulder neckline at 41980 levels. On the other hand, COMEX Silver price has given a breakout of its horizontal trend line at $17.65 levels. Moreover, MCX Silver prices have been trading above its 21 HEMA. In addition, momentum indicator MACD has shown positive crossover on the 4 hourly chart, which indicates possibilities of further upside in the prices. For now, we expect prices to move higher towards 43500 levels in few trading sessions. MCX Silver (Mar) Trend: Bullish Price potential: 43500 Reversal: 42150 Pivot levels for the Day S1 S2 S3 Pivot R1 R2 R3 Gold 28997 28822 28718 29101 29276 29379 29762 Silver 42015 41432 41072 42375 42958 43318 44622 13th Feb’17
- 2. Equities I Commodities I Currencies I Mutual Funds Technical View: MCX Copper prices has been trading in horizontal channel pattern and price has faced the resistance of its upper band of channel pattern at 410 levels on the hourly chart. On the hourly chart, COMEX Copper prices have been facing resistance of its horizontal trend line at 2.79 levels Furthermore, momentum indicator RSI has in oversold zone at 75 levels on the hourly time frame, which suggests some downside momentum in the prices. For now, we expect prices to move lower towards 400 levels in coming trading sessions. SEBI Registered - Research Analyst Equities I Commodities I Currencies I Mutual Funds MCX Copper Feb. Hourly Chart CMP: 408.10 MCX Copper (Feb) Trend: Bearish Price potential: 400 Reversal: 412 MCX Crude Oil Feb. Hourly Chart CMP: 3608 Technical View: MCX Crude Oil price has given a breakdown of its rising trend line at 3590 levels and price has retested its breakdown trend line at 3620 levels. channel pattern at 3531 levels on the hourly chart. NYMEX Crude Oil prices have given a breakdown of its rising trend line at $53.90 levels on the hourly chart. Moreover, Momentum indicator RSI has remained below 60 levels on the hourly chart which suggests negative movement in the prices. For now, we expect prices to move lower towards 3500 levels in coming trading sessions. MCX Crude Oil (Feb) Trend: Bearish Price potential: 3500 Reversal: 3672 Pivot levels for the Day S1 S2 S3 Pivot R1 R2 R3 Copper 396.5 384.8 378.7 403 414 420 444 Crude 3560 3511 3481 3590 3639 3669 3778 Base Metal Energy Aaj Ka Trend 13th Feb’17
- 3. Equities I Commodities I Currencies I Mutual FundsSEBI Registered - Research Analyst Equities I Commodities I Currencies I Mutual Funds Other Base Metals & Energy S1 S2 S3 Pivot R1 R2 R3 Trend Copper 396.5 384.8 378.7 403 414 420 444 Aluminum 123.4 121.9 121.1 124.2 125.6 126.4 129.5 Lead 158.0 154.8 153.0 159.8 163.0 164.8 171.5 Nickel 697.5 684.3 676.7 705.1 718.3 725.9 754.2 Zinc 191.7 187.0 184.5 194.2 198.9 201.4 211.2 Natural Gas 201.2 198.4 195.2 204.4 207.2 210.4 219.5 Fundamental News: U.S. consumer sentiment fell more than expected in February, dampening optimism over the effect on the economy, according to a report published on Friday. The preliminary publication of the data for February from the University of Michigan's Consumer Survey Center showed that consumer sentiment dropped to 95.7 from 98.5 in the previous month. Meanwhile, inflation expectations for the next 12 months rose to 2.8%, from the prior 2.6%, while the five-year gauge decreased to 2.5%, from the prior 2.6%. The US dollar index, which tracks the greenback against a basket of six major rivals, was at 100.81, compared to 100.89 ahead of the report. Buoyant oil prices since Donald Trump's election have provided no lasting halo effect for energy stocks as the sector's profit rebound has lacked vigor, but that could change in the week ahead with a fresh crop of quarterly scorecards. Helped by OPEC output cuts, oil prices are up roughly 20 percent since Trump's victory, and U.S. crude (CLc1) has held above $50 a barrel since mid-December. U.S. Commodity Futures Trading Commission positioning data shows hedge funds and other speculators hold near-record-high net long positions in U.S. crude futures and options. Part of the underperformance in the sector looks to be attributable to a disappointment in quarterly results. Energy companies were expected to benefit from easy comparisons with last year, when the price of oil sank below $30 a barrel, but so far they've under-delivered against those expectations. Aaj Ka Trend 13th Feb’17
- 4. Equities I Commodities I Currencies I Mutual FundsSEBI Registered - Research Analyst Equities I Commodities I Currencies I Mutual Funds International Market Commodity Closing Price Gold 1235 Silver 17.95 Crude Oil 53.87 Brent Crude Oil 56.79 Natural Gas 3.04 COMEX/NYMEX/ICE ( Precious Metals & Energy) Currency & Commodity Index Currency (Spot) Current Price USD / INR 66.84 Dollar Index 100.71 EUR / USD 1.06 CRB Index* 194.03 Closing as on 10.02.17 *Closing as on 10.02.17 LME (Base Metals) ( $ per tones) Commodity Closing Price Copper 6090 Aluminum 1875 Zinc 2924 Lead 2400 Nickel 10660 SHFE (Base Metals) (Yuan per tones) Commodity Closing Price Copper 49500 Aluminum 13940 Zinc 23780 Lead 19600 Closing as on 10.02.17 Closing as on 10.02.17 LME INVENTORY DATA Aaj Ka Trend 06-Feb-17 07-Feb-17 08-Feb-17 09-Feb-17 10-Feb-17 Aluminium -6874 5524 -9251 -7902 -6201 Copper -3426 -247 1274 -3202 -3324 Lead 100 100 -424 -74 -202 Nickel 104 1115 -50 -661 -719 Zinc -3148 -2802 -1452 -1049 -752 13th Feb’17
- 5. Equities I Commodities I Currencies I Mutual Funds This is solely for information of clients of Choice Broking and does not construe to be an investment advice. It is also not intended as an offer or solicitation for the purchase and sale of any financial instruments. Any action taken by you on the basis of the information contained herein is your responsibility alone and Choice Broking its subsidiaries or its employees or associates will not be liable in any manner for the consequences of such action taken by you. We have exercised due diligence in checking the correctness and authenticity of the information contained in this recommendation, but Choice Broking or any of its subsidiaries or associates or employees shall not be in any way responsible for any loss or damage that may arise to any person from any inadvertent error in the information contained in this recommendation or any action taken on basis of this information. Technical analysis studies market psychology, price patterns and volume levels. It is used to forecast future price and market movements. Technical analysis is complementary to fundamental analysis and news sources. The recommendations issued herewith might be contrary to recommendations issued by Choice Broking in the company research undertaken as the recommendations stated in this report is derived purely from technical analysis. Choice Broking has based this document on information obtained from sources it believes to be reliable but which it has not independently verified; Choice Broking makes no guarantee, representation or warranty and accepts no responsibility or liability as to its accuracy or completeness. The opinions contained within the report are based upon publicly available information at the time of publication and are subject to change without notice. The information and any disclosures provided herein are in summary form and have been prepared for informational purposes. The recommendations and suggested price levels are intended purely for trading purposes. The recommendations are valid for the day of the report however trading trends and volumes might vary substantially on an intraday basis and the recommendations may be subject to change. The information and any disclosures provided herein may be considered confidential. Any use, distribution, modification, copying, forwarding or disclosure by any person is strictly prohibited. The information and any disclosures provided herein do not constitute a solicitation or offer to purchase or sell any security or other financial product or instrument. The current performance may be unaudited. Past performance does not guarantee future returns. There can be no assurance that investments will achieve any targeted rates of return, and there is no guarantee against the loss of your entire investment. POTENTIAL CONFLICT OF INTEREST DISCLOSURE (as on date of report) Disclosure of interest statement – • Analyst interest of the stock /Instrument(s): - No. • Firm interest of the stock / Instrument (s): - No. Disclaimer Contact Us Amit Pathania Research Associate amit.pathania@choiceindia.com www.choicebroking.incustomercare@choiceindia.com SEBI Registered - Research Analyst Equities I Commodities I Currencies I Mutual Funds Aaj Ka Trend 13th Feb’17 Neeraj Yadav Research Advisor neeraj.yadav@choiceindia.com Anish Vyas Senior Research Associate anish.vyas@choiceindia.com Amit Pathania Digitally signed by Amit Pathania DN: cn=Amit Pathania, o=Choice Equity Broking Pvt. ltd, ou=Research Department, email=amit.pathania@choiceindia.com, c=IN Date: 2017.02.11 14:23:21 +05'30'