
Recommended
More Related Content
What's hot
What's hot (20)
Viewers also liked
Viewers also liked (20)
Similar to Aaj ka trend 06.09.16
Similar to Aaj ka trend 06.09.16 (20)
Recently uploaded
Recently uploaded (20)
Aaj ka trend 06.09.16
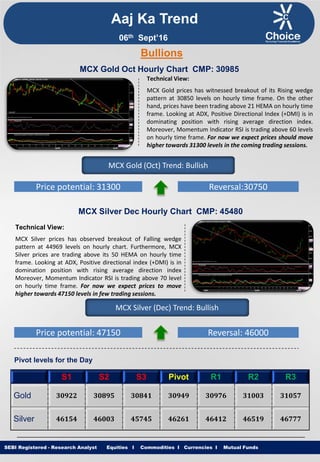
- 1. Equities I Commodities I Currencies I Mutual Funds Aaj Ka Trend Technical View: MCX Gold prices has witnessed breakout of its Rising wedge pattern at 30850 levels on hourly time frame. On the other hand, prices have been trading above 21 HEMA on hourly time frame. Looking at ADX, Positive Directional Index (+DMI) is in dominating position with rising average direction index. Moreover, Momentum Indicator RSI is trading above 60 levels on hourly time frame. For now we expect prices should move higher towards 31300 levels in the coming trading sessions. SEBI Registered - Research Analyst Equities I Commodities I Currencies I Mutual Funds Bullions MCX Gold Oct Hourly Chart CMP: 30985 MCX Gold (Oct) Trend: Bullish Price potential: 31300 Reversal:30750 MCX Silver Dec Hourly Chart CMP: 45480 Technical View: MCX Silver prices has observed breakout of Falling wedge pattern at 44969 levels on hourly chart. Furthermore, MCX Silver prices are trading above its 50 HEMA on hourly time frame. Looking at ADX, Positive directional index (+DMI) is in domination position with rising average direction index Moreover, Momentum Indicator RSI is trading above 70 level on hourly time frame. For now we expect prices to move higher towards 47150 levels in few trading sessions. MCX Silver (Dec) Trend: Bullish Price potential: 47150 Reversal: 46000 Pivot levels for the Day S1 S2 S3 Pivot R1 R2 R3 Gold 30922 30895 30841 30949 30976 31003 31057 Silver 46154 46003 45745 46261 46412 46519 46777 06th Sept’16
- 2. Equities I Commodities I Currencies I Mutual Funds Technical View: MCX Copper prices have completed Bullish AB = CD pattern on hourly chart. In addition, counter is holding support of lower band of channel. Moreover, MCX Copper is trading below its 50 HEMA on hourly chart. On the other hand, momentum indicator RSI is hovering near 50 levels on hourly chart. For now we expect prices to move higher towards 318 levels in coming trading sessions. SEBI Registered - Research Analyst Equities I Commodities I Currencies I Mutual Funds MCX Copper Nov hourly Chart CMP: 311.05 MCX Copper (Nov) Trend: Bullish Price potential: 318 Reversal: 305.50 MCX Crude Oil Sept. Hourly Chart CMP: 2981 Technical View: MCX Crude oil prices have taken support of its trend line on hourly time frame. Looking at ADX, Positive directional index (+DMI) is in domination position with rising average direction index. Counter is trading below its 21 HEMA on Hourly time chart. Moreover, Momentum indicator RSI is trading above 50 levels on hourly basis. For now we expect prices to move higher towards 3075 levels in coming trading sessions. MCX Crude Oil (Sept) Trend: Bullish Price potential: 3075 Reversal: 2950 Pivot levels for the Day S1 S2 S3 Pivot R1 R2 R3 Copper 309.6 308.9 307.7 310.2 310.8 311.4 319.9 Crude 2970 2936 2855 3017 3051 3098 3179 Base Metal Energy Aaj Ka Trend 06th Sept’16
- 3. Equities I Commodities I Currencies I Mutual FundsSEBI Registered - Research Analyst Equities I Commodities I Currencies I Mutual Funds Other Base Metals & Energy S1 S2 S3 Pivot R1 R2 R3 Trend Copper 309.6 308.9 307.7 310.2 310.8 311.4 312.7 Aluminum 104.4 104.1 103.2 105.1 105.4 106.0 107.0 Lead 130.0 129.7 128.9 130.4 130.8 131.2 131.9 Nickel 662.9 659.1 650.7 667.5 671.3 675.9 684.3 Zinc 156.7 156.4 155.8 157.1 157.3 157.7 158.4 Natural Gas 181.7 180.6 177.8 183.4 184.5 186.2 189.0 Fundamental News: Gold drifted lower in Asia on Monday with comments from the G-20 summit in China eyed for global coordination on monetary and fiscal policies. Gold prices held near a one-week high during European hours on Monday, as disappointing U.S. employment data diminished the likelihood that the Federal Reserve will raise interest rates at its policy meeting later this month. Gold prices held steady near a one-week high during North American hours on Monday, as trade volumes were expected to remain light with many investors in the U.S. away for the Labor Day holiday. Oil prices jumped Monday on reports of Saudi, Russian cooperation on output. Saudi Arabia and Russia signed a joint statement Monday to cooperate on stabilizing oil markets. Oil jumped Monday after Saudi Arabia and Russia agreed to cooperate to stabilize the market. Oil prices spiked sharply during European hours on Monday, amid reports that Saudi Arabia and Russia will work together to support the market, fueling hopes of an output freeze. Oil prices trimmed earlier gains during North American hours on Monday, after an announcement from Saudi Arabian and Russian officials failed to live up to market expectations. The U.S. dollar pared losses against its Canadian counterpart on Monday, although Friday’s downbeat U.S. employment data continued to weigh on the greenback, while climbing oil prices lent support the commodity- related Canadian dollar. Aaj Ka Trend 06th Sept’16
- 4. Equities I Commodities I Currencies I Mutual FundsSEBI Registered - Research Analyst Equities I Commodities I Currencies I Mutual Funds International Market Commodity Closing Price Gold 1327.30 Silver 19.54 Crude Oil 45.32 Brent Crude Oil 47.73 Natural Gas 2.755 COMEX/NYMEX/ICE ( Precious Metals & Energy) Currency & Commodity Index Currency (Spot) Current Price USD / INR 66.82 Dollar Index 95.75 EUR / USD 1.1151 CRB Index* 179.99 Closing as on 05.09.16 *Closing as on 05.09.16 LME (Base Metals) ( $ per tones) Commodity Closing Price Copper 4626 Aluminum 1580 Zinc 2361 Lead 1969.50 Nickel 10070 SHFE (Base Metals) (Yuan per tones) Commodity Closing Price Copper 36550 Aluminum 11915 Zinc 18245 Lead 14360 Closing as on 05.09.16 Closing as on 05.09.16 LME INVENTORY DATA Aaj Ka Trend 29-Aug-16 30-Aug-16 31-Aug-16 01-Sept-16 05-Sept-16 Aluminium 0 -6850 -5450 -6650 -6975 Copper 0 11650 10300 11250 13725 Lead 0 500 -425 -25 0 Nickel 0 294 -744 -1025 -666 Zinc 0 -875 -1350 -850 -575 06th Sept’16
- 5. Equities I Commodities I Currencies I Mutual Funds This is solely for information of clients of Choice Broking and does not construe to be an investment advice. It is also not intended as an offer or solicitation for the purchase and sale of any financial instruments. Any action taken by you on the basis of the information contained herein is your responsibility alone and Choice Broking its subsidiaries or its employees or associates will not be liable in any manner for the consequences of such action taken by you. We have exercised due diligence in checking the correctness and authenticity of the information contained in this recommendation, but Choice Broking or any of its subsidiaries or associates or employees shall not be in any way responsible for any loss or damage that may arise to any person from any inadvertent error in the information contained in this recommendation or any action taken on basis of this information. Technical analysis studies market psychology, price patterns and volume levels. It is used to forecast future price and market movements. Technical analysis is complementary to fundamental analysis and news sources. The recommendations issued herewith might be contrary to recommendations issued by Choice Broking in the company research undertaken as the recommendations stated in this report is derived purely from technical analysis. Choice Broking has based this document on information obtained from sources it believes to be reliable but which it has not independently verified; Choice Broking makes no guarantee, representation or warranty and accepts no responsibility or liability as to its accuracy or completeness. The opinions contained within the report are based upon publicly available information at the time of publication and are subject to change without notice. The information and any disclosures provided herein are in summary form and have been prepared for informational purposes. The recommendations and suggested price levels are intended purely for trading purposes. The recommendations are valid for the day of the report however trading trends and volumes might vary substantially on an intraday basis and the recommendations may be subject to change. The information and any disclosures provided herein may be considered confidential. Any use, distribution, modification, copying, forwarding or disclosure by any person is strictly prohibited. The information and any disclosures provided herein do not constitute a solicitation or offer to purchase or sell any security or other financial product or instrument. The current performance may be unaudited. Past performance does not guarantee future returns. There can be no assurance that investments will achieve any targeted rates of return, and there is no guarantee against the loss of your entire investment. POTENTIAL CONFLICT OF INTEREST DISCLOSURE (as on date of report) Disclosure of interest statement – • Analyst interest of the stock /Instrument(s): - No. • Firm interest of the stock / Instrument (s): - No. Disclaimer Contact Us Amit Pathania Research Associate amit.pathania@choiceindia.com Rohan Patil Research Associate rohan.patil@choiceindia.com www.choicebroking.incustomercare@choiceindia.com SEBI Registered - Research Analyst Equities I Commodities I Currencies I Mutual Funds Aaj Ka Trend 06th Sept’16 Neeraj Yadav Research Advisor neeraj.yadav@choiceindia.com Anish Vyas Senior Research Associate anish.vyas@choiceindia.com Anish Vyas Digitally signed by Anish Vyas DN: cn=Anish Vyas, o=Choice Merchandise Broking Pvt. Ltd, ou=Sr. Research Associate, email=anish.vyas@choiceindia.com, c=IN Date: 2016.09.06 09:06:13 +05'30'