
Recommended
More Related Content
What's hot
What's hot (20)
Viewers also liked
Viewers also liked (19)
Similar to Aaj ka trend 08.02.17
Similar to Aaj ka trend 08.02.17 (20)
Recently uploaded
Recently uploaded (20)
Aaj ka trend 08.02.17
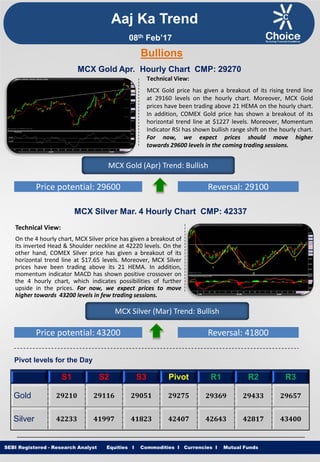
- 1. Equities I Commodities I Currencies I Mutual Funds Aaj Ka Trend Technical View: MCX Gold price has given a breakout of its rising trend line at 29160 levels on the hourly chart. Moreover, MCX Gold prices have been trading above 21 HEMA on the hourly chart. In addition, COMEX Gold price has shown a breakout of its horizontal trend line at $1227 levels. Moreover, Momentum Indicator RSI has shown bullish range shift on the hourly chart. For now, we expect prices should move higher towards 29600 levels in the coming trading sessions. SEBI Registered - Research Analyst Equities I Commodities I Currencies I Mutual Funds Bullions MCX Gold Apr. Hourly Chart CMP: 29270 MCX Gold (Apr) Trend: Bullish Price potential: 29600 Reversal: 29100 MCX Silver Mar. 4 Hourly Chart CMP: 42337 Technical View: On the 4 hourly chart, MCX Silver price has given a breakout of its inverted Head & Shoulder neckline at 42220 levels. On the other hand, COMEX Silver price has given a breakout of its horizontal trend line at $17.65 levels. Moreover, MCX Silver prices have been trading above its 21 HEMA. In addition, momentum indicator MACD has shown positive crossover on the 4 hourly chart, which indicates possibilities of further upside in the prices. For now, we expect prices to move higher towards 43200 levels in few trading sessions. MCX Silver (Mar) Trend: Bullish Price potential: 43200 Reversal: 41800 Pivot levels for the Day S1 S2 S3 Pivot R1 R2 R3 Gold 29210 29116 29051 29275 29369 29433 29657 Silver 42233 41997 41823 42407 42643 42817 43400 08th Feb’17
- 2. Equities I Commodities I Currencies I Mutual Funds Technical View: MCX Copper price has taken the support of its rising trend line at 388 levels on the hourly chart. On the hourly chart, MCX Copper prices have been trading above its 200 HEMA. Furthermore, momentum indicator MACD has shown positive crossover on 4 hourly time frame, which suggests further upside momentum can be seen in the prices. For now, we expect prices to move higher towards 402 levels in coming trading sessions. SEBI Registered - Research Analyst Equities I Commodities I Currencies I Mutual Funds MCX Copper Feb. Hourly Chart CMP: 393 MCX Copper (Feb) Trend: Bullish Price potential: 402 Reversal: 387 MCX Crude Oil Feb. Hourly Chart CMP: 3520 Technical View: MCX Crude Oil price has given a breakdown of its falling channel pattern at 3531 levels on the hourly chart. NYMEX Crude Oil prices have given the a breakdown of its rising trend line at $53.70 levels on the hourly chart. MCX Crude Oil has shown breakdown of its rising trend line at 3531 levels on the hourly chart. Moreover, Momentum indicator MCAD has given negative crossover on hourly chart which suggests negative movement in the prices. For now, we expect prices to move lower towards 3420 levels in coming trading sessions. MCX Crude Oil (Feb) Trend: Bearish Price potential: 3420 Reversal: 3680 Pivot levels for the Day S1 S2 S3 Pivot R1 R2 R3 Copper 389.7 387.9 385.5 392 394 396 403 Crude 3483 3455 3403 3535 3563 3615 3746 Base Metal Energy Aaj Ka Trend 08th Feb’17
- 3. Equities I Commodities I Currencies I Mutual FundsSEBI Registered - Research Analyst Equities I Commodities I Currencies I Mutual Funds Other Base Metals & Energy S1 S2 S3 Pivot R1 R2 R3 Trend Copper 389.7 387.9 385.5 392 394 396 403 Aluminum 122.4 121.9 121.6 122.7 123.1 123.4 124.5 Lead 156.8 155.2 154.4 157.5 159.1 159.9 163.0 Nickel 693.1 688.6 683.9 697.8 702.3 707.0 720.9 Zinc 186.9 185.1 184.2 187.9 189.7 190.6 194.3 Natural Gas 208.3 204.6 202.2 210.7 214.4 216.8 225.3 Fundamental News: The U.S. trade balance fell more than expected in December, putting an end to two consecutive months of increases, official data showed on Tuesday. In a report, Bureau of Economic Analysis said that U.S. trade deficit fell to a seasonally adjusted $44.3 billion in December, from $45.7 billion in the preceding month whose figure was revised up from $45.2 billion. December exports were $190.7 billion, $5.0 billion more than November exports. December imports were $235.0 billion, $3.6 billion more than November imports. Several market experts have recently commented that the trade balance will be under watch given President Donald Trump’s promises to revamp trade deals to help the U.S. economy and reduce the country’s trade deficit. Gold prices were little changed in European morning trade on Tuesday, holding steady near the prior session's three-month high as investors sought the perceived safety of the yellow metal amid growing concerns over political risks in Europe and around the globe. Investors were largely focused on French politics, as far-right National Front leader Marine Le Pen launched her presidential bid over the weekend, vowing to fight globalization and take France out of the euro zone. Headlines from Washington will continue to dictate market sentiment as traders focus on Trump for further details on his promises of tax reform, infrastructure spending and deregulation as well as trade policies. Oil edged lower Tuesday as the focus turned to U.S. stockpile data. Brent crude was off 27 cents, or 0.48%, at $55.45 at 08:00 ET. U.S. crude shed 26 cents, or 0.49%, to $52.75. Aaj Ka Trend 08th Feb’17
- 4. Equities I Commodities I Currencies I Mutual FundsSEBI Registered - Research Analyst Equities I Commodities I Currencies I Mutual Funds International Market Commodity Closing Price Gold 1221.85 Silver 17.51 Crude Oil 53.86 Brent Crude Oil 56.80 Natural Gas 3.05 COMEX/NYMEX/ICE ( Precious Metals & Energy) Currency & Commodity Index Currency (Spot) Current Price USD / INR 67.15 Dollar Index 99.69 EUR / USD 1.07 CRB Index* 193.21 Closing as on 07.02.17 *Closing as on 07.02.17 LME (Base Metals) ( $ per tones) Commodity Closing Price Copper 5748 Aluminum 1827 Zinc 2769 Lead 2319 Nickel 10178 SHFE (Base Metals) (Yuan per tones) Commodity Closing Price Copper 46350 Aluminum 13540 Zinc 22250 Lead 18210 Closing as on 07.02.17 Closing as on 07.02.17 LME INVENTORY DATA Aaj Ka Trend 01-Feb-17 02-Feb-17 03-Feb-17 06-Feb-17 07-Feb-17 Aluminium 1025 -6875 -7024 -6874 5525 Copper -475 -1350 -2351 -3426 -275 Lead -400 325 -152 100 Nickel 330 -522 -149 104 1116 Zinc 1625 -1625 -1826 -3148 -2800 08th Feb’17
- 5. Equities I Commodities I Currencies I Mutual Funds This is solely for information of clients of Choice Broking and does not construe to be an investment advice. It is also not intended as an offer or solicitation for the purchase and sale of any financial instruments. Any action taken by you on the basis of the information contained herein is your responsibility alone and Choice Broking its subsidiaries or its employees or associates will not be liable in any manner for the consequences of such action taken by you. We have exercised due diligence in checking the correctness and authenticity of the information contained in this recommendation, but Choice Broking or any of its subsidiaries or associates or employees shall not be in any way responsible for any loss or damage that may arise to any person from any inadvertent error in the information contained in this recommendation or any action taken on basis of this information. Technical analysis studies market psychology, price patterns and volume levels. It is used to forecast future price and market movements. Technical analysis is complementary to fundamental analysis and news sources. The recommendations issued herewith might be contrary to recommendations issued by Choice Broking in the company research undertaken as the recommendations stated in this report is derived purely from technical analysis. Choice Broking has based this document on information obtained from sources it believes to be reliable but which it has not independently verified; Choice Broking makes no guarantee, representation or warranty and accepts no responsibility or liability as to its accuracy or completeness. The opinions contained within the report are based upon publicly available information at the time of publication and are subject to change without notice. The information and any disclosures provided herein are in summary form and have been prepared for informational purposes. The recommendations and suggested price levels are intended purely for trading purposes. The recommendations are valid for the day of the report however trading trends and volumes might vary substantially on an intraday basis and the recommendations may be subject to change. The information and any disclosures provided herein may be considered confidential. Any use, distribution, modification, copying, forwarding or disclosure by any person is strictly prohibited. The information and any disclosures provided herein do not constitute a solicitation or offer to purchase or sell any security or other financial product or instrument. The current performance may be unaudited. Past performance does not guarantee future returns. There can be no assurance that investments will achieve any targeted rates of return, and there is no guarantee against the loss of your entire investment. POTENTIAL CONFLICT OF INTEREST DISCLOSURE (as on date of report) Disclosure of interest statement – • Analyst interest of the stock /Instrument(s): - No. • Firm interest of the stock / Instrument (s): - No. Disclaimer Contact Us Amit Pathania Research Associate amit.pathania@choiceindia.com www.choicebroking.incustomercare@choiceindia.com SEBI Registered - Research Analyst Equities I Commodities I Currencies I Mutual Funds Aaj Ka Trend 08th Feb’17 Neeraj Yadav Research Advisor neeraj.yadav@choiceindia.com Anish Vyas Senior Research Associate anish.vyas@choiceindia.com Kkunal Parar Digitally signed by Kkunal Parar DN: cn=Kkunal Parar, o=Choice Equity Broking Pvt Ltd., ou=Research Dept., email=kkunal.parar@choiceindia.com, c=IN Date: 2017.02.08 09:38:31 +05'30'