
Recommended
More Related Content
What's hot
What's hot (20)
Viewers also liked
Viewers also liked (14)
Similar to MCX Gold, Silver Technical View
Similar to MCX Gold, Silver Technical View (20)
Recently uploaded
Recently uploaded (20)
MCX Gold, Silver Technical View
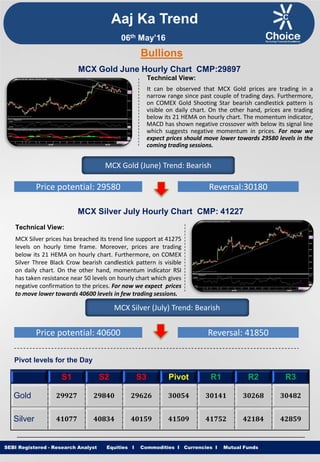
- 1. Equities I Commodities I Currencies I Mutual Funds Aaj Ka Trend Technical View: It can be observed that MCX Gold prices are trading in a narrow range since past couple of trading days. Furthermore, on COMEX Gold Shooting Star bearish candlestick pattern is visible on daily chart. On the other hand, prices are trading below its 21 HEMA on hourly chart. The momentum indicator, MACD has shown negative crossover with below its signal line which suggests negative momentum in prices. For now we expect prices should move lower towards 29580 levels in the coming trading sessions. SEBI Registered - Research Analyst Equities I Commodities I Currencies I Mutual Funds Bullions MCX Gold June Hourly Chart CMP:29897 MCX Gold (June) Trend: Bearish Price potential: 29580 Reversal:30180 MCX Silver July Hourly Chart CMP: 41227 Technical View: MCX Silver prices has breached its trend line support at 41275 levels on hourly time frame. Moreover, prices are trading below its 21 HEMA on hourly chart. Furthermore, on COMEX Silver Three Black Crow bearish candlestick pattern is visible on daily chart. On the other hand, momentum indicator RSI has taken resistance near 50 levels on hourly chart which gives negative confirmation to the prices. For now we expect prices to move lower towards 40600 levels in few trading sessions. MCX Silver (July) Trend: Bearish Price potential: 40600 Reversal: 41850 Pivot levels for the Day S1 S2 S3 Pivot R1 R2 R3 Gold 29927 29840 29626 30054 30141 30268 30482 Silver 41077 40834 40159 41509 41752 42184 42859 06th May’16
- 2. Equities I Commodities I Currencies I Mutual Funds Technical View: MCX Copper Prices are trading in falling channel formation on hourly charts. However, MCX Copper prices is trading below its 50 HEMA on hourly chart which indicates short term trend remains down. Furthermore, in COMEX Copper has witnessed Head & Shoulder Breakdown at $ 2.228 on four chart. On the other hand, momentum indicator RSI has moved below 30 levels on hourly chart which gives negative confirmation to the prices. For now we expect prices to move lower towards 310 levels in coming trading sessions. SEBI Registered - Research Analyst Equities I Commodities I Currencies I Mutual Funds MCX Copper June hourly Chart CMP: 318.90 MCX Copper (June) Trend: Bearish Price potential: 310 Reversal: 324.50 MCX Crude Oil May. Hourly Chart CMP: 2949 Technical View: MCX Crude Oil Prices witnessed upward channel breakdown at 3000 levels on hourly chart. On Weekly chart, the MCX Crude Oil price has completed a “Bearish White Swan Harmonic Pattern” at 3115 levels. On the other hand, momentum indicator RSI has taken resistance near 60 levels on hourly chart which gives negative confirmation to the prices. For now we expect prices to move lower towards 2900 levels in coming trading sessions. MCX Crude Oil (May) Trend: Bearish Price potential: 2900 Reversal: 3040 Pivot levels for the Day S1 S2 S3 Pivot R1 R2 R3 Copper 318.1 315.9 310.0 321.7 323.9 327.6 333.4 Crude 2928 2857 2718 2996 3067 3135 3274 Base Metal Energy Aaj Ka Trend 06th May’16
- 3. Equities I Commodities I Currencies I Mutual FundsSEBI Registered - Research Analyst Equities I Commodities I Currencies I Mutual Funds Other Base Metals & Energy S1 S2 S3 Pivot R1 R2 R3 Trend Copper 318.1 315.9 310.0 321.7 323.9 327.6 333.4 Aluminum 106.8 106.2 104.7 107.7 108.3 109.2 110.7 Lead 114.9 114.1 112.0 116.1 116.9 118.2 120.2 Nickel 595.7 586.9 561.1 612.7 621.5 638.5 664.3 Zinc 123.1 122.0 119.8 124.2 125.3 126.4 128.6 Natural Gas 137.1 134.7 128.2 141.2 143.6 147.7 154.2 Fundamental News: Gold prices gained in Asia on Thursday with investors cautious ahead of the end of the week jobs report that will provide clarity on the prospects for Fed rate hikes going forward. Gold futures were higher in European trade on Thursday, as market players looked ahead to a raft of speeches from Federal Reserve officials later in the day to judge the balance of opinion among policymakers on the prospect of further rate hikes. Gold futures were higher in North American trade on Thursday, extending overnight gains after data showed that the number of people who filed for unemployment assistance in the U.S. last week rose to the highest level in five weeks. Oil prices jumped in European trade on Thursday, as a huge wildfire in Canada disrupted its oil sands production. A huge wildfire near Canada's oil sands region and escalating tensions in Libya stoked concern among investors over a near-term supply shortage, driving crude prices up for the first time in a week on Thursday. Libya may be forced to slash oil production within days if a stand-off between eastern and western factions that has prevented loadings at the Marsa al-Hariga port continues, an official from state oil firm NOC in Tripoli told Reuters on Thursday. Oil prices jumped on Thursday as a huge wildfire in Canada disrupted oil sands production, while escalating fighting in Libya threatened the North African nation's output. U.S. natural gas futures held on to losses in North America trade on Thursday, after data showed that natural gas supplies in storage in the U.S. rose more than feared last week. Aaj Ka Trend 06th May’16
- 4. Equities I Commodities I Currencies I Mutual FundsSEBI Registered - Research Analyst Equities I Commodities I Currencies I Mutual Funds International Market Commodity Closing Price Gold 1278.97 Silver 17.34 Crude Oil 44.10 Brent Crude Oil 44.80 Natural Gas 2.088 COMEX/NYMEX/ICE ( Precious Metals & Energy) Currency & Commodity Index Currency (Spot) Current Price USD / INR 66.55 Dollar Index 93.72 EUR / USD 1.1404 CRB Index* 178.92 Closing as on 05.05.16 *Closing as on 05.05.16 LME (Base Metals) ( $ per tones) Commodity Closing Price Copper 4785 Aluminum 1608 Zinc 1861 Lead 1736 Nickel 9020 SHFE (Base Metals) (Yuan per tones) Commodity Closing Price Copper 36600 Aluminum 12300 Zinc 14795 Lead 12780 Closing as on 05.05.16 Closing as on 05.05.16 LME INVENTORY DATA Aaj Ka Trend 29-Apr-16 02-May-16 03-May-16 04-May-16 05-May-16 Aluminium -6750 0 -6650 -12350 -6275 Copper -1225 0 5175 1825 225 Lead 75 0 -700 -200 550 Nickel 1686 0 66 -1062 -1308 Zinc -2525 0 -2475 -4275 -1125 06th May’16
- 5. Equities I Commodities I Currencies I Mutual Funds This is solely for information of clients of Choice Broking and does not construe to be an investment advice. It is also not intended as an offer or solicitation for the purchase and sale of any financial instruments. Any action taken by you on the basis of the information contained herein is your responsibility alone and Choice Broking its subsidiaries or its employees or associates will not be liable in any manner for the consequences of such action taken by you. We have exercised due diligence in checking the correctness and authenticity of the information contained in this recommendation, but Choice Broking or any of its subsidiaries or associates or employees shall not be in any way responsible for any loss or damage that may arise to any person from any inadvertent error in the information contained in this recommendation or any action taken on basis of this information. Technical analysis studies market psychology, price patterns and volume levels. It is used to forecast future price and market movements. Technical analysis is complementary to fundamental analysis and news sources. The recommendations issued herewith might be contrary to recommendations issued by Choice Broking in the company research undertaken as the recommendations stated in this report is derived purely from technical analysis. Choice Broking has based this document on information obtained from sources it believes to be reliable but which it has not independently verified; Choice Broking makes no guarantee, representation or warranty and accepts no responsibility or liability as to its accuracy or completeness. The opinions contained within the report are based upon publicly available information at the time of publication and are subject to change without notice. The information and any disclosures provided herein are in summary form and have been prepared for informational purposes. The recommendations and suggested price levels are intended purely for trading purposes. The recommendations are valid for the day of the report however trading trends and volumes might vary substantially on an intraday basis and the recommendations may be subject to change. The information and any disclosures provided herein may be considered confidential. Any use, distribution, modification, copying, forwarding or disclosure by any person is strictly prohibited. The information and any disclosures provided herein do not constitute a solicitation or offer to purchase or sell any security or other financial product or instrument. The current performance may be unaudited. Past performance does not guarantee future returns. There can be no assurance that investments will achieve any targeted rates of return, and there is no guarantee against the loss of your entire investment. POTENTIAL CONFLICT OF INTEREST DISCLOSURE (as on date of report) Disclosure of interest statement – • Analyst interest of the stock /Instrument(s): - No. • Firm interest of the stock / Instrument (s): - No. Disclaimer Contact Us Amit Pathania Research Associate amit.pathania@choiceindia.com Rohan Patil Research Associate rohan.patil@choiceindia.com www.choiceindia.comcustomercare@choiceindia.com SEBI Registered - Research Analyst Equities I Commodities I Currencies I Mutual Funds Aaj Ka Trend 06th May’16 Neeraj Yadav Research Advisor neeraj.yadav@choiceindia.com Anish Vyas Senior Research Associate anish.vyas@choiceindia.com Anish Vyas Digitally signed by Anish Vyas DN: cn=Anish Vyas, o=Choice Merchandise Broking Pvt. Ltd, ou=Sr. Research Associate, email=anish.vyas@choiceindia.com, c=IN Date: 2016.05.06 08:44:57 +05'30'