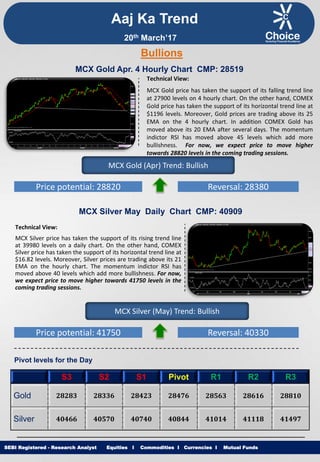
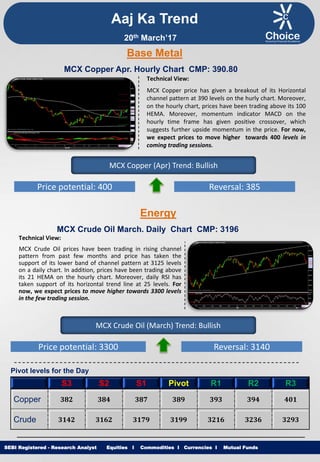
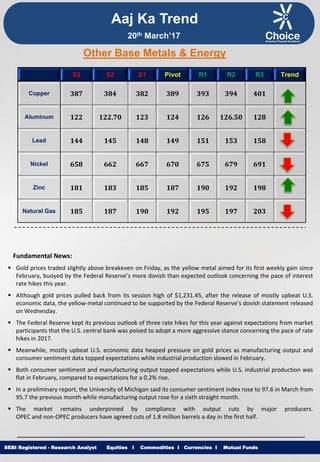
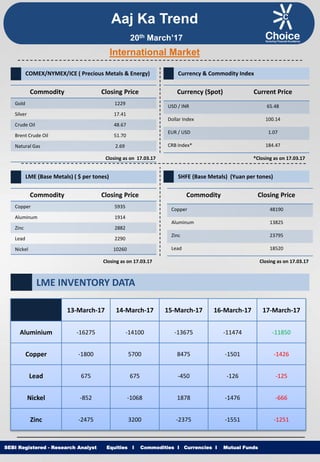
1. Equities I Commodities I Currencies I Mutual Funds
Aaj Ka Trend
Technical View:
MCX Gold price has taken the support of its falling trend line
at 27900 levels on 4 hourly chart. On the other hand, COMEX
Gold price has taken the support of its horizontal trend line at
$1196 levels. Moreover, Gold prices are trading above its 25
EMA on the 4 hourly chart. In addition COMEX Gold has
moved above its 20 EMA after several days. The momentum
indictor RSI has moved above 45 levels which add more
bullishness. For now, we expect price to move higher
towards 28820 levels in the coming trading sessions.
SEBI Registered - Research Analyst Equities I Commodities I Currencies I Mutual Funds
Bullions
MCX Gold Apr. 4 Hourly Chart CMP: 28519
MCX Gold (Apr) Trend: Bullish
Price potential: 28820 Reversal: 28380
MCX Silver May Daily Chart CMP: 40909
Technical View:
MCX Silver price has taken the support of its rising trend line
at 39980 levels on a daily chart. On the other hand, COMEX
Silver price has taken the support of its horizontal trend line at
$16.82 levels. Moreover, Silver prices are trading above its 21
EMA on the hourly chart. The momentum indictor RSI has
moved above 40 levels which add more bullishness. For now,
we expect price to move higher towards 41750 levels in the
coming trading sessions.
MCX Silver (May) Trend: Bullish
Price potential: 41750 Reversal: 40330
Pivot levels for the Day
S3 S2 S1 Pivot R1 R2 R3
Gold 28283 28336 28423 28476 28563 28616 28810
Silver 40466 40570 40740 40844 41014 41118 41497
20th March’17
2. Equities I Commodities I Currencies I Mutual Funds
Technical View:
MCX Copper price has given a breakout of its Horizontal
channel pattern at 390 levels on the hurly chart. Moreover,
on the hourly chart, prices have been trading above its 100
HEMA. Moreover, momentum indicator MACD on the
hourly time frame has given positive crossover, which
suggests further upside momentum in the price. For now,
we expect prices to move higher towards 400 levels in
coming trading sessions.
SEBI Registered - Research Analyst Equities I Commodities I Currencies I Mutual Funds
MCX Copper Apr. Hourly Chart CMP: 390.80
MCX Copper (Apr) Trend: Bullish
Price potential: 400 Reversal: 385
MCX Crude Oil March. Daily Chart CMP: 3196
Technical View:
MCX Crude Oil prices have been trading in rising channel
pattern from past few months and price has taken the
support of its lower band of channel pattern at 3125 levels
on a daily chart. In addition, prices have been trading above
its 21 HEMA on the hourly chart. Moreover, daily RSI has
taken support of its horizontal trend line at 25 levels. For
now, we expect prices to move higher towards 3300 levels
in the few trading session.
MCX Crude Oil (March) Trend: Bullish
Price potential: 3300 Reversal: 3140
Pivot levels for the Day
S3 S2 S1 Pivot R1 R2 R3
Copper 382 384 387 389 393 394 401
Crude 3142 3162 3179 3199 3216 3236 3293
Base Metal
Energy
Aaj Ka Trend
20th March’17
3. Equities I Commodities I Currencies I Mutual FundsSEBI Registered - Research Analyst Equities I Commodities I Currencies I Mutual Funds
Other Base Metals & Energy
S3 S2 S1 Pivot R1 R2 R3 Trend
Copper 387 384 382 389 393 394 401
Aluminum 122 122.70 123 124 126 126.50 128
Lead 144 145 148 149 151 153 158
Nickel 658 662 667 670 675 679 691
Zinc 181 183 185 187 190 192 198
Natural Gas 185 187 190 192 195 197 203
Fundamental News:
Gold prices traded slightly above breakeven on Friday, as the yellow metal aimed for its first weekly gain since
February, buoyed by the Federal Reserve’s more dovish than expected outlook concerning the pace of interest
rate hikes this year.
Although gold prices pulled back from its session high of $1,231.45, after the release of mostly upbeat U.S.
economic data, the yellow-metal continued to be supported by the Federal Reserve’s dovish statement released
on Wednesday.
The Federal Reserve kept its previous outlook of three rate hikes for this year against expectations from market
participants that the U.S. central bank was poised to adopt a more aggressive stance concerning the pace of rate
hikes in 2017.
Meanwhile, mostly upbeat U.S. economic data heaped pressure on gold prices as manufacturing output and
consumer sentiment data topped expectations while industrial production slowed in February.
Both consumer sentiment and manufacturing output topped expectations while U.S. industrial production was
flat in February, compared to expectations for a 0.2% rise.
In a preliminary report, the University of Michigan said its consumer sentiment index rose to 97.6 in March from
95.7 the previous month while manufacturing output rose for a sixth straight month.
The market remains underpinned by compliance with output cuts by major producers.
OPEC and non-OPEC producers have agreed cuts of 1.8 million barrels a day in the first half.
Aaj Ka Trend
20th March’17
4. Equities I Commodities I Currencies I Mutual FundsSEBI Registered - Research Analyst Equities I Commodities I Currencies I Mutual Funds
International Market
Commodity Closing Price
Gold 1229
Silver 17.41
Crude Oil 48.67
Brent Crude Oil 51.70
Natural Gas 2.69
COMEX/NYMEX/ICE ( Precious Metals & Energy) Currency & Commodity Index
Currency (Spot) Current Price
USD / INR 65.48
Dollar Index 100.14
EUR / USD 1.07
CRB Index* 184.47
Closing as on 17.03.17 *Closing as on 17.03.17
LME (Base Metals) ( $ per tones)
Commodity Closing Price
Copper 5935
Aluminum 1914
Zinc 2882
Lead 2290
Nickel 10260
SHFE (Base Metals) (Yuan per tones)
Commodity Closing Price
Copper 48190
Aluminum 13825
Zinc 23795
Lead 18520
Closing as on 17.03.17 Closing as on 17.03.17
LME INVENTORY DATA
Aaj Ka Trend
13-March-17 14-March-17 15-March-17 16-March-17 17-March-17
Aluminium -16275 -14100 -13675 -11474 -11850
Copper -1800 5700 8475 -1501 -1426
Lead 675 675 -450 -126 -125
Nickel -852 -1068 1878 -1476 -666
Zinc -2475 3200 -2375 -1551 -1251
20th March’17
5. Equities I Commodities I Currencies I Mutual Funds
This is solely for information of clients of Choice Broking and does not construe to be an investment advice. It is also not intended as an offer or solicitation
for the purchase and sale of any financial instruments. Any action taken by you on the basis of the information contained herein is your responsibility alone
and Choice Broking its subsidiaries or its employees or associates will not be liable in any manner for the consequences of such action taken by you. We
have exercised due diligence in checking the correctness and authenticity of the information contained in this recommendation, but Choice Broking or any of
its subsidiaries or associates or employees shall not be in any way responsible for any loss or damage that may arise to any person from any inadvertent
error in the information contained in this recommendation or any action taken on basis of this information. Technical analysis studies market psychology,
price patterns and volume levels. It is used to forecast future price and market movements. Technical analysis is complementary to fundamental analysis
and news sources. The recommendations issued herewith might be contrary to recommendations issued by Choice Broking in the company research
undertaken as the recommendations stated in this report is derived purely from technical analysis. Choice Broking has based this document on information
obtained from sources it believes to be reliable but which it has not independently verified; Choice Broking makes no guarantee, representation or warranty
and accepts no responsibility or liability as to its accuracy or completeness. The opinions contained within the report are based upon publicly available
information at the time of publication and are subject to change without notice. The information and any disclosures provided herein are in summary form
and have been prepared for informational purposes. The recommendations and suggested price levels are intended purely for trading purposes. The
recommendations are valid for the day of the report however trading trends and volumes might vary substantially on an intraday basis and the
recommendations may be subject to change. The information and any disclosures provided herein may be considered confidential. Any use, distribution,
modification, copying, forwarding or disclosure by any person is strictly prohibited. The information and any disclosures provided herein do not constitute a
solicitation or offer to purchase or sell any security or other financial product or instrument. The current performance may be unaudited. Past performance
does not guarantee future returns. There can be no assurance that investments will achieve any targeted rates of return, and there is no guarantee against
the loss of your entire investment.
POTENTIAL CONFLICT OF INTEREST DISCLOSURE (as on date of report) Disclosure of interest statement – • Analyst interest of the stock
/Instrument(s): - No. • Firm interest of the stock / Instrument (s): - No.
Disclaimer
Contact Us
Amit Pathania
Research Associate
amit.pathania@choiceindia.com
www.choicebroking.incustomercare@choiceindia.com
SEBI Registered - Research Analyst Equities I Commodities I Currencies I Mutual Funds
Aaj Ka Trend
20th March’17
Neeraj Yadav
Research Advisor
neeraj.yadav@choiceindia.com
Anish Vyas
Senior Research Associate
anish.vyas@choiceindia.com
Amit Pathania
Digitally signed by Amit Pathania
DN: cn=Amit Pathania, o=Choice Equity Broking Pvt. ltd,
ou=Research Department,
email=amit.pathania@choiceindia.com, c=IN
Date: 2017.03.18 12:15:15 +05'30'