
Recommended
More Related Content
What's hot
What's hot (20)
Viewers also liked
Viewers also liked (12)
Similar to MCX Gold, Silver Technical Outlook
Similar to MCX Gold, Silver Technical Outlook (17)
Recently uploaded
Recently uploaded (20)
MCX Gold, Silver Technical Outlook
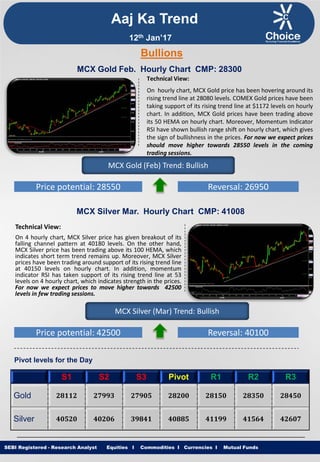
- 1. Equities I Commodities I Currencies I Mutual Funds Aaj Ka Trend Technical View: On hourly chart, MCX Gold price has been hovering around its rising trend line at 28080 levels. COMEX Gold prices have been taking support of its rising trend line at $1172 levels on hourly chart. In addition, MCX Gold prices have been trading above its 50 HEMA on hourly chart. Moreover, Momentum Indicator RSI have shown bullish range shift on hourly chart, which gives the sign of bullishness in the prices. For now we expect prices should move higher towards 28550 levels in the coming trading sessions. SEBI Registered - Research Analyst Equities I Commodities I Currencies I Mutual Funds Bullions MCX Gold Feb. Hourly Chart CMP: 28300 MCX Gold (Feb) Trend: Bullish Price potential: 28550 Reversal: 26950 MCX Silver Mar. Hourly Chart CMP: 41008 Technical View: On 4 hourly chart, MCX Silver price has given breakout of its falling channel pattern at 40180 levels. On the other hand, MCX Silver price has been trading above its 100 HEMA, which indicates short term trend remains up. Moreover, MCX Silver prices have been trading around support of its rising trend line at 40150 levels on hourly chart. In addition, momentum indicator RSI has taken support of its rising trend line at 53 levels on 4 hourly chart, which indicates strength in the prices. For now we expect prices to move higher towards 42500 levels in few trading sessions. MCX Silver (Mar) Trend: Bullish Price potential: 42500 Reversal: 40100 Pivot levels for the Day S1 S2 S3 Pivot R1 R2 R3 Gold 28112 27993 27905 28200 28150 28350 28450 Silver 40520 40206 39841 40885 41199 41564 42607 12th Jan’17
- 2. Equities I Commodities I Currencies I Mutual Funds Technical View: MCX Copper prices have been trading in rising channel pattern and price have been facing resistance of its upper band of channel pattern 397 levels on hourly chart. On hourly chart MCX Copper price has faced resistance of its horizontal trend line at 398 levels. Furthermore, momentum indicator RSI in oversold zone levels on hourly time frame, which suggest further downside momentum can be seen. For now we expect prices to move lower towards 385 levels in coming trading sessions. SEBI Registered - Research Analyst Equities I Commodities I Currencies I Mutual Funds MCX Copper Feb. Hourly Chart CMP: 393.25 MCX Copper (Feb) Trend: Bearish Price potential: 385 Reversal: 400 MCX Crude Oil Jan. Hourly Chart CMP: 3589 Technical View: MCX Crude Oil price has shown breakdown of its rising channel pattern and prices have been retested its breakdown trend line at 3590 levels on hurly chart. MCX Crude Oil prices has given breakdown of its rising trend line at 3610 levels on hourly chart. MCX Crude Oil is trading below its 100 HEMA on hourly chart. Moreover, Momentum indicator MACD has shown negative crossover and moving below its signal line on hourly chart which suggest negative movement in the prices. For now we expect prices to move lower towards 3470 levels in coming trading sessions. MCX Crude Oil (Jan) Trend: Bearish Price potential: 3470 Reversal: 3630 Pivot levels for the Day S1 S2 S3 Pivot R1 R2 R3 Copper 390.9 389.2 386.1 394.0 395.7 398.8 406.8 Crude 3496 3433 3387 3542 3605 3651 3805 Base Metal Energy Aaj Ka Trend 12th Jan’17
- 3. Equities I Commodities I Currencies I Mutual FundsSEBI Registered - Research Analyst Equities I Commodities I Currencies I Mutual Funds Other Base Metals & Energy S1 S2 S3 Pivot R1 R2 R3 Trend Copper 390.9 389.2 386.1 394.0 395.7 398.8 406.8 Aluminum 119.1 118.3 117.8 119.6 120.4 120.9 122.8 Lead 143.4 140.9 136.9 147.4 149.9 153.9 164.5 Nickel 686.1 674.1 655.0 705.2 717.2 736.3 786.6 Zinc 181.7 179.8 177.1 184.4 186.3 189.0 196.2 Natural Gas 220.4 215.5 211.0 224.9 229.8 234.3 248.3 Fundamental News: Gold prices rose to a fresh six-week high on Wednesday, as markets looked ahead to President-elect Donald Trump’s first press conference since his election victory later in the day. Investors will welcome any detail he may give on his promises of tax reform, infrastructure spending and deregulation, as well as insight regarding policies on China and the domestic economy. Trump has been credited with being a major catalyst behind the market's impressive rally since election day, although he has yet to outline his economic policies in detail. The U.S. dollar index, which measures the greenback’s strength against a trade-weighted basket of six major currencies, was steady at 102.10 in early trade, remaining well off last week's 14-year high of 103.82. Dollar weakness usually benefits gold, as it boosts the metal's appeal as an alternative asset and makes dollar- priced commodities cheaper for holders of other currencies. U.S. crude stocks rose more than expected in the latest week, official data showed Wednesday The EIA said crude inventories rose by 4.097 mn barrels after a drop of 7.051 mn barrels the previous week. Crude inventories were forecast to rise by 1.162 mn barrels. Gasoline stocks rose by 5.023 mn barrels after a hike of 8.307 mn the previous week. Gasoline inventories were expected to rise by 1.638 mn barrels. U.S. crude pared gains of over 1% and was up 0.47% at $51.06 after data release. Aaj Ka Trend 12th Jan’17
- 4. Equities I Commodities I Currencies I Mutual FundsSEBI Registered - Research Analyst Equities I Commodities I Currencies I Mutual Funds International Market Commodity Closing Price Gold 1197.24 Silver 16.83 Crude Oil 52.16 Brent Crude Oil 55.07 Natural Gas 3.313 COMEX/NYMEX/ICE ( Precious Metals & Energy) Currency & Commodity Index Currency (Spot) Current Price USD / INR 68.33 Dollar Index 101.53 EUR / USD 1.0604 CRB Index* 192.29 Closing as on 11.01.17 *Closing as on 11.01.17 LME (Base Metals) ( $ per tones) Commodity Closing Price Copper 5714 Aluminum 1758 Zinc 2700 Lead 2134 Nickel 10180 SHFE (Base Metals) (Yuan per tones) Commodity Closing Price Copper 46930 Aluminum 12995 Zinc 22320 Lead 18500 Closing as on 11.01.17 Closing as on 11.01.17 LME INVENTORY DATA Aaj Ka Trend 05-Jan-17 06-Jan-17 09-Jan-17 10-Jan-17 11-Jan-17 Aluminium 25975 5425 -1101 16801 11050 Copper -4100 -6650 -224 -1498 -5174 Lead -25 -175 -402 -402 -76 Nickel -804 -805 1094 -49 -35 Zinc -175 -75 -375 -801 -1274 12th Jan’17
- 5. Equities I Commodities I Currencies I Mutual Funds This is solely for information of clients of Choice Broking and does not construe to be an investment advice. It is also not intended as an offer or solicitation for the purchase and sale of any financial instruments. Any action taken by you on the basis of the information contained herein is your responsibility alone and Choice Broking its subsidiaries or its employees or associates will not be liable in any manner for the consequences of such action taken by you. We have exercised due diligence in checking the correctness and authenticity of the information contained in this recommendation, but Choice Broking or any of its subsidiaries or associates or employees shall not be in any way responsible for any loss or damage that may arise to any person from any inadvertent error in the information contained in this recommendation or any action taken on basis of this information. Technical analysis studies market psychology, price patterns and volume levels. It is used to forecast future price and market movements. Technical analysis is complementary to fundamental analysis and news sources. The recommendations issued herewith might be contrary to recommendations issued by Choice Broking in the company research undertaken as the recommendations stated in this report is derived purely from technical analysis. Choice Broking has based this document on information obtained from sources it believes to be reliable but which it has not independently verified; Choice Broking makes no guarantee, representation or warranty and accepts no responsibility or liability as to its accuracy or completeness. The opinions contained within the report are based upon publicly available information at the time of publication and are subject to change without notice. The information and any disclosures provided herein are in summary form and have been prepared for informational purposes. The recommendations and suggested price levels are intended purely for trading purposes. The recommendations are valid for the day of the report however trading trends and volumes might vary substantially on an intraday basis and the recommendations may be subject to change. The information and any disclosures provided herein may be considered confidential. Any use, distribution, modification, copying, forwarding or disclosure by any person is strictly prohibited. The information and any disclosures provided herein do not constitute a solicitation or offer to purchase or sell any security or other financial product or instrument. The current performance may be unaudited. Past performance does not guarantee future returns. There can be no assurance that investments will achieve any targeted rates of return, and there is no guarantee against the loss of your entire investment. POTENTIAL CONFLICT OF INTEREST DISCLOSURE (as on date of report) Disclosure of interest statement – • Analyst interest of the stock /Instrument(s): - No. • Firm interest of the stock / Instrument (s): - No. Disclaimer Contact Us Amit Pathania Research Associate amit.pathania@choiceindia.com www.choicebroking.incustomercare@choiceindia.com SEBI Registered - Research Analyst Equities I Commodities I Currencies I Mutual Funds Aaj Ka Trend 12th Jan’17 Neeraj Yadav Research Advisor neeraj.yadav@choiceindia.com Anish Vyas Senior Research Associate anish.vyas@choiceindia.com Anish Vyas Digitally signed by Anish Vyas DN: cn=Anish Vyas, o=Choice Merchandise Broking Pvt. Ltd, ou=Sr. Research Associate, email=anish.vyas@choiceindia.com, c=IN Date: 2017.01.12 09:10:13 +05'30'