
Recommended
More Related Content
What's hot
What's hot (20)
Viewers also liked
Viewers also liked (20)
Similar to MCX Gold breaks out, may rise to 30250
Similar to MCX Gold breaks out, may rise to 30250 (20)
Recently uploaded
Recently uploaded (20)
MCX Gold breaks out, may rise to 30250
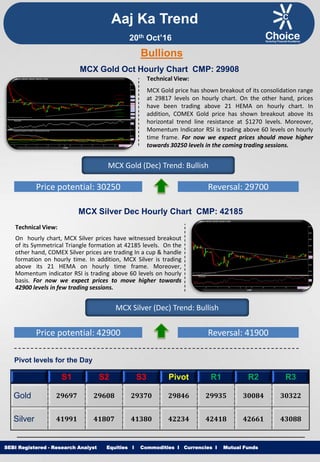
- 1. Equities I Commodities I Currencies I Mutual Funds Aaj Ka Trend Technical View: MCX Gold price has shown breakout of its consolidation range at 29817 levels on hourly chart. On the other hand, prices have been trading above 21 HEMA on hourly chart. In addition, COMEX Gold price has shown breakout above its horizontal trend line resistance at $1270 levels. Moreover, Momentum Indicator RSI is trading above 60 levels on hourly time frame. For now we expect prices should move higher towards 30250 levels in the coming trading sessions. SEBI Registered - Research Analyst Equities I Commodities I Currencies I Mutual Funds Bullions MCX Gold Oct Hourly Chart CMP: 29908 MCX Gold (Dec) Trend: Bullish Price potential: 30250 Reversal: 29700 MCX Silver Dec Hourly Chart CMP: 42185 Technical View: On hourly chart, MCX Silver prices have witnessed breakout of its Symmetrical Triangle formation at 42185 levels. On the other hand, COMEX Silver prices are trading In a cup & handle formation on hourly time. In addition, MCX Silver is trading above its 21 HEMA on hourly time frame. Moreover, Momentum indicator RSI is trading above 60 levels on hourly basis. For now we expect prices to move higher towards 42900 levels in few trading sessions. MCX Silver (Dec) Trend: Bullish Price potential: 42900 Reversal: 41900 Pivot levels for the Day S1 S2 S3 Pivot R1 R2 R3 Gold 29697 29608 29370 29846 29935 30084 30322 Silver 41991 41807 41380 42234 42418 42661 43088 20th Oct’16
- 2. Equities I Commodities I Currencies I Mutual Funds Technical View: On hourly chart MCX Copper has given breakdown of its Rectangle pattern at 312.60 levels. In addition, prices have been trading below its 50 DEMA, which suggest medium term remains weak. Furthermore, Three Black Crow bearish candlestick pattern is visible on daily time frame. Moreover, momentum indicator RSI has been trading below 50 levels on hourly time frame. For now we expect prices to move lower towards 306.50 levels in coming trading sessions. SEBI Registered - Research Analyst Equities I Commodities I Currencies I Mutual Funds MCX Copper Nov hourly Chart CMP: 312.15 MCX Copper (Nov) Trend: Bearish Price potential: 306.50 Reversal: 318 MCX Crude Oil Oct. Hourly Chart CMP: 3450 Technical View: MCX Crude Oil prices have witnessed breakout of its Symmetrical triangle formation at 3386 levels on hourly chart. In addition, Counter is trading above its 21 HEMA on hourly chart. Moreover, Momentum indicator RSI is trading above 60 levels on hourly chart. Furthermore, momentum indicator MACD has shown positive crossover on hourly chart. For now we expect prices to move higher towards 3510 levels in coming trading sessions. MCX Crude Oil (Oct) Trend: Bullish Price potential: 3510 Reversal: 3380 Pivot levels for the Day S1 S2 S3 Pivot R1 R2 R3 Copper 310.6 308.7 305.6 311.8 313.7 314.9 318.0 Crude 3311 3281 3175 3387 3417 3493 3599 Base Metal Energy Aaj Ka Trend 20th Oct’16
- 3. Equities I Commodities I Currencies I Mutual FundsSEBI Registered - Research Analyst Equities I Commodities I Currencies I Mutual Funds Other Base Metals & Energy S1 S2 S3 Pivot R1 R2 R3 Trend Copper 310.6 308.7 305.6 311.8 313.7 314.9 318.0 Aluminum 109.8 108.5 106.3 110.7 112.0 112.9 115.1 Lead 131.8 130.7 128.6 132.8 133.9 134.9 137.0 Nickel 685.5 682.8 674.4 691.2 693.9 699.6 708.0 Zinc 149.3 148.1 146.0 150.3 151.5 152.4 154.6 Natural Gas 224.1 217.6 210.9 224.3 230.8 231.0 237.7 Fundamental News: Gold held gains Asia on Wednesday after solid China data sets on GDP, output and retail sales. Gold prices were steady on Wednesday, after gains in the previous session but fresh gains were held in check amid a rise in equity markets after data indicating that China’s economy has stabilized. Gold prices held onto solid gains on Wednesday as a batch of mixed data on the U.S. housing market kept up pressure on the dollar. Crude prices gained smartly in Asia on Wednesday of solid economic growth data in China and as U.S. industry estimates showed a drop in stockpiles. U.S. refiners are in the midst of their worst year since the shale boom began in 2011. High fuel inventories have punished margins this year, forcing some refiners to voluntarily cut production, delay capital work, lay off workers and slash employee benefits. Oil prices rose by around 1 percent on Wednesday, lifted by a report of a drop in U.S. crude inventories and declining production in China, while an upbeat OPEC statement on its planned output cut also supported the market. Oil prices rose on Wednesday, climbing around 1% boosted by an unexpected U.S. inventory drawdown and hopes for a planned output cut by major producers. Oil prices rallied on Wednesday, after the U.S. Energy Information Administration reported an unexpectedly large U.S. oil inventory drawdown last week. Aaj Ka Trend 20th Oct’16
- 4. Equities I Commodities I Currencies I Mutual FundsSEBI Registered - Research Analyst Equities I Commodities I Currencies I Mutual Funds International Market Commodity Closing Price Gold 1273.05 Silver 17.72 Crude Oil 51.70 Brent Crude Oil 52.59 Natural Gas 3.18 COMEX/NYMEX/ICE ( Precious Metals & Energy) Currency & Commodity Index Currency (Spot) Current Price USD / INR 66.66 Dollar Index 97.88 EUR / USD 1.09 CRB Index* 190.70 Closing as on 19.10.16 *Closing as on 19.10.16 LME (Base Metals) ( $ per tones) Commodity Closing Price Copper 4668 Aluminum 1630 Zinc 2300 Lead 1993 Nickel 10285 SHFE (Base Metals) (Yuan per tones) Commodity Closing Price Copper 37110 Aluminum 12654 Zinc 17790 Lead 15000 Closing as on 19.10.16 Closing as on 19.10.16 LME INVENTORY DATA Aaj Ka Trend 13-Oct-16 14-Oct-16 17-Oct-16 18-Oct-16 19-Oct-16 Aluminium -9952 -10000 -6226 2548 24751 Copper -1658 2925 -3274 2201 2621 Lead -151 0 -151 601 601 Nickel -446 612 1768 -1195 -8 Zinc -526 -375 -248 102 -277 20th Oct’16
- 5. Equities I Commodities I Currencies I Mutual Funds This is solely for information of clients of Choice Broking and does not construe to be an investment advice. It is also not intended as an offer or solicitation for the purchase and sale of any financial instruments. Any action taken by you on the basis of the information contained herein is your responsibility alone and Choice Broking its subsidiaries or its employees or associates will not be liable in any manner for the consequences of such action taken by you. We have exercised due diligence in checking the correctness and authenticity of the information contained in this recommendation, but Choice Broking or any of its subsidiaries or associates or employees shall not be in any way responsible for any loss or damage that may arise to any person from any inadvertent error in the information contained in this recommendation or any action taken on basis of this information. Technical analysis studies market psychology, price patterns and volume levels. It is used to forecast future price and market movements. Technical analysis is complementary to fundamental analysis and news sources. The recommendations issued herewith might be contrary to recommendations issued by Choice Broking in the company research undertaken as the recommendations stated in this report is derived purely from technical analysis. Choice Broking has based this document on information obtained from sources it believes to be reliable but which it has not independently verified; Choice Broking makes no guarantee, representation or warranty and accepts no responsibility or liability as to its accuracy or completeness. The opinions contained within the report are based upon publicly available information at the time of publication and are subject to change without notice. The information and any disclosures provided herein are in summary form and have been prepared for informational purposes. The recommendations and suggested price levels are intended purely for trading purposes. The recommendations are valid for the day of the report however trading trends and volumes might vary substantially on an intraday basis and the recommendations may be subject to change. The information and any disclosures provided herein may be considered confidential. Any use, distribution, modification, copying, forwarding or disclosure by any person is strictly prohibited. The information and any disclosures provided herein do not constitute a solicitation or offer to purchase or sell any security or other financial product or instrument. The current performance may be unaudited. Past performance does not guarantee future returns. There can be no assurance that investments will achieve any targeted rates of return, and there is no guarantee against the loss of your entire investment. POTENTIAL CONFLICT OF INTEREST DISCLOSURE (as on date of report) Disclosure of interest statement – • Analyst interest of the stock /Instrument(s): - No. • Firm interest of the stock / Instrument (s): - No. Disclaimer Contact Us Amit Pathania Research Associate amit.pathania@choiceindia.com Rohan Patil Research Associate rohan.patil@choiceindia.com www.choicebroking.incustomercare@choiceindia.com SEBI Registered - Research Analyst Equities I Commodities I Currencies I Mutual Funds Aaj Ka Trend 20th Oct’16 Neeraj Yadav Research Advisor neeraj.yadav@choiceindia.com Anish Vyas Senior Research Associate anish.vyas@choiceindia.com Amit Pathania Digitally signed by Amit Pathania DN: cn=Amit Pathania, o=Choice Equity Broking Pvt. ltd, ou=Research Department, email=amit.pathania@choiceindia.com, c=IN Date: 2016.10.20 08:42:11 +05'30'