
Recommended
More Related Content
What's hot
What's hot (20)
Viewers also liked
Viewers also liked (20)
Similar to Aaj ka trend 11.11.16
Similar to Aaj ka trend 11.11.16 (20)
Recently uploaded
Recently uploaded (20)
Aaj ka trend 11.11.16
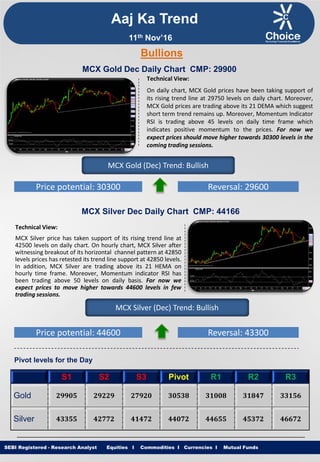
- 1. Equities I Commodities I Currencies I Mutual Funds Aaj Ka Trend Technical View: On daily chart, MCX Gold prices have been taking support of its rising trend line at 29750 levels on daily chart. Moreover, MCX Gold prices are trading above its 21 DEMA which suggest short term trend remains up. Moreover, Momentum Indicator RSI is trading above 45 levels on daily time frame which indicates positive momentum to the prices. For now we expect prices should move higher towards 30300 levels in the coming trading sessions. SEBI Registered - Research Analyst Equities I Commodities I Currencies I Mutual Funds Bullions MCX Gold Dec Daily Chart CMP: 29900 MCX Gold (Dec) Trend: Bullish Price potential: 30300 Reversal: 29600 MCX Silver Dec Daily Chart CMP: 44166 Technical View: MCX Silver price has taken support of its rising trend line at 42500 levels on daily chart. On hourly chart, MCX Silver after witnessing breakout of its horizontal channel pattern at 42850 levels prices has retested its trend line support at 42850 levels. In addition, MCX Silver are trading above its 21 HEMA on hourly time frame. Moreover, Momentum indicator RSI has been trading above 50 levels on daily basis. For now we expect prices to move higher towards 44600 levels in few trading sessions. MCX Silver (Dec) Trend: Bullish Price potential: 44600 Reversal: 43300 Pivot levels for the Day S1 S2 S3 Pivot R1 R2 R3 Gold 29905 29229 27920 30538 31008 31847 33156 Silver 43355 42772 41472 44072 44655 45372 46672 11th Nov’16
- 2. Equities I Commodities I Currencies I Mutual Funds Technical View: As expected MCX Copper price has achieved our short term target of 366.70 levels. On daily chart, MCX Copper price has given breakout of its ascending triangle pattern at 337.10 levels on daily chart. Moreover, prices have breached its horizontal trend line resistance on daily chart. Furthermore, MCX Copper is trading above its 200 DEMA on daily time frame. Moreover, momentum indicator MACD has shown positive crossover on daily chart which is bullish sign. For now we expect prices to move higher towards 385 levels in coming trading sessions. SEBI Registered - Research Analyst Equities I Commodities I Currencies I Mutual Funds MCX Copper Nov Daily Chart CMP: 376.65 MCX Copper (Nov) Trend: Bullish Price potential: 385 Reversal: 369 MCX Crude Oil Nov. Daily Chart CMP: 3011 Technical View: MCX Crude oil price has shown breakdown of its rising wedge pattern at 3080 levels on daily chart. MCX Crude Oil is trading in a Lower Low pattern on hourly chart. In addition, Counter has witnessed breakdown of its Rising Channel pattern in NYMEX at $44.35 levels on daily chart. Moreover, Momentum indicator MACD is trading below its signal line on daily chart which suggest the negative movement in the prices. For now we expect prices to move lower 2910 towards levels in coming trading sessions. MCX Crude Oil (Nov) Trend: Bearish Price potential: 2910 Reversal: 3070 Pivot levels for the Day S1 S2 S3 Pivot R1 R2 R3 Copper 348.0 336.8 319.1 354.5 365.7 372.2 389.9 Crude 2937 2851 2721 2981 3067 3111 3241 Base Metal Energy Aaj Ka Trend 11th Nov’16
- 3. Equities I Commodities I Currencies I Mutual FundsSEBI Registered - Research Analyst Equities I Commodities I Currencies I Mutual Funds Other Base Metals & Energy S1 S2 S3 Pivot R1 R2 R3 Trend Copper 348.0 336.8 319.1 354.5 365.7 372.2 389.9 Aluminum 113.9 112.0 108.5 115.4 117.4 118.9 122.3 Lead 139.6 136.7 132.1 141.3 144.2 145.9 150.5 Nickel 741.7 719.0 680.3 757.7 780.4 796.4 835.1 Zinc 162.3 160.0 155.7 164.4 166.7 168.7 173.1 Natural Gas 171.9 167.5 159.8 175.2 179.6 182.9 190.6 Fundamental News: Gold prices rose sharply during Europe's session on Thursday, as the U.S. dollar pulled back from a two-week high touched in wake of Donald Trump’s election victory. The metal is regarded as a leading indicator of the global economy. It is used in the construction of buildings, power generation and transmission and the manufacture of consumer electronics. U.S. natural gas futures fell sharply on Thursday morning, after data showed that natural gas supplies in storage in the U.S. rose slightly more than forecast last week. That compared with a gain of 54 billion cubic feet in the preceding week, 54 billion a year earlier and a five-year average build of 38 billion cubic feet. Natural gas futures are down almost 16% over the past two weeks as a mild start to the winter heating season added to concerns over a deepening supply glut. Oil prices turned lower on Thursday after the International Energy Agency warned that the market risks running another surplus in 2017 without an output cut from OPEC. Prices were also held in check after data showing a 2.4-million-barrel increase in U.S. crude inventories last week, adding to concerns about oversupply. In its montly report, the IEA said OPEC crude output hit record high of 33.83 million barrels a day in October and warned that 2017 could be another year of relentless global supply growth. Aaj Ka Trend 11th Nov’16
- 4. Equities I Commodities I Currencies I Mutual FundsSEBI Registered - Research Analyst Equities I Commodities I Currencies I Mutual Funds International Market Commodity Closing Price Gold 1257.40 Silver 18.49 Crude Oil 44.40 Brent Crude Oil 45.63 Natural Gas 2.644 COMEX/NYMEX/ICE ( Precious Metals & Energy) Currency & Commodity Index Currency (Spot) Current Price USD / INR 66.62 Dollar Index 98.67 EUR / USD 1.0899 CRB Index* 183.33 Closing as on 10.11.16 *Closing as on 10.11.16 LME (Base Metals) ( $ per tones) Commodity Closing Price Copper 5601 Aluminum 1770 Zinc 2525 Lead 2154 Nickel 11540 SHFE (Base Metals) (Yuan per tones) Commodity Closing Price Copper 44880 Aluminum 14085 Zinc 20625 Lead 17225 Closing as on 10.11.16 Closing as on 10.11.16 LME INVENTORY DATA Aaj Ka Trend 03-Nov-16 04-Nov-16 07-Nov-16 08-Nov-16 10-Nov-16 Aluminium -4400 -1876 -5276 -5076 -4125 Copper -8400 -5602 -6602 -6774 -9025 Lead -125 -224 -226 -74 -325 Nickel 174 611 -545 -194 192 Zinc -200 -1026 -299 -476 -775 11th Nov’16
- 5. Equities I Commodities I Currencies I Mutual Funds This is solely for information of clients of Choice Broking and does not construe to be an investment advice. It is also not intended as an offer or solicitation for the purchase and sale of any financial instruments. Any action taken by you on the basis of the information contained herein is your responsibility alone and Choice Broking its subsidiaries or its employees or associates will not be liable in any manner for the consequences of such action taken by you. We have exercised due diligence in checking the correctness and authenticity of the information contained in this recommendation, but Choice Broking or any of its subsidiaries or associates or employees shall not be in any way responsible for any loss or damage that may arise to any person from any inadvertent error in the information contained in this recommendation or any action taken on basis of this information. Technical analysis studies market psychology, price patterns and volume levels. It is used to forecast future price and market movements. Technical analysis is complementary to fundamental analysis and news sources. The recommendations issued herewith might be contrary to recommendations issued by Choice Broking in the company research undertaken as the recommendations stated in this report is derived purely from technical analysis. Choice Broking has based this document on information obtained from sources it believes to be reliable but which it has not independently verified; Choice Broking makes no guarantee, representation or warranty and accepts no responsibility or liability as to its accuracy or completeness. The opinions contained within the report are based upon publicly available information at the time of publication and are subject to change without notice. The information and any disclosures provided herein are in summary form and have been prepared for informational purposes. The recommendations and suggested price levels are intended purely for trading purposes. The recommendations are valid for the day of the report however trading trends and volumes might vary substantially on an intraday basis and the recommendations may be subject to change. The information and any disclosures provided herein may be considered confidential. Any use, distribution, modification, copying, forwarding or disclosure by any person is strictly prohibited. The information and any disclosures provided herein do not constitute a solicitation or offer to purchase or sell any security or other financial product or instrument. The current performance may be unaudited. Past performance does not guarantee future returns. There can be no assurance that investments will achieve any targeted rates of return, and there is no guarantee against the loss of your entire investment. POTENTIAL CONFLICT OF INTEREST DISCLOSURE (as on date of report) Disclosure of interest statement – • Analyst interest of the stock /Instrument(s): - No. • Firm interest of the stock / Instrument (s): - No. Disclaimer Contact Us Amit Pathania Research Associate amit.pathania@choiceindia.com Rohan Patil Research Associate rohan.patil@choiceindia.com www.choicebroking.incustomercare@choiceindia.com SEBI Registered - Research Analyst Equities I Commodities I Currencies I Mutual Funds Aaj Ka Trend 11th Nov’16 Neeraj Yadav Research Advisor neeraj.yadav@choiceindia.com Anish Vyas Senior Research Associate anish.vyas@choiceindia.com Anish Vyas Digitally signed by Anish Vyas DN: cn=Anish Vyas, o=Choice Merchandise Broking Pvt. Ltd, ou=Sr. Research Associate, email=anish.vyas@choiceindia.com, c=IN Date: 2016.11.11 09:11:08 +05'30'