
Recommended
More Related Content
What's hot
What's hot (20)
Viewers also liked
Viewers also liked (17)
Similar to Aaj ka trend 23.12.16
Similar to Aaj ka trend 23.12.16 (20)
Recently uploaded
Recently uploaded (20)
Aaj ka trend 23.12.16
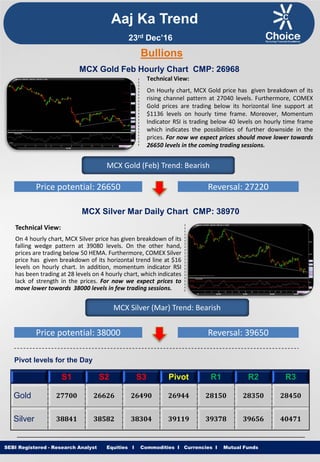
- 1. Equities I Commodities I Currencies I Mutual Funds Aaj Ka Trend Technical View: On Hourly chart, MCX Gold price has given breakdown of its rising channel pattern at 27040 levels. Furthermore, COMEX Gold prices are trading below its horizontal line support at $1136 levels on hourly time frame. Moreover, Momentum Indicator RSI is trading below 40 levels on hourly time frame which indicates the possibilities of further downside in the prices. For now we expect prices should move lower towards 26650 levels in the coming trading sessions. SEBI Registered - Research Analyst Equities I Commodities I Currencies I Mutual Funds Bullions MCX Gold Feb Hourly Chart CMP: 26968 MCX Gold (Feb) Trend: Bearish Price potential: 26650 Reversal: 27220 MCX Silver Mar Daily Chart CMP: 38970 Technical View: On 4 hourly chart, MCX Silver price has given breakdown of its falling wedge pattern at 39080 levels. On the other hand, prices are trading below 50 HEMA. Furthermore, COMEX Silver price has given breakdown of its horizontal trend line at $16 levels on hourly chart. In addition, momentum indicator RSI has been trading at 28 levels on 4 hourly chart, which indicates lack of strength in the prices. For now we expect prices to move lower towards 38000 levels in few trading sessions. MCX Silver (Mar) Trend: Bearish Price potential: 38000 Reversal: 39650 Pivot levels for the Day S1 S2 S3 Pivot R1 R2 R3 Gold 27700 26626 26490 26944 28150 28350 28450 Silver 38841 38582 38304 39119 39378 39656 40471 23rd Dec’16
- 2. Equities I Commodities I Currencies I Mutual Funds Technical View: MCX Copper price has shown breakdown of its descending triangle pattern at 383 levels on daily chart. Moreover, COMEX Copper price has witnessed breakdown of its ascending triangle pattern $2.62 levels on hourly chart. In addition MCX Copper prices are trading below its 21 DEMA. Furthermore, momentum indicator MACD has shown negative crossover on daily time frame, which suggest further weakness in the momentum can be seen. For now we expect prices to move lower towards 368 levels in coming trading sessions. SEBI Registered - Research Analyst Equities I Commodities I Currencies I Mutual Funds MCX Copper Feb daily Chart CMP: 376.55 MCX Copper (Feb) Trend: Bearish Price potential: 368 Reversal: 382 MCX Crude Oil Jan. Hourly Chart CMP: 3607 Technical View: MCX Crude Oil prices has been trading in rising wedge pattern and taking support of its lower band of wedge pattern at 3550 levels on hourly chart. MCX Crude Oil is trading above its 50 HEMA on hourly chart. Moreover, Momentum indicator RSI is trading above 50 levels on hourly chart which suggest the positive movement in the prices. For now we expect prices to move higher towards 3700 levels in coming trading sessions. MCX Crude Oil (Jan) Trend: Bullish Price potential: 3700 Reversal: 3540 Pivot levels for the Day S1 S2 S3 Pivot R1 R2 R3 Copper 371.3 367.2 364.3 374.2 378.3 381.2 391.2 Crude 3564 3522 3493 3593 3635 3664 3765 Base Metal Energy Aaj Ka Trend 23rd Dec’16
- 3. Equities I Commodities I Currencies I Mutual FundsSEBI Registered - Research Analyst Equities I Commodities I Currencies I Mutual Funds Other Base Metals & Energy S1 S2 S3 Pivot R1 R2 R3 Trend Copper 371.3 367.2 364.3 374.2 378.3 381.2 391.2 Aluminum 117.0 116.5 115.9 117.6 118.1 118.7 120.4 Lead 143.7 140.6 139.7 144.6 147.7 148.6 153.5 Nickel 718.4 704.1 697.0 725.5 739.8 746.9 775.3 Zinc 173.3 170.1 167.9 175.5 178.8 181.0 188.6 Natural Gas 235.4 232.8 226.8 241.4 244.0 250.0 264.5 Fundamental News: Gold prices were little changed near last week's 11-month lows on Thursday, with liquidity fading in the run-up to the Christmas weekend. The final revision to third-quarter GDP is released at 8:30AM ET (13:30GMT), along with weekly jobless claims and durable goods orders for November. Personal income and spending and PCE prices are released at 10:00AM ET (15:00GMT). Both data sets could sway market expectations around the pace of interest rate increases by the Federal Reserve in 2017. The dollar lost some steam on Thursday, slipping from its 14-year-high against a basket of currencies as investors took profits ahead of the end of the year. Market analysts warned that the outlook for gold remains cloudy in the near-term, given expectations for higher U.S. interest rates in the months ahead. The precious metal is sensitive to moves in U.S. rates, which lift the opportunity cost of holding non-yielding assets such as bullion, while boosting the dollar in which it is priced. he U.S. economy grew more than initially estimated in the third quarter, official revised data showed on Thursday, underlining the view that the U.S. economy is strong enough to warrant further interest rate hikes in 2017. The Commerce Department said gross domestic product grew at a seasonally adjusted annual rate of 3.5% in the three months ended September 30, up from a previous estimate of 3.2% and above expectations for a reading of 3.3%. Aaj Ka Trend 23rd Dec’16
- 4. Equities I Commodities I Currencies I Mutual FundsSEBI Registered - Research Analyst Equities I Commodities I Currencies I Mutual Funds International Market Commodity Closing Price Gold 1131.58 Silver 15.82 Crude Oil 52.64 Brent Crude Oil 54.75 Natural Gas 3.556 COMEX/NYMEX/ICE ( Precious Metals & Energy) Currency & Commodity Index Currency (Spot) Current Price USD / INR 67.99 Dollar Index 103.05 EUR / USD 1.0444 CRB Index* 190.30 Closing as on 22.12.16 *Closing as on 22.12.16 LME (Base Metals) ( $ per tones) Commodity Closing Price Copper 5518 Aluminum 1722 Zinc 2630 Lead 2124 Nickel 10730 SHFE (Base Metals) (Yuan per tones) Commodity Closing Price Copper 44860 Aluminum 12715 Zinc 21225 Lead 18465 Closing as on 22.12.16 Closing as on 22.12.16 LME INVENTORY DATA Aaj Ka Trend 16-Dec-16 19-Dec-16 20-Dec-16 21-Dec-16 22-Dec-16 Aluminium -28074 -5224 -2826 25101 5025 Copper 11776 38399 -1451 -4400 -3825 Lead -49 -549 215 25 11700 Nickel -121 115 -2300 95 95 Zinc -1826 -1301 -574 -25 -175 23rd Dec’16
- 5. Equities I Commodities I Currencies I Mutual Funds This is solely for information of clients of Choice Broking and does not construe to be an investment advice. It is also not intended as an offer or solicitation for the purchase and sale of any financial instruments. Any action taken by you on the basis of the information contained herein is your responsibility alone and Choice Broking its subsidiaries or its employees or associates will not be liable in any manner for the consequences of such action taken by you. We have exercised due diligence in checking the correctness and authenticity of the information contained in this recommendation, but Choice Broking or any of its subsidiaries or associates or employees shall not be in any way responsible for any loss or damage that may arise to any person from any inadvertent error in the information contained in this recommendation or any action taken on basis of this information. Technical analysis studies market psychology, price patterns and volume levels. It is used to forecast future price and market movements. Technical analysis is complementary to fundamental analysis and news sources. The recommendations issued herewith might be contrary to recommendations issued by Choice Broking in the company research undertaken as the recommendations stated in this report is derived purely from technical analysis. Choice Broking has based this document on information obtained from sources it believes to be reliable but which it has not independently verified; Choice Broking makes no guarantee, representation or warranty and accepts no responsibility or liability as to its accuracy or completeness. The opinions contained within the report are based upon publicly available information at the time of publication and are subject to change without notice. The information and any disclosures provided herein are in summary form and have been prepared for informational purposes. The recommendations and suggested price levels are intended purely for trading purposes. The recommendations are valid for the day of the report however trading trends and volumes might vary substantially on an intraday basis and the recommendations may be subject to change. The information and any disclosures provided herein may be considered confidential. Any use, distribution, modification, copying, forwarding or disclosure by any person is strictly prohibited. The information and any disclosures provided herein do not constitute a solicitation or offer to purchase or sell any security or other financial product or instrument. The current performance may be unaudited. Past performance does not guarantee future returns. There can be no assurance that investments will achieve any targeted rates of return, and there is no guarantee against the loss of your entire investment. POTENTIAL CONFLICT OF INTEREST DISCLOSURE (as on date of report) Disclosure of interest statement – • Analyst interest of the stock /Instrument(s): - No. • Firm interest of the stock / Instrument (s): - No. Disclaimer Contact Us Amit Pathania Research Associate amit.pathania@choiceindia.com www.choicebroking.incustomercare@choiceindia.com SEBI Registered - Research Analyst Equities I Commodities I Currencies I Mutual Funds Aaj Ka Trend 23rd Dec’16 Neeraj Yadav Research Advisor neeraj.yadav@choiceindia.com Anish Vyas Senior Research Associate anish.vyas@choiceindia.com Anish Vyas Digitally signed by Anish Vyas DN: cn=Anish Vyas, o=Choice Merchandise Broking Pvt. Ltd, ou=Sr. Research Associate, email=anish.vyas@choiceindia.com, c=IN Date: 2016.12.23 09:23:31 +05'30'