
Recommended
More Related Content
What's hot
What's hot (20)
Similar to Aaj ka trend 29.06.16
Similar to Aaj ka trend 29.06.16 (20)
Recently uploaded
Recently uploaded (20)
Aaj ka trend 29.06.16
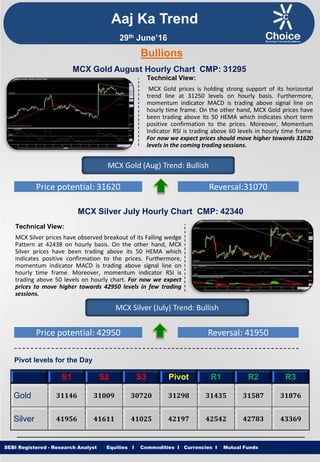
- 1. Equities I Commodities I Currencies I Mutual Funds Aaj Ka Trend Technical View: MCX Gold prices is holding strong support of its horizontal trend line at 31250 levels on hourly basis. Furthermore, momentum indicator MACD is trading above signal line on hourly time frame. On the other hand, MCX Gold prices have been trading above its 50 HEMA which indicates short term positive confirmation to the prices. Moreover, Momentum Indicator RSI is trading above 60 levels in hourly time frame. For now we expect prices should move higher towards 31620 levels in the coming trading sessions. SEBI Registered - Research Analyst Equities I Commodities I Currencies I Mutual Funds Bullions MCX Gold August Hourly Chart CMP: 31295 MCX Gold (Aug) Trend: Bullish Price potential: 31620 Reversal:31070 MCX Silver July Hourly Chart CMP: 42340 Technical View: MCX Silver prices have observed breakout of its Falling wedge Pattern at 42438 on hourly basis. On the other hand, MCX Silver prices have been trading above its 50 HEMA which indicates positive confirmation to the prices. Furthermore, momentum indicator MACD is trading above signal line on hourly time frame. Moreover, momentum indicator RSI is trading above 50 levels on hourly chart. For now we expect prices to move higher towards 42950 levels in few trading sessions. MCX Silver (July) Trend: Bullish Price potential: 42950 Reversal: 41950 Pivot levels for the Day S1 S2 S3 Pivot R1 R2 R3 Gold 31146 31009 30720 31298 31435 31587 31876 Silver 41956 41611 41025 42197 42542 42783 43369 29th June’16
- 2. Equities I Commodities I Currencies I Mutual Funds Technical View: MCX Copper has witnessed breakout of its pennant pattern at 322.50 levels. Furthermore, prices have been trading above its 21 HEMA on hourly chart. Moreover, Counter is trading above its Super Trend indicator on hourly time frame. On the other hand, momentum indicator RSI is trading above 60 levels on hourly chart. For now we expect prices to move higher towards 333 levels in coming trading sessions. SEBI Registered - Research Analyst Equities I Commodities I Currencies I Mutual Funds MCX Copper June hourly Chart CMP: 325.80 MCX Copper (June) Trend: Bullish Price potential: 333 Reversal: 320 MCX Crude Oil July. Hourly Chart CMP: 3236 Technical View: MCX Crude Oil has taken support near its horizontal trend line support on hourly basis. On the other hand prices have been trading above its 21 HEMA on MCX Crude Oil hourly chart. Furthermore, counter is trading in Higher High Higher Low formation on daily chart. Moreover, Momentum indicator RSI is trading above 50 levels on hourly chart. For now we expect prices to move higher towards 3300 levels in coming trading sessions. MCX Crude Oil (July) Trend: Bullish Price potential: 3300 Reversal: 3165 Pivot levels for the Day S1 S2 S3 Pivot R1 R2 R3 Copper 320.7 316.9 310.1 323.7 327.5 330.5 337.3 Crude 3142 3089 2979 3199 3252 3309 3419 Base Metal Energy Aaj Ka Trend 29th June’16
- 3. Equities I Commodities I Currencies I Mutual FundsSEBI Registered - Research Analyst Equities I Commodities I Currencies I Mutual Funds Other Base Metals & Energy S1 S2 S3 Pivot R1 R2 R3 Trend Copper 320.7 316.9 310.1 323.7 327.5 330.5 337.3 Aluminum 108.6 107.7 106.3 109.1 110.0 110.5 111.9 Lead 116.2 114.9 112.9 116.9 118.2 118.9 120.9 Nickel 615.4 605.9 589.7 622.1 631.6 638.3 654.5 Zinc 137.3 134.9 131.0 138.7 141.1 142.6 146.4 Natural Gas 188.2 183.1 174.6 191.6 196.7 200.1 208.6 Fundamental News: Gold gained in Asia on Tuesday with investors eyeing a political process in the United Kingdom that could take months to play out before a firm plan for exiting the European Union is put forth. Gold prices declined in European trade on Tuesday, falling for the first time in three sessions as investors locked in gains after futures climbed to the highest level since July 2014 in wake of last week’s Brexit shock. Gold prices fell in North American trade on Tuesday, declining for the first time in three sessions as investor sentiment began to improve in wake of last week’s shock vote by the U.K. to leave the European Union. Crude oil prices held gains in Asia on Tuesday with industry data on U.S. stockpiles due later in the day and markets watching an expected long-drawn political process in the U.K. before any Brexit timetable becomes clear. Oil prices rose on Tuesday as a looming strike in Norway threatened to cut output in western Europe's biggest producer, although Britain's vote to leave the European Union was still weighing on markets. Oil prices rallied in European trade on Tuesday, climbing for the first three in time sessions as market sentiment began to improve in wake of last week’s shock vote by the U.K. to leave the European Union. Oil on Tuesday rallied strongly from six-week lows overnight as the dollar weakened and a strike loomed in Norway. U.S. natural gas futures surged to a ten-month high on Tuesday, as forecasts for continued above-normal temperatures across most parts of the U.S. throughout most of summer raised expectations for power generation demand to meet air conditioning needs. Aaj Ka Trend 29th June’16
- 4. Equities I Commodities I Currencies I Mutual FundsSEBI Registered - Research Analyst Equities I Commodities I Currencies I Mutual Funds International Market Commodity Closing Price Gold 1315.69 Silver 17.81 Crude Oil 48.11 Brent Crude Oil 48.73 Natural Gas 2.87 COMEX/NYMEX/ICE ( Precious Metals & Energy) Currency & Commodity Index Currency (Spot) Current Price USD / INR 67.95 Dollar Index 96.19 EUR / USD 1.1075 CRB Index* 191.54 Closing as on 28.06.16 *Closing as on 28.06.16 LME (Base Metals) ( $ per tones) Commodity Closing Price Copper 4818 Aluminum 1624 Zinc 2075 Lead 1716 Nickel 9154 SHFE (Base Metals) (Yuan per tones) Commodity Closing Price Copper 37040 Aluminum 12360 Zinc 15750 Lead 12745 Closing as on 28.06.16 Closing as on 28.06.16 LME INVENTORY DATA Aaj Ka Trend 22-June-16 23-June-16 24-June-16 27-June-16 28-June-16 Aluminium -6600 -6650 -5625 -6900 -8675 Copper -1475 3675 -2000 -675 1250 Lead 175 -25 -25 -25 -275 Nickel -498 -2064 -13985 -312 -708 Zinc -1025 18600 -1525 17625 -1200 29th June’16
- 5. Equities I Commodities I Currencies I Mutual Funds This is solely for information of clients of Choice Broking and does not construe to be an investment advice. It is also not intended as an offer or solicitation for the purchase and sale of any financial instruments. Any action taken by you on the basis of the information contained herein is your responsibility alone and Choice Broking its subsidiaries or its employees or associates will not be liable in any manner for the consequences of such action taken by you. We have exercised due diligence in checking the correctness and authenticity of the information contained in this recommendation, but Choice Broking or any of its subsidiaries or associates or employees shall not be in any way responsible for any loss or damage that may arise to any person from any inadvertent error in the information contained in this recommendation or any action taken on basis of this information. Technical analysis studies market psychology, price patterns and volume levels. It is used to forecast future price and market movements. Technical analysis is complementary to fundamental analysis and news sources. The recommendations issued herewith might be contrary to recommendations issued by Choice Broking in the company research undertaken as the recommendations stated in this report is derived purely from technical analysis. Choice Broking has based this document on information obtained from sources it believes to be reliable but which it has not independently verified; Choice Broking makes no guarantee, representation or warranty and accepts no responsibility or liability as to its accuracy or completeness. The opinions contained within the report are based upon publicly available information at the time of publication and are subject to change without notice. The information and any disclosures provided herein are in summary form and have been prepared for informational purposes. The recommendations and suggested price levels are intended purely for trading purposes. The recommendations are valid for the day of the report however trading trends and volumes might vary substantially on an intraday basis and the recommendations may be subject to change. The information and any disclosures provided herein may be considered confidential. Any use, distribution, modification, copying, forwarding or disclosure by any person is strictly prohibited. The information and any disclosures provided herein do not constitute a solicitation or offer to purchase or sell any security or other financial product or instrument. The current performance may be unaudited. Past performance does not guarantee future returns. There can be no assurance that investments will achieve any targeted rates of return, and there is no guarantee against the loss of your entire investment. POTENTIAL CONFLICT OF INTEREST DISCLOSURE (as on date of report) Disclosure of interest statement – • Analyst interest of the stock /Instrument(s): - No. • Firm interest of the stock / Instrument (s): - No. Disclaimer Contact Us Amit Pathania Research Associate amit.pathania@choiceindia.com Rohan Patil Research Associate rohan.patil@choiceindia.com www.choiceindia.comcustomercare@choiceindia.com SEBI Registered - Research Analyst Equities I Commodities I Currencies I Mutual Funds Aaj Ka Trend 29th June’16 Neeraj Yadav Research Advisor neeraj.yadav@choiceindia.com Anish Vyas Senior Research Associate anish.vyas@choiceindia.com Amit Pathania Digitally signed by Amit Pathania DN: cn=Amit Pathania, o=Choice Equity Broking Pvt. ltd, ou=Research Department, email=amit.pathania@choiceindia.com, c=IN Date: 2016.06.29 08:53:14 +05'30'