
Recommended
More Related Content
What's hot
What's hot (20)
Viewers also liked
Viewers also liked (20)
Similar to Aaj ka trend 20.02.17
Similar to Aaj ka trend 20.02.17 (20)
Recently uploaded
Recently uploaded (20)
Aaj ka trend 20.02.17
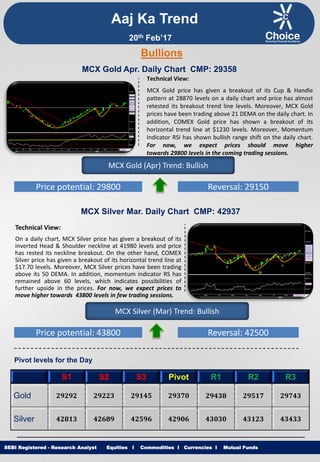
- 1. Equities I Commodities I Currencies I Mutual Funds Aaj Ka Trend Technical View: MCX Gold price has given a breakout of its Cup & Handle pattern at 28870 levels on a daily chart and price has almost retested its breakout trend line levels. Moreover, MCX Gold prices have been trading above 21 DEMA on the daily chart. In addition, COMEX Gold price has shown a breakout of its horizontal trend line at $1230 levels. Moreover, Momentum Indicator RSI has shown bullish range shift on the daily chart. For now, we expect prices should move higher towards 29800 levels in the coming trading sessions. SEBI Registered - Research Analyst Equities I Commodities I Currencies I Mutual Funds Bullions MCX Gold Apr. Daily Chart CMP: 29358 MCX Gold (Apr) Trend: Bullish Price potential: 29800 Reversal: 29150 MCX Silver Mar. Daily Chart CMP: 42937 Technical View: On a daily chart, MCX Silver price has given a breakout of its inverted Head & Shoulder neckline at 41980 levels and price has rested its neckline breakout. On the other hand, COMEX Silver price has given a breakout of its horizontal trend line at $17.70 levels. Moreover, MCX Silver prices have been trading above its 50 DEMA. In addition, momentum indicator RS has remained above 60 levels, which indicates possibilities of further upside in the prices. For now, we expect prices to move higher towards 43800 levels in few trading sessions. MCX Silver (Mar) Trend: Bullish Price potential: 43800 Reversal: 42500 Pivot levels for the Day S1 S2 S3 Pivot R1 R2 R3 Gold 29292 29223 29145 29370 29438 29517 29743 Silver 42813 42689 42596 42906 43030 43123 43433 20th Feb’17
- 2. Equities I Commodities I Currencies I Mutual Funds Technical View: MCX Copper prices have been trading in rising channel pattern from past few months and price has faced the resistance of its upper band of channel pattern at 414.40 levels. On the daily chart, MCX Copper prices have traded below its 21 DEMA on a daily chart. Furthermore, momentum indicator RSI has shown negative divergence on a daily time frame, which suggests down momentum in the prices. For now, we expect prices to move lower towards 388 levels in coming trading sessions. SEBI Registered - Research Analyst Equities I Commodities I Currencies I Mutual Funds MCX Copper Feb. Daily Chart CMP: 400.20 MCX Copper (Feb) Trend: Bearish Price potential: 388 Reversal: 405 MCX Crude Oil March. Daily Chart CMP: 3586 Technical View: MCX Crude Oil price has faced the resistance of its rising channel pattern and price has faced the resistance of its upper band of channel pattern at 3780 levels. Moreover, prices have been trading below 21 DEMA. Furthermore, NYMEX Crude Oil prices have given a breakdown of its rising trend line at $53.90 levels on the hourly chart. Moreover, Momentum indicator RSI has remained below 60 levels on the hourly chart which suggests negative movement in the prices. For now, we expect prices to move lower towards 3480 levels in coming trading sessions. MCX Crude Oil (March) Trend: Bearish Price potential: 3480 Reversal: 3645 Pivot levels for the Day S1 S2 S3 Pivot R1 R2 R3 Copper 396.8 393.4 390.6 400 403 406 415 Crude 3585 3566 3546 3605 3624 3644 3703 Base Metal Energy Aaj Ka Trend 20th Feb’17
- 3. Equities I Commodities I Currencies I Mutual FundsSEBI Registered - Research Analyst Equities I Commodities I Currencies I Mutual Funds Other Base Metals & Energy S1 S2 S3 Pivot R1 R2 R3 Trend Copper 396.8 393.4 390.6 400 403 406 415 Aluminum 124.6 123.5 122.3 125.8 126.9 128.1 131.6 Lead 150.2 149.2 147.7 151.7 152.7 154.2 158.2 Nickel 730.2 720.6 715.6 735.2 744.8 749.8 769.5 Zinc 185.9 183.7 180.9 188.7 190.9 193.7 201.5 Natural Gas 190.1 187.9 184.1 193.9 196.1 199.9 209.8 Fundamental News: Gold prices slipped lower on Friday, as the U.S. dollar slightly recovered from losses posted in the previous session, although ongoing geopolitical concerns were likely to continue to support safe-haven demand. The dollar regained some ground on Friday, helped by recent upbeat data and positive comments by Federal Reserve Chair Janet Yellen. The U.S. Department of Labor reported on Thursday that initial jobless claims increased by 5,000 to 239,000 last week, compared to expectations for a 11,000 rise to 245,000. The greenback had strengthened broadly after Ms. Yellen told the U.S. Senate Banking Committee on Tuesday that the central bank will likely need to raise interest rates at one of its upcoming meetings. The U.S. dollar index, which measures the greenback’s strength against a trade-weighted basket of six major currencies, was up 0.09 at 100.54, off the previous session’s one-week low of 100.40. Gold Futures rallied for a second day on Thursday, amid a weaker US dollar and heightened concerns of political uncertainty in the United States and Europe. Oil chalked up losses this week as the Energy Information Administration said Wednesday that U.S. stockpiles of crude and gasoline hit record highs. Oil prices have been stuck in a narrow range around the lower-to-mid-$50s over the past two months as investors weigh the impact of cuts in supply from the historic OPEC/non-OPEC agreement against record stockpiles of crude and increased drilling activity in the United States. On that last note, investors also looked ahead to the Baker Hughes U.S. rig count data for the latest week. Aaj Ka Trend 20th Feb’17
- 4. Equities I Commodities I Currencies I Mutual FundsSEBI Registered - Research Analyst Equities I Commodities I Currencies I Mutual Funds International Market Commodity Closing Price Gold 1235.85 Silver 17.97 Crude Oil 53.38 Brent Crude Oil 55.73 Natural Gas 3.04 COMEX/NYMEX/ICE ( Precious Metals & Energy) Currency & Commodity Index Currency (Spot) Current Price USD / INR 67.07 Dollar Index 100.89 EUR / USD 1.06 CRB Index* 192.12 Closing as on 17.02.17 *Closing as on 17.02.17 LME (Base Metals) ( $ per tones) Commodity Closing Price Copper 5960 Aluminum 1860 Zinc 2809 Lead 2252 Nickel 11003 SHFE (Base Metals) (Yuan per tones) Commodity Closing Price Copper 48330 Aluminum 14000 Zinc 22910 Lead 18715 Closing as on 17.02.17 Closing as on 17.02.17 LME INVENTORY DATA Aaj Ka Trend 13-Feb-17 14-Feb-17 15-Feb-17 16-Feb-17 17-Feb-17 Aluminium -5450 -5075 -8775 -3950 -5700 Copper -375 -4775 -7525 900 -7650 Lead -50 600 -25 -25 625 Nickel 1175 -1495 -936 -510 -606 Zinc 225 -2350 14425 -1800 -3075 20th Feb’17
- 5. Equities I Commodities I Currencies I Mutual Funds This is solely for information of clients of Choice Broking and does not construe to be an investment advice. It is also not intended as an offer or solicitation for the purchase and sale of any financial instruments. Any action taken by you on the basis of the information contained herein is your responsibility alone and Choice Broking its subsidiaries or its employees or associates will not be liable in any manner for the consequences of such action taken by you. We have exercised due diligence in checking the correctness and authenticity of the information contained in this recommendation, but Choice Broking or any of its subsidiaries or associates or employees shall not be in any way responsible for any loss or damage that may arise to any person from any inadvertent error in the information contained in this recommendation or any action taken on basis of this information. Technical analysis studies market psychology, price patterns and volume levels. It is used to forecast future price and market movements. Technical analysis is complementary to fundamental analysis and news sources. The recommendations issued herewith might be contrary to recommendations issued by Choice Broking in the company research undertaken as the recommendations stated in this report is derived purely from technical analysis. Choice Broking has based this document on information obtained from sources it believes to be reliable but which it has not independently verified; Choice Broking makes no guarantee, representation or warranty and accepts no responsibility or liability as to its accuracy or completeness. The opinions contained within the report are based upon publicly available information at the time of publication and are subject to change without notice. The information and any disclosures provided herein are in summary form and have been prepared for informational purposes. The recommendations and suggested price levels are intended purely for trading purposes. The recommendations are valid for the day of the report however trading trends and volumes might vary substantially on an intraday basis and the recommendations may be subject to change. The information and any disclosures provided herein may be considered confidential. Any use, distribution, modification, copying, forwarding or disclosure by any person is strictly prohibited. The information and any disclosures provided herein do not constitute a solicitation or offer to purchase or sell any security or other financial product or instrument. The current performance may be unaudited. Past performance does not guarantee future returns. There can be no assurance that investments will achieve any targeted rates of return, and there is no guarantee against the loss of your entire investment. POTENTIAL CONFLICT OF INTEREST DISCLOSURE (as on date of report) Disclosure of interest statement – • Analyst interest of the stock /Instrument(s): - No. • Firm interest of the stock / Instrument (s): - No. Disclaimer Contact Us Amit Pathania Research Associate amit.pathania@choiceindia.com www.choicebroking.incustomercare@choiceindia.com SEBI Registered - Research Analyst Equities I Commodities I Currencies I Mutual Funds Aaj Ka Trend 20th Feb’17 Neeraj Yadav Research Advisor neeraj.yadav@choiceindia.com Anish Vyas Senior Research Associate anish.vyas@choiceindia.com Amit Pathania Digitally signed by Amit Pathania DN: cn=Amit Pathania, o=Choice Equity Broking Pvt. ltd, ou=Research Department, email=amit.pathania@choiceindia.com, c=IN Date: 2017.02.18 12:10:08 +05'30'