Aaj ka trend 20.12.16
•
0 likes•22 views

The document provides a technical analysis of various commodities including gold, silver, copper, and crude oil. For gold and silver, it predicts that prices will move higher in the coming trading sessions as prices have been taking support and momentum indicators suggest a potential bounce back. For copper, it predicts prices will move lower as prices have shown a breakdown of patterns and momentum is weakening. For crude oil, it predicts prices will move higher as prices have broken out of patterns and momentum indicators are positive.

Recommended
More Related Content
What's hot
What's hot (20)
Viewers also liked
Viewers also liked (11)
Similar to Aaj ka trend 20.12.16
Similar to Aaj ka trend 20.12.16 (20)
Recently uploaded
Recently uploaded (20)
Aaj ka trend 20.12.16
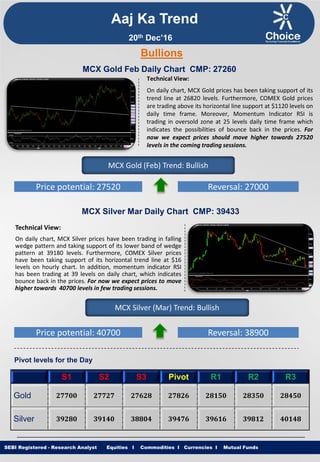
- 1. Equities I Commodities I Currencies I Mutual Funds Aaj Ka Trend Technical View: On daily chart, MCX Gold prices has been taking support of its trend line at 26820 levels. Furthermore, COMEX Gold prices are trading above its horizontal line support at $1120 levels on daily time frame. Moreover, Momentum Indicator RSI is trading in oversold zone at 25 levels daily time frame which indicates the possibilities of bounce back in the prices. For now we expect prices should move higher towards 27520 levels in the coming trading sessions. SEBI Registered - Research Analyst Equities I Commodities I Currencies I Mutual Funds Bullions MCX Gold Feb Daily Chart CMP: 27260 MCX Gold (Feb) Trend: Bullish Price potential: 27520 Reversal: 27000 MCX Silver Mar Daily Chart CMP: 39433 Technical View: On daily chart, MCX Silver prices have been trading in falling wedge pattern and taking support of its lower band of wedge pattern at 39180 levels. Furthermore, COMEX Silver prices have been taking support of its horizontal trend line at $16 levels on hourly chart. In addition, momentum indicator RSI has been trading at 39 levels on daily chart, which indicates bounce back in the prices. For now we expect prices to move higher towards 40700 levels in few trading sessions. MCX Silver (Mar) Trend: Bullish Price potential: 40700 Reversal: 38900 Pivot levels for the Day S1 S2 S3 Pivot R1 R2 R3 Gold 27700 27727 27628 27826 28150 28350 28450 Silver 39280 39140 38804 39476 39616 39812 40148 20th Dec’16
- 2. Equities I Commodities I Currencies I Mutual Funds Technical View: MCX Copper price has shown breakdown of its ascending triangle pattern at 383 levels on daily chart. Moreover, COMEX Copper price has witnessed breakdown of its ascending triangle pattern $2.62 levels on daily chart. In addition MCX Copper prices are trading below its 21 DEMA. Furthermore, momentum indicator MACD has shown negative crossover on daily time frame, which suggest further weakness in the momentum can be seen. For now we expect prices to move lower towards 368 levels in coming trading sessions. SEBI Registered - Research Analyst Equities I Commodities I Currencies I Mutual Funds MCX Copper Feb Hourly Chart CMP: 375.65 MCX Copper (Feb) Trend: Bearish Price potential: 368 Reversal: 381 MCX Crude Oil Jan. Daily Chart CMP: 3611 Technical View: MCX Crude Oil price has shown breakout of its ascending triangle pattern 3530 levels on daily chart. MCX Crude Oil price has been taking support of its horizontal trend line at 3356 levels on hourly chart. MCX Crude Oil is trading above its 50 DEMA on daily chart. Moreover, Momentum indicator RSI is trading above 60 levels on daily chart which suggest the positive movement in the prices. For now we expect prices to move higher towards 3700 levels in coming trading sessions. MCX Crude Oil (Jan) Trend: Bullish Price potential: 3700 Reversal: 3550 Pivot levels for the Day S1 S2 S3 Pivot R1 R2 R3 Copper 371.6 366.6 355.8 377.4 382.4 388.2 399.0 Crude 3578 3553 3501 3605 3630 3657 3709 Base Metal Energy Aaj Ka Trend 20th Dec’16
- 3. Equities I Commodities I Currencies I Mutual FundsSEBI Registered - Research Analyst Equities I Commodities I Currencies I Mutual Funds Other Base Metals & Energy S1 S2 S3 Pivot R1 R2 R3 Trend Copper 371.6 366.6 355.8 377.4 382.4 388.2 399.0 Aluminum 116.1 115.6 114.7 116.6 117.1 117.5 118.5 Lead 142.1 138.8 130.5 147.0 150.4 155.3 163.5 Nickel 722.1 705.8 670.8 740.8 757.1 775.8 810.8 Zinc 172.4 168.2 158.2 178.2 182.4 188.2 198.2 Natural Gas 226.9 224.0 218.0 230.0 232.9 236.0 242.0 Fundamental News: Gold prices edged up during European hours on Monday, extending its recovery from ten-month lows as the U.S. dollar pulled back from recent highs. The dollar index, which measures the greenback’s strength against a trade-weighted basket of six major currencies, was down 0.3% at 102.60 in early trade, slipping from last week's 14-year high of 103.55, as a bout of profit taking kicked in ahead of the year-end holidays. Dollar weakness usually benefits gold, as it boosts the metal's appeal as an alternative asset and makes dollar- priced commodities cheaper for holders of other currencies. Gold futures lost $24.10, or 2.1%, last week, the sixth straight weekly decline, after the Federal Reserve hiked interest rates for the first time in a year and projected three more increases in 2017, up from the two projected in September. The precious metal is sensitive to moves in U.S. rates, which lift the opportunity cost of holding non-yielding assets such as bullion, while boosting the dollar in which it is priced. Oil edged higher Monday on favorable expectations of compliance with agreed producer cuts. There are signs oil firms are already moving to implement the reductions. If the cuts are fully adhered to, the International Energy Agency sees a supply deficit in the first half of next year. Baker Hughes weekly U.S. rig count data Friday showed an increase of 12 to 510, the highest level since the start of the year. Aaj Ka Trend 20th Dec’16
- 4. Equities I Commodities I Currencies I Mutual FundsSEBI Registered - Research Analyst Equities I Commodities I Currencies I Mutual Funds International Market Commodity Closing Price Gold 1138.46 Silver 16.03 Crude Oil 51.96 Brent Crude Oil 54.84 Natural Gas 3.394 COMEX/NYMEX/ICE ( Precious Metals & Energy) Currency & Commodity Index Currency (Spot) Current Price USD / INR 67.8750 Dollar Index 103.08 EUR / USD 1.0409 CRB Index* 191.22 Closing as on 19.12.16 *Closing as on 19.12.16 LME (Base Metals) ( $ per tones) Commodity Closing Price Copper 5496 Aluminum 1712 Zinc 2607 Lead 2170 Nickel 10880 SHFE (Base Metals) (Yuan per tones) Commodity Closing Price Copper 44930 Aluminum 12665 Zinc 21045 Lead 18390 Closing as on 19.12.16 Closing as on 19.12.16 LME INVENTORY DATA Aaj Ka Trend 13-Dec-16 14-Dec-16 15-Dec-16 16-Dec-16 19-Dec-16 Aluminium -22151 -22201 -2751 -28074 -5224 Copper 126624 19949 17174 11776 38399 Lead 0 -51 -101 -49 -549 Nickel -73 1141 1669 -121 115 Zinc -1249 -902 41 -1826 -1301 20th Dec’16
- 5. Equities I Commodities I Currencies I Mutual Funds This is solely for information of clients of Choice Broking and does not construe to be an investment advice. It is also not intended as an offer or solicitation for the purchase and sale of any financial instruments. Any action taken by you on the basis of the information contained herein is your responsibility alone and Choice Broking its subsidiaries or its employees or associates will not be liable in any manner for the consequences of such action taken by you. We have exercised due diligence in checking the correctness and authenticity of the information contained in this recommendation, but Choice Broking or any of its subsidiaries or associates or employees shall not be in any way responsible for any loss or damage that may arise to any person from any inadvertent error in the information contained in this recommendation or any action taken on basis of this information. Technical analysis studies market psychology, price patterns and volume levels. It is used to forecast future price and market movements. Technical analysis is complementary to fundamental analysis and news sources. The recommendations issued herewith might be contrary to recommendations issued by Choice Broking in the company research undertaken as the recommendations stated in this report is derived purely from technical analysis. Choice Broking has based this document on information obtained from sources it believes to be reliable but which it has not independently verified; Choice Broking makes no guarantee, representation or warranty and accepts no responsibility or liability as to its accuracy or completeness. The opinions contained within the report are based upon publicly available information at the time of publication and are subject to change without notice. The information and any disclosures provided herein are in summary form and have been prepared for informational purposes. The recommendations and suggested price levels are intended purely for trading purposes. The recommendations are valid for the day of the report however trading trends and volumes might vary substantially on an intraday basis and the recommendations may be subject to change. The information and any disclosures provided herein may be considered confidential. Any use, distribution, modification, copying, forwarding or disclosure by any person is strictly prohibited. The information and any disclosures provided herein do not constitute a solicitation or offer to purchase or sell any security or other financial product or instrument. The current performance may be unaudited. Past performance does not guarantee future returns. There can be no assurance that investments will achieve any targeted rates of return, and there is no guarantee against the loss of your entire investment. POTENTIAL CONFLICT OF INTEREST DISCLOSURE (as on date of report) Disclosure of interest statement – • Analyst interest of the stock /Instrument(s): - No. • Firm interest of the stock / Instrument (s): - No. Disclaimer Contact Us Amit Pathania Research Associate amit.pathania@choiceindia.com www.choicebroking.incustomercare@choiceindia.com SEBI Registered - Research Analyst Equities I Commodities I Currencies I Mutual Funds Aaj Ka Trend 20th Dec’16 Neeraj Yadav Research Advisor neeraj.yadav@choiceindia.com Anish Vyas Senior Research Associate anish.vyas@choiceindia.com Anish Vyas Digitally signed by Anish Vyas DN: cn=Anish Vyas, o=Choice Merchandise Broking Pvt. Ltd, ou=Sr. Research Associate, email=anish.vyas@choiceindia.com, c=IN Date: 2016.12.20 09:14:55 +05'30'