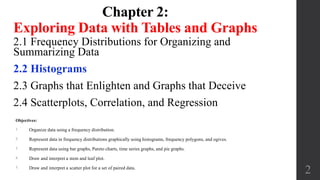
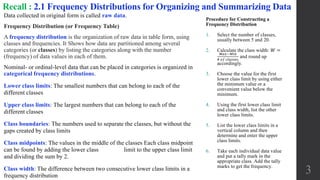
SlideShare a Scribd company logo
Elementary Statistics
Chapter 2:
Exploring Data with
Tables and Graphs
2.2 Histograms
1
Chapter 2:
Exploring Data with Tables and Graphs
2.1 Frequency Distributions for Organizing and
Summarizing Data
2.2 Histograms
2.3 Graphs that Enlighten and Graphs that Deceive
2.4 Scatterplots, Correlation, and Regression
2
Objectives:
1. Organize data using a frequency distribution.
2. Represent data in frequency distributions graphically using histograms, frequency polygons, and ogives.
3. Represent data using bar graphs, Pareto charts, time series graphs, and pie graphs.
4. Draw and interpret a stem and leaf plot.
5. Draw and interpret a scatter plot for a set of paired data.
Recall : 2.1 Frequency Distributions for Organizing and Summarizing Data
Data collected in original form is called raw data.
Frequency Distribution (or Frequency Table)
A frequency distribution is the organization of raw data in table form, using
classes and frequencies. It Shows how data are partitioned among several
categories (or classes) by listing the categories along with the number
(frequency) of data values in each of them.
Nominal- or ordinal-level data that can be placed in categories is organized in
categorical frequency distributions.
Lower class limits: The smallest numbers that can belong to each of the
different classes
Upper class limits: The largest numbers that can belong to each of the
different classes
Class boundaries: The numbers used to separate the classes, but without the
gaps created by class limits
Class midpoints: The values in the middle of the classes Each class midpoint
can be found by adding the lower class limit to the upper class limit
and dividing the sum by 2.
Class width: The difference between two consecutive lower class limits in a
frequency distribution
Procedure for Constructing a
Frequency Distribution
1. Select the number of classes,
usually between 5 and 20.
2. Calculate the class width: 𝑊 =
𝑀𝑎𝑥−𝑀𝑖𝑛
# 𝑜𝑓 𝑐𝑙𝑎𝑠𝑠𝑒𝑠
and round up
accordingly.
3. Choose the value for the first
lower class limit by using either
the minimum value or a
convenient value below the
minimum.
4. Using the first lower class limit
and class width, list the other
lower class limits.
5. List the lower class limits in a
vertical column and then
determine and enter the upper
class limits.
6. Take each individual data value
and put a tally mark in the
appropriate class. Add the tally
marks to get the frequency.
3
2.2 Histograms
While a frequency distribution is a useful tool for summarizing data and
investigating the distribution of data, an even better tool is a histogram, which
is a graph that is easier to interpret than a table of numbers.
Key Concept
Histogram:
A graph consisting of bars of equal width drawn adjacent to each other (unless
there are gaps in the data)
The horizontal scale represents classes of quantitative data values, and the vertical
scale represents frequencies. The heights of the bars correspond to frequency values.
Important Uses of a Histogram
• Visually displays the shape of the distribution of the data
• Shows the location of the center of the data
• Shows the spread of the data & Identifies outliers
4
5
Example 1
Construct a histogram to
represent the data for the record
high temperatures for each of
the 50 states.
Class Limits
Class
Boundaries
Frequency
100 - 104
105 - 109
110 - 114
115 - 119
120 - 124
125 - 129
130 - 134
99.5 - 104.5
104.5 - 109.5
109.5 - 114.5
114.5 - 119.5
119.5 - 124.5
124.5 - 129.5
129.5 - 134.5
2
8
18
13
7
1
1
Relative Frequency Histogram
Relative Frequency
Histogram has the same shape
and horizontal scale as a
histogram, but the vertical scale
is marked with relative
frequencies instead of actual
frequencies.
Time
(seconds) Frequency
75-124 11
125-174 24
175-224 10
225-274 3
275-324 2
Example 2
Relative
Frequency = f / n
11 / 50 = 0.22
24 / 50 = 0.48
10 / 50 = 0.2
3 / 50 = 0.06
2 / 50 = 0.04
Percent
Frequency
22%
24%
20%
6%
4%
6
f = 50 rf = 1
Common
Distribution
Shapes
7
Critical Thinking Interpreting Histograms
Explore the data by analyzing the histogram to see what can be learned about
“CVDOT”: the Center of the data, the Variation, the shape of the Distribution,
whether there are any Outliers, and Time.
Normal Distribution
Because this histogram is roughly
bell-shaped, we say that the data
have a normal distribution.
8
Skewness:
A distribution of data is
skewed if it is not symmetric
and extends more to one side
than to the other.
Data skewed to the right
(positively skewed) have a
longer right tail.
Data skewed to the left
(negative skewed) have a
longer left tail.
9
Example 3
Given Histogram: Find the following:
1. Estimate the number of subjects
2. The width
3. Boundaries of the 1st bar
4. Explain the gap.
5. Normal?
Find the following:
1. The number of subjects 12 + 20 + 8 + 0 + 0 + 5 + 18 + 14 + 3 = 80
2. The width; 5.6 – 5.5 = 0.1 g
3. Boundaries of the 1st bar: 5.5g & 5.6g
4. The Gap: The 1st 40 quarters are from a different era than the 2nd set of 40 quarters.
5. Not Normally Distribution
Pre 1964:
90% silver + 10 % copper
Post 1964:
Copper-Nickel alloy
Assessing Normality with Normal Quantile Plots
Criteria for Assessing Normality with a Normal Quantile Plot
Normal Distribution: The pattern of the points in the normal quantile plot is reasonably close to a
straight line, and the points do not show some systematic pattern that is not a straight-line pattern.
Not a Normal Distribution: The population distribution is not normal if the normal quantile plot has
either or both of these two conditions:
 The points do not lie reasonably close to a straight-line pattern.
 The points show some systematic pattern that is not a straight-line pattern.
10
Normal Distribution: The points are
reasonably close to a straight-line pattern, and
there is no other systematic pattern that is not
a straight-line pattern.
Not a Normal Distribution: The
points do not lie reasonably close
to a straight line.
Normal Quantile Plot:
A normal quantile plot
(or normal probability
plot) is a graph of
points (x, y) where each
x value is from the
original set of sample
data, and each y value
is the corresponding z
score that is expected
from the standard
normal distribution.

More Related Content

What's hot

Skewness & Kurtosis
Skewness & KurtosisSkewness & Kurtosis
Skewness & KurtosisNavin Bafna
 
3 Data Structure in R
3 Data Structure in R3 Data Structure in R
3 Data Structure in R
Dr Nisha Arora
 
Basic Concepts of Probability
Basic Concepts of ProbabilityBasic Concepts of Probability
Basic Concepts of Probability
Long Beach City College
 
Introduction to Statistics
Introduction to StatisticsIntroduction to Statistics
Introduction to Statistics
Anjan Mahanta
 
Data organization
Data organizationData organization
Data organization
rowell balala
 
Statistics
StatisticsStatistics
Statisticsitutor
 
Frequency distribution
Frequency distributionFrequency distribution
Frequency distribution
Aishwarya PT
 
Introduction To Statistics
Introduction To StatisticsIntroduction To Statistics
Introduction To Statisticsalbertlaporte
 
Box and whisker plots
Box and whisker plotsBox and whisker plots
Box and whisker plots
Garima Gupta
 
Coefficient of variation
Coefficient of variationCoefficient of variation
Coefficient of variation
Nadeem Uddin
 
Statistical inference
Statistical inferenceStatistical inference
Statistical inferenceJags Jagdish
 
Sampling Distributions and Estimators
Sampling Distributions and Estimators Sampling Distributions and Estimators
Sampling Distributions and Estimators
Long Beach City College
 
7. binomial distribution
7. binomial distribution7. binomial distribution
7. binomial distribution
Karan Kukreja
 
Types of Statistics
Types of StatisticsTypes of Statistics
Types of Statisticsloranel
 
Standard deviation
Standard deviationStandard deviation
03.data presentation(2015) 2
03.data presentation(2015) 203.data presentation(2015) 2
03.data presentation(2015) 2
Mmedsc Hahm
 
Skewness and Kurtosis
Skewness and KurtosisSkewness and Kurtosis
Skewness and Kurtosis
Rohan Nagpal
 
Continuous probability distribution
Continuous probability distributionContinuous probability distribution
Continuous probability distribution
Habibullah Bahar University College
 
Relative frequency distribution
Relative frequency distributionRelative frequency distribution
Relative frequency distribution
Nadeem Uddin
 

What's hot (20)

Skewness & Kurtosis
Skewness & KurtosisSkewness & Kurtosis
Skewness & Kurtosis
 
3 Data Structure in R
3 Data Structure in R3 Data Structure in R
3 Data Structure in R
 
Basic Concepts of Probability
Basic Concepts of ProbabilityBasic Concepts of Probability
Basic Concepts of Probability
 
Introduction to Statistics
Introduction to StatisticsIntroduction to Statistics
Introduction to Statistics
 
Data organization
Data organizationData organization
Data organization
 
Statistics
StatisticsStatistics
Statistics
 
Frequency distribution
Frequency distributionFrequency distribution
Frequency distribution
 
Introduction To Statistics
Introduction To StatisticsIntroduction To Statistics
Introduction To Statistics
 
Box and whisker plots
Box and whisker plotsBox and whisker plots
Box and whisker plots
 
Coefficient of variation
Coefficient of variationCoefficient of variation
Coefficient of variation
 
Statistical inference
Statistical inferenceStatistical inference
Statistical inference
 
Histogram
HistogramHistogram
Histogram
 
Sampling Distributions and Estimators
Sampling Distributions and Estimators Sampling Distributions and Estimators
Sampling Distributions and Estimators
 
7. binomial distribution
7. binomial distribution7. binomial distribution
7. binomial distribution
 
Types of Statistics
Types of StatisticsTypes of Statistics
Types of Statistics
 
Standard deviation
Standard deviationStandard deviation
Standard deviation
 
03.data presentation(2015) 2
03.data presentation(2015) 203.data presentation(2015) 2
03.data presentation(2015) 2
 
Skewness and Kurtosis
Skewness and KurtosisSkewness and Kurtosis
Skewness and Kurtosis
 
Continuous probability distribution
Continuous probability distributionContinuous probability distribution
Continuous probability distribution
 
Relative frequency distribution
Relative frequency distributionRelative frequency distribution
Relative frequency distribution
 

Similar to 2.2 Histograms

2.3 Graphs that enlighten and graphs that deceive
2.3 Graphs that enlighten and graphs that deceive2.3 Graphs that enlighten and graphs that deceive
2.3 Graphs that enlighten and graphs that deceive
Long Beach City College
 
2.1 frequency distributions, histograms, and related topics
2.1 frequency distributions, histograms, and related topics2.1 frequency distributions, histograms, and related topics
2.1 frequency distributions, histograms, and related topicsleblance
 
collectionandrepresentationofdata1-200904192336.pptx
collectionandrepresentationofdata1-200904192336.pptxcollectionandrepresentationofdata1-200904192336.pptx
collectionandrepresentationofdata1-200904192336.pptx
aibakimito
 
Tabular and Graphical Representation of Data
Tabular and Graphical Representation of Data Tabular and Graphical Representation of Data
Tabular and Graphical Representation of Data
Sir Parashurambhau College, Pune
 
Frequency Distributions for Organizing and Summarizing
Frequency Distributions for Organizing and Summarizing Frequency Distributions for Organizing and Summarizing
Frequency Distributions for Organizing and Summarizing
Long Beach City College
 
Descriptive statistics
Descriptive statisticsDescriptive statistics
Descriptive statisticsBurak Mızrak
 
lesson-data-presentation-tools-1.pptx
lesson-data-presentation-tools-1.pptxlesson-data-presentation-tools-1.pptx
lesson-data-presentation-tools-1.pptx
AnalynPasto
 
2.4 Scatterplots, correlation, and regression
2.4 Scatterplots, correlation, and regression2.4 Scatterplots, correlation, and regression
2.4 Scatterplots, correlation, and regression
Long Beach City College
 
2.1 frequency distributions for organizing and summarizing data
2.1 frequency distributions for organizing and summarizing data2.1 frequency distributions for organizing and summarizing data
2.1 frequency distributions for organizing and summarizing data
Long Beach City College
 
2 biostatistics presenting data
2  biostatistics presenting data2  biostatistics presenting data
2 biostatistics presenting data
Dr. Nazar Jaf
 
Frequency Distribution
Frequency DistributionFrequency Distribution
Frequency Distribution
TeacherMariza
 
3_-frequency_distribution.pptx
3_-frequency_distribution.pptx3_-frequency_distribution.pptx
3_-frequency_distribution.pptx
itzsudipto99
 
3.1 Measures of center
3.1 Measures of center3.1 Measures of center
3.1 Measures of center
Long Beach City College
 
Chapter 2: Frequency Distribution and Graphs
Chapter 2: Frequency Distribution and GraphsChapter 2: Frequency Distribution and Graphs
Chapter 2: Frequency Distribution and GraphsMong Mara
 
Different Types of Graphs in Statistics.pptx
Different Types of Graphs in Statistics.pptxDifferent Types of Graphs in Statistics.pptx
Different Types of Graphs in Statistics.pptx
johaymafernandez1
 
20- Tabular & Graphical Presentation of data(UG2017-18).ppt
20- Tabular & Graphical Presentation of data(UG2017-18).ppt20- Tabular & Graphical Presentation of data(UG2017-18).ppt
20- Tabular & Graphical Presentation of data(UG2017-18).ppt
RAJESHKUMAR428748
 
20- Tabular & Graphical Presentation of data(UG2017-18).ppt
20- Tabular & Graphical Presentation of data(UG2017-18).ppt20- Tabular & Graphical Presentation of data(UG2017-18).ppt
20- Tabular & Graphical Presentation of data(UG2017-18).ppt
aibakimito
 
LINE AND SCATTER DIAGRAM,FREQUENCY DISTRIBUTION
LINE AND SCATTER DIAGRAM,FREQUENCY DISTRIBUTIONLINE AND SCATTER DIAGRAM,FREQUENCY DISTRIBUTION
LINE AND SCATTER DIAGRAM,FREQUENCY DISTRIBUTION
ruhila bhat
 
Graphs that Enlighten and Graphs that Deceive
Graphs that Enlighten and Graphs that DeceiveGraphs that Enlighten and Graphs that Deceive
Graphs that Enlighten and Graphs that Deceive
Long Beach City College
 
Chapter 1 descriptive_stats_2_rev_2009
Chapter 1 descriptive_stats_2_rev_2009Chapter 1 descriptive_stats_2_rev_2009
Chapter 1 descriptive_stats_2_rev_2009ayimsevenfold
 

Similar to 2.2 Histograms (20)

2.3 Graphs that enlighten and graphs that deceive
2.3 Graphs that enlighten and graphs that deceive2.3 Graphs that enlighten and graphs that deceive
2.3 Graphs that enlighten and graphs that deceive
 
2.1 frequency distributions, histograms, and related topics
2.1 frequency distributions, histograms, and related topics2.1 frequency distributions, histograms, and related topics
2.1 frequency distributions, histograms, and related topics
 
collectionandrepresentationofdata1-200904192336.pptx
collectionandrepresentationofdata1-200904192336.pptxcollectionandrepresentationofdata1-200904192336.pptx
collectionandrepresentationofdata1-200904192336.pptx
 
Tabular and Graphical Representation of Data
Tabular and Graphical Representation of Data Tabular and Graphical Representation of Data
Tabular and Graphical Representation of Data
 
Frequency Distributions for Organizing and Summarizing
Frequency Distributions for Organizing and Summarizing Frequency Distributions for Organizing and Summarizing
Frequency Distributions for Organizing and Summarizing
 
Descriptive statistics
Descriptive statisticsDescriptive statistics
Descriptive statistics
 
lesson-data-presentation-tools-1.pptx
lesson-data-presentation-tools-1.pptxlesson-data-presentation-tools-1.pptx
lesson-data-presentation-tools-1.pptx
 
2.4 Scatterplots, correlation, and regression
2.4 Scatterplots, correlation, and regression2.4 Scatterplots, correlation, and regression
2.4 Scatterplots, correlation, and regression
 
2.1 frequency distributions for organizing and summarizing data
2.1 frequency distributions for organizing and summarizing data2.1 frequency distributions for organizing and summarizing data
2.1 frequency distributions for organizing and summarizing data
 
2 biostatistics presenting data
2  biostatistics presenting data2  biostatistics presenting data
2 biostatistics presenting data
 
Frequency Distribution
Frequency DistributionFrequency Distribution
Frequency Distribution
 
3_-frequency_distribution.pptx
3_-frequency_distribution.pptx3_-frequency_distribution.pptx
3_-frequency_distribution.pptx
 
3.1 Measures of center
3.1 Measures of center3.1 Measures of center
3.1 Measures of center
 
Chapter 2: Frequency Distribution and Graphs
Chapter 2: Frequency Distribution and GraphsChapter 2: Frequency Distribution and Graphs
Chapter 2: Frequency Distribution and Graphs
 
Different Types of Graphs in Statistics.pptx
Different Types of Graphs in Statistics.pptxDifferent Types of Graphs in Statistics.pptx
Different Types of Graphs in Statistics.pptx
 
20- Tabular & Graphical Presentation of data(UG2017-18).ppt
20- Tabular & Graphical Presentation of data(UG2017-18).ppt20- Tabular & Graphical Presentation of data(UG2017-18).ppt
20- Tabular & Graphical Presentation of data(UG2017-18).ppt
 
20- Tabular & Graphical Presentation of data(UG2017-18).ppt
20- Tabular & Graphical Presentation of data(UG2017-18).ppt20- Tabular & Graphical Presentation of data(UG2017-18).ppt
20- Tabular & Graphical Presentation of data(UG2017-18).ppt
 
LINE AND SCATTER DIAGRAM,FREQUENCY DISTRIBUTION
LINE AND SCATTER DIAGRAM,FREQUENCY DISTRIBUTIONLINE AND SCATTER DIAGRAM,FREQUENCY DISTRIBUTION
LINE AND SCATTER DIAGRAM,FREQUENCY DISTRIBUTION
 
Graphs that Enlighten and Graphs that Deceive
Graphs that Enlighten and Graphs that DeceiveGraphs that Enlighten and Graphs that Deceive
Graphs that Enlighten and Graphs that Deceive
 
Chapter 1 descriptive_stats_2_rev_2009
Chapter 1 descriptive_stats_2_rev_2009Chapter 1 descriptive_stats_2_rev_2009
Chapter 1 descriptive_stats_2_rev_2009
 

More from Long Beach City College

Practice test ch 9 inferences from two samples
Practice test ch 9 inferences from two samplesPractice test ch 9 inferences from two samples
Practice test ch 9 inferences from two samples
Long Beach City College
 
Practice Test Ch 8 Hypothesis Testing
Practice Test Ch 8 Hypothesis TestingPractice Test Ch 8 Hypothesis Testing
Practice Test Ch 8 Hypothesis Testing
Long Beach City College
 
Solution to the practice test ch 10 correlation reg ch 11 gof ch12 anova
Solution to the practice test ch 10 correlation reg ch 11 gof ch12 anovaSolution to the practice test ch 10 correlation reg ch 11 gof ch12 anova
Solution to the practice test ch 10 correlation reg ch 11 gof ch12 anova
Long Beach City College
 
Practice test ch 10 correlation reg ch 11 gof ch12 anova
Practice test ch 10 correlation reg ch 11 gof ch12 anovaPractice test ch 10 correlation reg ch 11 gof ch12 anova
Practice test ch 10 correlation reg ch 11 gof ch12 anova
Long Beach City College
 
Practice test ch 8 hypothesis testing ch 9 two populations
Practice test ch 8 hypothesis testing ch 9 two populationsPractice test ch 8 hypothesis testing ch 9 two populations
Practice test ch 8 hypothesis testing ch 9 two populations
Long Beach City College
 
Solution to the practice test ch 8 hypothesis testing ch 9 two populations
Solution to the practice test ch 8 hypothesis testing ch 9 two populationsSolution to the practice test ch 8 hypothesis testing ch 9 two populations
Solution to the practice test ch 8 hypothesis testing ch 9 two populations
Long Beach City College
 
Solution to the Practice Test 3A, Chapter 6 Normal Probability Distribution
Solution to the Practice Test 3A, Chapter 6 Normal Probability DistributionSolution to the Practice Test 3A, Chapter 6 Normal Probability Distribution
Solution to the Practice Test 3A, Chapter 6 Normal Probability Distribution
Long Beach City College
 
Practice Test Chapter 6 (Normal Probability Distributions)
Practice Test Chapter 6 (Normal Probability Distributions)Practice Test Chapter 6 (Normal Probability Distributions)
Practice Test Chapter 6 (Normal Probability Distributions)
Long Beach City College
 
Practice Test 2 Solutions
Practice Test 2  SolutionsPractice Test 2  Solutions
Practice Test 2 Solutions
Long Beach City College
 
Practice Test 2 Probability
Practice Test 2 ProbabilityPractice Test 2 Probability
Practice Test 2 Probability
Long Beach City College
 
Practice Test 1 solutions
Practice Test 1 solutions  Practice Test 1 solutions
Practice Test 1 solutions
Long Beach City College
 
Practice Test 1
Practice Test 1Practice Test 1
Practice Test 1
Long Beach City College
 
Stat sample test ch 12 solution
Stat sample test ch 12 solutionStat sample test ch 12 solution
Stat sample test ch 12 solution
Long Beach City College
 
Stat sample test ch 12
Stat sample test ch 12Stat sample test ch 12
Stat sample test ch 12
Long Beach City College
 
Stat sample test ch 11
Stat sample test ch 11Stat sample test ch 11
Stat sample test ch 11
Long Beach City College
 
Stat sample test ch 10
Stat sample test ch 10Stat sample test ch 10
Stat sample test ch 10
Long Beach City College
 
Two-Way ANOVA
Two-Way ANOVATwo-Way ANOVA
One-Way ANOVA
One-Way ANOVAOne-Way ANOVA
Contingency Tables
Contingency TablesContingency Tables
Contingency Tables
Long Beach City College
 
Goodness of Fit Notation
Goodness of Fit NotationGoodness of Fit Notation
Goodness of Fit Notation
Long Beach City College
 

More from Long Beach City College (20)

Practice test ch 9 inferences from two samples
Practice test ch 9 inferences from two samplesPractice test ch 9 inferences from two samples
Practice test ch 9 inferences from two samples
 
Practice Test Ch 8 Hypothesis Testing
Practice Test Ch 8 Hypothesis TestingPractice Test Ch 8 Hypothesis Testing
Practice Test Ch 8 Hypothesis Testing
 
Solution to the practice test ch 10 correlation reg ch 11 gof ch12 anova
Solution to the practice test ch 10 correlation reg ch 11 gof ch12 anovaSolution to the practice test ch 10 correlation reg ch 11 gof ch12 anova
Solution to the practice test ch 10 correlation reg ch 11 gof ch12 anova
 
Practice test ch 10 correlation reg ch 11 gof ch12 anova
Practice test ch 10 correlation reg ch 11 gof ch12 anovaPractice test ch 10 correlation reg ch 11 gof ch12 anova
Practice test ch 10 correlation reg ch 11 gof ch12 anova
 
Practice test ch 8 hypothesis testing ch 9 two populations
Practice test ch 8 hypothesis testing ch 9 two populationsPractice test ch 8 hypothesis testing ch 9 two populations
Practice test ch 8 hypothesis testing ch 9 two populations
 
Solution to the practice test ch 8 hypothesis testing ch 9 two populations
Solution to the practice test ch 8 hypothesis testing ch 9 two populationsSolution to the practice test ch 8 hypothesis testing ch 9 two populations
Solution to the practice test ch 8 hypothesis testing ch 9 two populations
 
Solution to the Practice Test 3A, Chapter 6 Normal Probability Distribution
Solution to the Practice Test 3A, Chapter 6 Normal Probability DistributionSolution to the Practice Test 3A, Chapter 6 Normal Probability Distribution
Solution to the Practice Test 3A, Chapter 6 Normal Probability Distribution
 
Practice Test Chapter 6 (Normal Probability Distributions)
Practice Test Chapter 6 (Normal Probability Distributions)Practice Test Chapter 6 (Normal Probability Distributions)
Practice Test Chapter 6 (Normal Probability Distributions)
 
Practice Test 2 Solutions
Practice Test 2  SolutionsPractice Test 2  Solutions
Practice Test 2 Solutions
 
Practice Test 2 Probability
Practice Test 2 ProbabilityPractice Test 2 Probability
Practice Test 2 Probability
 
Practice Test 1 solutions
Practice Test 1 solutions  Practice Test 1 solutions
Practice Test 1 solutions
 
Practice Test 1
Practice Test 1Practice Test 1
Practice Test 1
 
Stat sample test ch 12 solution
Stat sample test ch 12 solutionStat sample test ch 12 solution
Stat sample test ch 12 solution
 
Stat sample test ch 12
Stat sample test ch 12Stat sample test ch 12
Stat sample test ch 12
 
Stat sample test ch 11
Stat sample test ch 11Stat sample test ch 11
Stat sample test ch 11
 
Stat sample test ch 10
Stat sample test ch 10Stat sample test ch 10
Stat sample test ch 10
 
Two-Way ANOVA
Two-Way ANOVATwo-Way ANOVA
Two-Way ANOVA
 
One-Way ANOVA
One-Way ANOVAOne-Way ANOVA
One-Way ANOVA
 
Contingency Tables
Contingency TablesContingency Tables
Contingency Tables
 
Goodness of Fit Notation
Goodness of Fit NotationGoodness of Fit Notation
Goodness of Fit Notation
 

Recently uploaded

The Roman Empire A Historical Colossus.pdf
The Roman Empire A Historical Colossus.pdfThe Roman Empire A Historical Colossus.pdf
The Roman Empire A Historical Colossus.pdf
kaushalkr1407
 
BÀI TẬP BỔ TRỢ TIẾNG ANH GLOBAL SUCCESS LỚP 3 - CẢ NĂM (CÓ FILE NGHE VÀ ĐÁP Á...
BÀI TẬP BỔ TRỢ TIẾNG ANH GLOBAL SUCCESS LỚP 3 - CẢ NĂM (CÓ FILE NGHE VÀ ĐÁP Á...BÀI TẬP BỔ TRỢ TIẾNG ANH GLOBAL SUCCESS LỚP 3 - CẢ NĂM (CÓ FILE NGHE VÀ ĐÁP Á...
BÀI TẬP BỔ TRỢ TIẾNG ANH GLOBAL SUCCESS LỚP 3 - CẢ NĂM (CÓ FILE NGHE VÀ ĐÁP Á...
Nguyen Thanh Tu Collection
 
A Strategic Approach: GenAI in Education
A Strategic Approach: GenAI in EducationA Strategic Approach: GenAI in Education
A Strategic Approach: GenAI in Education
Peter Windle
 
Guidance_and_Counselling.pdf B.Ed. 4th Semester
Guidance_and_Counselling.pdf B.Ed. 4th SemesterGuidance_and_Counselling.pdf B.Ed. 4th Semester
Guidance_and_Counselling.pdf B.Ed. 4th Semester
Atul Kumar Singh
 
Welcome to TechSoup New Member Orientation and Q&A (May 2024).pdf
Welcome to TechSoup   New Member Orientation and Q&A (May 2024).pdfWelcome to TechSoup   New Member Orientation and Q&A (May 2024).pdf
Welcome to TechSoup New Member Orientation and Q&A (May 2024).pdf
TechSoup
 
Embracing GenAI - A Strategic Imperative
Embracing GenAI - A Strategic ImperativeEmbracing GenAI - A Strategic Imperative
Embracing GenAI - A Strategic Imperative
Peter Windle
 
How libraries can support authors with open access requirements for UKRI fund...
How libraries can support authors with open access requirements for UKRI fund...How libraries can support authors with open access requirements for UKRI fund...
How libraries can support authors with open access requirements for UKRI fund...
Jisc
 
2024.06.01 Introducing a competency framework for languag learning materials ...
2024.06.01 Introducing a competency framework for languag learning materials ...2024.06.01 Introducing a competency framework for languag learning materials ...
2024.06.01 Introducing a competency framework for languag learning materials ...
Sandy Millin
 
Introduction to AI for Nonprofits with Tapp Network
Introduction to AI for Nonprofits with Tapp NetworkIntroduction to AI for Nonprofits with Tapp Network
Introduction to AI for Nonprofits with Tapp Network
TechSoup
 
June 3, 2024 Anti-Semitism Letter Sent to MIT President Kornbluth and MIT Cor...
June 3, 2024 Anti-Semitism Letter Sent to MIT President Kornbluth and MIT Cor...June 3, 2024 Anti-Semitism Letter Sent to MIT President Kornbluth and MIT Cor...
June 3, 2024 Anti-Semitism Letter Sent to MIT President Kornbluth and MIT Cor...
Levi Shapiro
 
Francesca Gottschalk - How can education support child empowerment.pptx
Francesca Gottschalk - How can education support child empowerment.pptxFrancesca Gottschalk - How can education support child empowerment.pptx
Francesca Gottschalk - How can education support child empowerment.pptx
EduSkills OECD
 
Supporting (UKRI) OA monographs at Salford.pptx
Supporting (UKRI) OA monographs at Salford.pptxSupporting (UKRI) OA monographs at Salford.pptx
Supporting (UKRI) OA monographs at Salford.pptx
Jisc
 
The Accursed House by Émile Gaboriau.pptx
The Accursed House by Émile Gaboriau.pptxThe Accursed House by Émile Gaboriau.pptx
The Accursed House by Émile Gaboriau.pptx
DhatriParmar
 
"Protectable subject matters, Protection in biotechnology, Protection of othe...
"Protectable subject matters, Protection in biotechnology, Protection of othe..."Protectable subject matters, Protection in biotechnology, Protection of othe...
"Protectable subject matters, Protection in biotechnology, Protection of othe...
SACHIN R KONDAGURI
 
678020731-Sumas-y-Restas-Para-Colorear.pdf
678020731-Sumas-y-Restas-Para-Colorear.pdf678020731-Sumas-y-Restas-Para-Colorear.pdf
678020731-Sumas-y-Restas-Para-Colorear.pdf
CarlosHernanMontoyab2
 
The basics of sentences session 5pptx.pptx
The basics of sentences session 5pptx.pptxThe basics of sentences session 5pptx.pptx
The basics of sentences session 5pptx.pptx
heathfieldcps1
 
CLASS 11 CBSE B.St Project AIDS TO TRADE - INSURANCE
CLASS 11 CBSE B.St Project AIDS TO TRADE - INSURANCECLASS 11 CBSE B.St Project AIDS TO TRADE - INSURANCE
CLASS 11 CBSE B.St Project AIDS TO TRADE - INSURANCE
BhavyaRajput3
 
The geography of Taylor Swift - some ideas
The geography of Taylor Swift - some ideasThe geography of Taylor Swift - some ideas
The geography of Taylor Swift - some ideas
GeoBlogs
 
Acetabularia Information For Class 9 .docx
Acetabularia Information For Class 9  .docxAcetabularia Information For Class 9  .docx
Acetabularia Information For Class 9 .docx
vaibhavrinwa19
 
Thesis Statement for students diagnonsed withADHD.ppt
Thesis Statement for students diagnonsed withADHD.pptThesis Statement for students diagnonsed withADHD.ppt
Thesis Statement for students diagnonsed withADHD.ppt
EverAndrsGuerraGuerr
 

Recently uploaded (20)

The Roman Empire A Historical Colossus.pdf
The Roman Empire A Historical Colossus.pdfThe Roman Empire A Historical Colossus.pdf
The Roman Empire A Historical Colossus.pdf
 
BÀI TẬP BỔ TRỢ TIẾNG ANH GLOBAL SUCCESS LỚP 3 - CẢ NĂM (CÓ FILE NGHE VÀ ĐÁP Á...
BÀI TẬP BỔ TRỢ TIẾNG ANH GLOBAL SUCCESS LỚP 3 - CẢ NĂM (CÓ FILE NGHE VÀ ĐÁP Á...BÀI TẬP BỔ TRỢ TIẾNG ANH GLOBAL SUCCESS LỚP 3 - CẢ NĂM (CÓ FILE NGHE VÀ ĐÁP Á...
BÀI TẬP BỔ TRỢ TIẾNG ANH GLOBAL SUCCESS LỚP 3 - CẢ NĂM (CÓ FILE NGHE VÀ ĐÁP Á...
 
A Strategic Approach: GenAI in Education
A Strategic Approach: GenAI in EducationA Strategic Approach: GenAI in Education
A Strategic Approach: GenAI in Education
 
Guidance_and_Counselling.pdf B.Ed. 4th Semester
Guidance_and_Counselling.pdf B.Ed. 4th SemesterGuidance_and_Counselling.pdf B.Ed. 4th Semester
Guidance_and_Counselling.pdf B.Ed. 4th Semester
 
Welcome to TechSoup New Member Orientation and Q&A (May 2024).pdf
Welcome to TechSoup   New Member Orientation and Q&A (May 2024).pdfWelcome to TechSoup   New Member Orientation and Q&A (May 2024).pdf
Welcome to TechSoup New Member Orientation and Q&A (May 2024).pdf
 
Embracing GenAI - A Strategic Imperative
Embracing GenAI - A Strategic ImperativeEmbracing GenAI - A Strategic Imperative
Embracing GenAI - A Strategic Imperative
 
How libraries can support authors with open access requirements for UKRI fund...
How libraries can support authors with open access requirements for UKRI fund...How libraries can support authors with open access requirements for UKRI fund...
How libraries can support authors with open access requirements for UKRI fund...
 
2024.06.01 Introducing a competency framework for languag learning materials ...
2024.06.01 Introducing a competency framework for languag learning materials ...2024.06.01 Introducing a competency framework for languag learning materials ...
2024.06.01 Introducing a competency framework for languag learning materials ...
 
Introduction to AI for Nonprofits with Tapp Network
Introduction to AI for Nonprofits with Tapp NetworkIntroduction to AI for Nonprofits with Tapp Network
Introduction to AI for Nonprofits with Tapp Network
 
June 3, 2024 Anti-Semitism Letter Sent to MIT President Kornbluth and MIT Cor...
June 3, 2024 Anti-Semitism Letter Sent to MIT President Kornbluth and MIT Cor...June 3, 2024 Anti-Semitism Letter Sent to MIT President Kornbluth and MIT Cor...
June 3, 2024 Anti-Semitism Letter Sent to MIT President Kornbluth and MIT Cor...
 
Francesca Gottschalk - How can education support child empowerment.pptx
Francesca Gottschalk - How can education support child empowerment.pptxFrancesca Gottschalk - How can education support child empowerment.pptx
Francesca Gottschalk - How can education support child empowerment.pptx
 
Supporting (UKRI) OA monographs at Salford.pptx
Supporting (UKRI) OA monographs at Salford.pptxSupporting (UKRI) OA monographs at Salford.pptx
Supporting (UKRI) OA monographs at Salford.pptx
 
The Accursed House by Émile Gaboriau.pptx
The Accursed House by Émile Gaboriau.pptxThe Accursed House by Émile Gaboriau.pptx
The Accursed House by Émile Gaboriau.pptx
 
"Protectable subject matters, Protection in biotechnology, Protection of othe...
"Protectable subject matters, Protection in biotechnology, Protection of othe..."Protectable subject matters, Protection in biotechnology, Protection of othe...
"Protectable subject matters, Protection in biotechnology, Protection of othe...
 
678020731-Sumas-y-Restas-Para-Colorear.pdf
678020731-Sumas-y-Restas-Para-Colorear.pdf678020731-Sumas-y-Restas-Para-Colorear.pdf
678020731-Sumas-y-Restas-Para-Colorear.pdf
 
The basics of sentences session 5pptx.pptx
The basics of sentences session 5pptx.pptxThe basics of sentences session 5pptx.pptx
The basics of sentences session 5pptx.pptx
 
CLASS 11 CBSE B.St Project AIDS TO TRADE - INSURANCE
CLASS 11 CBSE B.St Project AIDS TO TRADE - INSURANCECLASS 11 CBSE B.St Project AIDS TO TRADE - INSURANCE
CLASS 11 CBSE B.St Project AIDS TO TRADE - INSURANCE
 
The geography of Taylor Swift - some ideas
The geography of Taylor Swift - some ideasThe geography of Taylor Swift - some ideas
The geography of Taylor Swift - some ideas
 
Acetabularia Information For Class 9 .docx
Acetabularia Information For Class 9  .docxAcetabularia Information For Class 9  .docx
Acetabularia Information For Class 9 .docx
 
Thesis Statement for students diagnonsed withADHD.ppt
Thesis Statement for students diagnonsed withADHD.pptThesis Statement for students diagnonsed withADHD.ppt
Thesis Statement for students diagnonsed withADHD.ppt
 

2.2 Histograms

  • 1. Elementary Statistics Chapter 2: Exploring Data with Tables and Graphs 2.2 Histograms 1
  • 2. Chapter 2: Exploring Data with Tables and Graphs 2.1 Frequency Distributions for Organizing and Summarizing Data 2.2 Histograms 2.3 Graphs that Enlighten and Graphs that Deceive 2.4 Scatterplots, Correlation, and Regression 2 Objectives: 1. Organize data using a frequency distribution. 2. Represent data in frequency distributions graphically using histograms, frequency polygons, and ogives. 3. Represent data using bar graphs, Pareto charts, time series graphs, and pie graphs. 4. Draw and interpret a stem and leaf plot. 5. Draw and interpret a scatter plot for a set of paired data.
  • 3. Recall : 2.1 Frequency Distributions for Organizing and Summarizing Data Data collected in original form is called raw data. Frequency Distribution (or Frequency Table) A frequency distribution is the organization of raw data in table form, using classes and frequencies. It Shows how data are partitioned among several categories (or classes) by listing the categories along with the number (frequency) of data values in each of them. Nominal- or ordinal-level data that can be placed in categories is organized in categorical frequency distributions. Lower class limits: The smallest numbers that can belong to each of the different classes Upper class limits: The largest numbers that can belong to each of the different classes Class boundaries: The numbers used to separate the classes, but without the gaps created by class limits Class midpoints: The values in the middle of the classes Each class midpoint can be found by adding the lower class limit to the upper class limit and dividing the sum by 2. Class width: The difference between two consecutive lower class limits in a frequency distribution Procedure for Constructing a Frequency Distribution 1. Select the number of classes, usually between 5 and 20. 2. Calculate the class width: 𝑊 = 𝑀𝑎𝑥−𝑀𝑖𝑛 # 𝑜𝑓 𝑐𝑙𝑎𝑠𝑠𝑒𝑠 and round up accordingly. 3. Choose the value for the first lower class limit by using either the minimum value or a convenient value below the minimum. 4. Using the first lower class limit and class width, list the other lower class limits. 5. List the lower class limits in a vertical column and then determine and enter the upper class limits. 6. Take each individual data value and put a tally mark in the appropriate class. Add the tally marks to get the frequency. 3
  • 4. 2.2 Histograms While a frequency distribution is a useful tool for summarizing data and investigating the distribution of data, an even better tool is a histogram, which is a graph that is easier to interpret than a table of numbers. Key Concept Histogram: A graph consisting of bars of equal width drawn adjacent to each other (unless there are gaps in the data) The horizontal scale represents classes of quantitative data values, and the vertical scale represents frequencies. The heights of the bars correspond to frequency values. Important Uses of a Histogram • Visually displays the shape of the distribution of the data • Shows the location of the center of the data • Shows the spread of the data & Identifies outliers 4
  • 5. 5 Example 1 Construct a histogram to represent the data for the record high temperatures for each of the 50 states. Class Limits Class Boundaries Frequency 100 - 104 105 - 109 110 - 114 115 - 119 120 - 124 125 - 129 130 - 134 99.5 - 104.5 104.5 - 109.5 109.5 - 114.5 114.5 - 119.5 119.5 - 124.5 124.5 - 129.5 129.5 - 134.5 2 8 18 13 7 1 1
  • 6. Relative Frequency Histogram Relative Frequency Histogram has the same shape and horizontal scale as a histogram, but the vertical scale is marked with relative frequencies instead of actual frequencies. Time (seconds) Frequency 75-124 11 125-174 24 175-224 10 225-274 3 275-324 2 Example 2 Relative Frequency = f / n 11 / 50 = 0.22 24 / 50 = 0.48 10 / 50 = 0.2 3 / 50 = 0.06 2 / 50 = 0.04 Percent Frequency 22% 24% 20% 6% 4% 6 f = 50 rf = 1
  • 7. Common Distribution Shapes 7 Critical Thinking Interpreting Histograms Explore the data by analyzing the histogram to see what can be learned about “CVDOT”: the Center of the data, the Variation, the shape of the Distribution, whether there are any Outliers, and Time.
  • 8. Normal Distribution Because this histogram is roughly bell-shaped, we say that the data have a normal distribution. 8 Skewness: A distribution of data is skewed if it is not symmetric and extends more to one side than to the other. Data skewed to the right (positively skewed) have a longer right tail. Data skewed to the left (negative skewed) have a longer left tail.
  • 9. 9 Example 3 Given Histogram: Find the following: 1. Estimate the number of subjects 2. The width 3. Boundaries of the 1st bar 4. Explain the gap. 5. Normal? Find the following: 1. The number of subjects 12 + 20 + 8 + 0 + 0 + 5 + 18 + 14 + 3 = 80 2. The width; 5.6 – 5.5 = 0.1 g 3. Boundaries of the 1st bar: 5.5g & 5.6g 4. The Gap: The 1st 40 quarters are from a different era than the 2nd set of 40 quarters. 5. Not Normally Distribution Pre 1964: 90% silver + 10 % copper Post 1964: Copper-Nickel alloy
  • 10. Assessing Normality with Normal Quantile Plots Criteria for Assessing Normality with a Normal Quantile Plot Normal Distribution: The pattern of the points in the normal quantile plot is reasonably close to a straight line, and the points do not show some systematic pattern that is not a straight-line pattern. Not a Normal Distribution: The population distribution is not normal if the normal quantile plot has either or both of these two conditions:  The points do not lie reasonably close to a straight-line pattern.  The points show some systematic pattern that is not a straight-line pattern. 10 Normal Distribution: The points are reasonably close to a straight-line pattern, and there is no other systematic pattern that is not a straight-line pattern. Not a Normal Distribution: The points do not lie reasonably close to a straight line. Normal Quantile Plot: A normal quantile plot (or normal probability plot) is a graph of points (x, y) where each x value is from the original set of sample data, and each y value is the corresponding z score that is expected from the standard normal distribution.