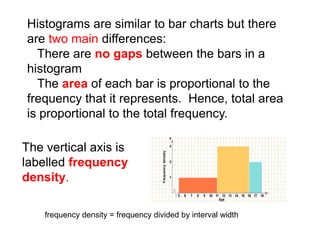
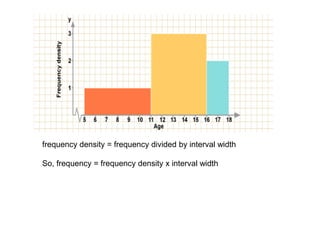
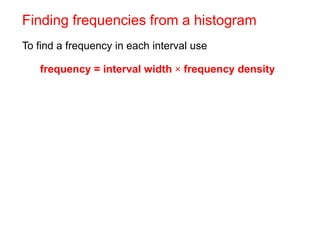
1. The document describes histograms and how to construct them from frequency data by calculating frequency densities.
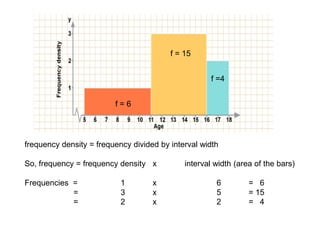
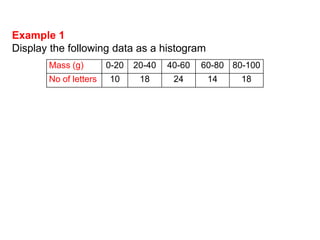
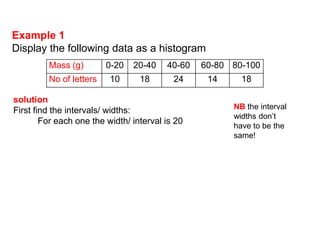
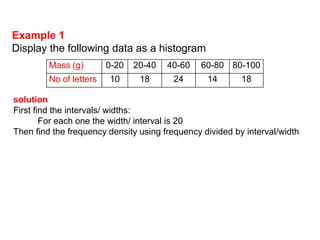
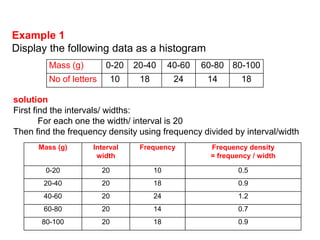
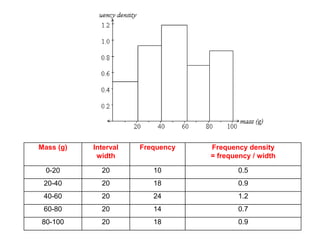
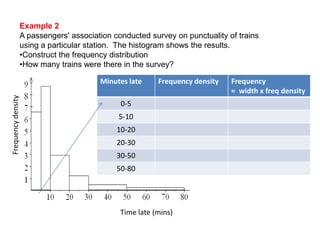
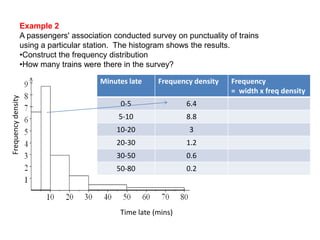
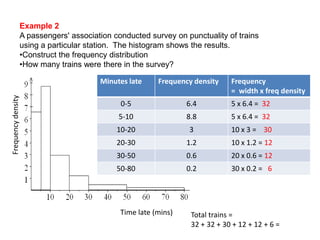
2. An example shows how to construct a histogram from a frequency table by dividing frequencies by interval widths to obtain frequency densities.
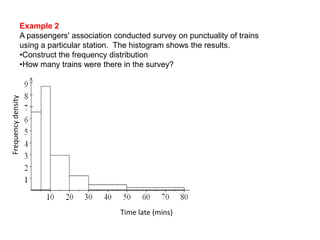
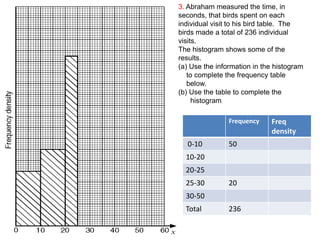
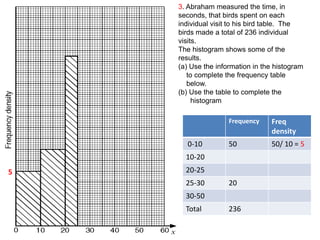
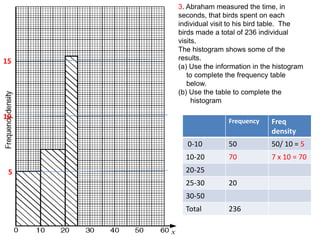
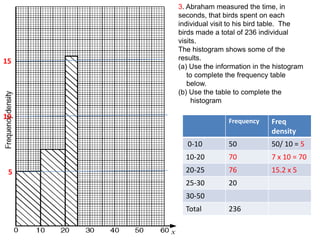
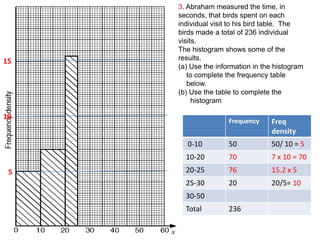
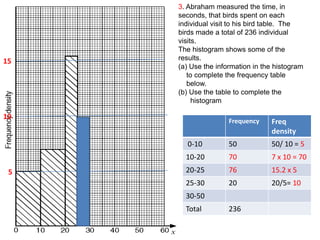
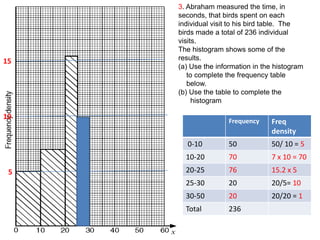
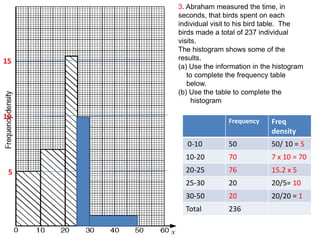
3. Another example constructs a frequency table from a histogram and calculates the total number of observations.