SlideShare a Scribd company logo
1 of 12
FREQUENCY DISTRIBUTION
Presented by
AISHWARYA PT
INTRODUCTION
• In statistics, a frequency distribution is a table that displays the
frequency of various outcomes in a sample. Each entry in the table
contains the frequency or count of the occurrences of values within
a particular group or interval, and in this way, the table summarizes
the distribution of values in the sample.
• A frequency distribution shows us a summarized grouping of data
divided into mutually exclusive classes and the number of
occurrences in a class. It is a way of showing unorganized data.
e.g. to show results of an election, income of people for a certain
region, sales of a product within a certain period, student loan
amounts of graduates, etc. Some of the graphs that can be used with
frequency distributions are histograms, line charts, bar charts and pie
charts. Frequency distributions are used for both qualitative and
quantitative data.
2
3
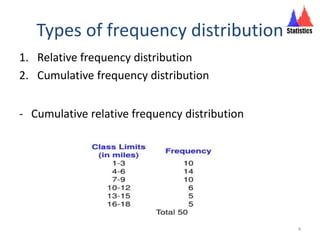
Types of frequency distribution
1. Relative frequency distribution
2. Cumulative frequency distribution
- Cumulative relative frequency distribution
4
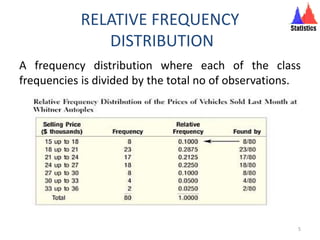
RELATIVE FREQUENCY
DISTRIBUTION
A frequency distribution where each of the class
frequencies is divided by the total no of observations.
5
CUMULATIVE FREQUENCY
DISTRIBUTION
Technically, a cumulative frequency distribution is the
sum of the class and all classes below it in a frequency
distribution. All that means is you’re adding up a value
and all of the values that came before it.
6
CUMMULATIVE RELATIVE
FREQUENCY DISTRIBUTION
• Cumulative relative frequency is a statistical
calculation figured by adding together previously
tabulated relative frequencies that makes a running
total along a frequency table.
• The relationship between cumulative frequency and
relative cumulative frequency is given by;
7
GRAPHIC PRESENTATIONS OF
FREQUENCY DISTRIBUTION
1. Histograms
2. Polygons
3. Cumulative
frequency
distribution
8
STEPS TO A PROBLEM
PET TYPE COUNT
Dog 16
Cat 28
Fish 8
Others 4
Total 56
Step 1: Make a table with the category names
and counts.
Step 2: Add a second column called “relative
frequency”.
PET TYPE COUNT REL FREQ
Dog 16 0.28
Cat 28 0.50
Fish 8 0.14
Others 4 0.07
Total 56 1
9
To find the cumulative relative frequency, follow the steps
above to create a relative frequency distribution table. As a final
step, add up the relative frequencies in another column.
PET TYPE COUNT REL FREQ CRel FREQ
Dog 16 0.29 0.28
Cat 28 0.50 0.79
Fish 8 0.14 0.93
Others 4 0.07 1
Total 56 1
10
ADVANTAGES AND LIMITATIONS OF
FREQUENCY DISTRIBUTION
Condense and summarize large amounts of data
in a useful format.
Describe all variable types.
Facilitate graphic presentation of data.
Begin to identify population characteristics.
Permit cautious comparison of data sets.
There are a few methods can used in formulating
class intervals: “from 5-10” or “Over 55” & “less
than 30”.
11
THANK YOU

More Related Content

What's hot

Type i and type ii errors
Type i and type ii errorsType i and type ii errors
Type i and type ii errorsp24ssp
 
Measures of dispersion
Measures of dispersionMeasures of dispersion
Measures of dispersionJagdish Powar
 
Measures of central tendency
Measures of central tendencyMeasures of central tendency
Measures of central tendencyAlex Chris
 
Measure OF Central Tendency
Measure OF Central TendencyMeasure OF Central Tendency
Measure OF Central TendencyIqrabutt038
 
Analysis and interpretation of data
Analysis and interpretation of dataAnalysis and interpretation of data
Analysis and interpretation of datateppxcrown98
 
Bar Diagram (chart) in Statistics presentation
Bar Diagram (chart) in Statistics presentationBar Diagram (chart) in Statistics presentation
Bar Diagram (chart) in Statistics presentationsheiblu
 
coefficient correlation
 coefficient correlation coefficient correlation
coefficient correlationirshad narejo
 
Introduction to kurtosis
Introduction to kurtosisIntroduction to kurtosis
Introduction to kurtosisAmba Datt Pant
 
Types of graphs
Types of graphsTypes of graphs
Types of graphsLALIT BIST
 
Mean, Median, Mode: Measures of Central Tendency
Mean, Median, Mode: Measures of Central Tendency Mean, Median, Mode: Measures of Central Tendency
Mean, Median, Mode: Measures of Central Tendency Jan Nah
 

What's hot (20)

Type i and type ii errors
Type i and type ii errorsType i and type ii errors
Type i and type ii errors
 
Histogram
HistogramHistogram
Histogram
 
Measures of dispersion
Measures of dispersionMeasures of dispersion
Measures of dispersion
 
Measures of central tendency
Measures of central tendencyMeasures of central tendency
Measures of central tendency
 
Measure OF Central Tendency
Measure OF Central TendencyMeasure OF Central Tendency
Measure OF Central Tendency
 
Analysis and interpretation of data
Analysis and interpretation of dataAnalysis and interpretation of data
Analysis and interpretation of data
 
Bar Diagram (chart) in Statistics presentation
Bar Diagram (chart) in Statistics presentationBar Diagram (chart) in Statistics presentation
Bar Diagram (chart) in Statistics presentation
 
Standard deviation
Standard deviationStandard deviation
Standard deviation
 
Frequency Distributions
Frequency DistributionsFrequency Distributions
Frequency Distributions
 
Median
MedianMedian
Median
 
Correlation
CorrelationCorrelation
Correlation
 
coefficient correlation
 coefficient correlation coefficient correlation
coefficient correlation
 
Introduction to kurtosis
Introduction to kurtosisIntroduction to kurtosis
Introduction to kurtosis
 
Sampling and its types
Sampling and its typesSampling and its types
Sampling and its types
 
Tabulation of data
Tabulation of dataTabulation of data
Tabulation of data
 
Types of graphs
Types of graphsTypes of graphs
Types of graphs
 
Statistics
StatisticsStatistics
Statistics
 
Frequency distribution
Frequency distributionFrequency distribution
Frequency distribution
 
Normal distribution
Normal distributionNormal distribution
Normal distribution
 
Mean, Median, Mode: Measures of Central Tendency
Mean, Median, Mode: Measures of Central Tendency Mean, Median, Mode: Measures of Central Tendency
Mean, Median, Mode: Measures of Central Tendency
 

Viewers also liked

frequency distribution table
frequency distribution tablefrequency distribution table
frequency distribution tableMonie Ali
 
Chapter 2: Frequency Distribution and Graphs
Chapter 2: Frequency Distribution and GraphsChapter 2: Frequency Distribution and Graphs
Chapter 2: Frequency Distribution and GraphsMong Mara
 
Presentation of Data and Frequency Distribution
Presentation of Data and Frequency DistributionPresentation of Data and Frequency Distribution
Presentation of Data and Frequency DistributionElain Cruz
 
PDU 207 Basic Statistics: Frequency Distribution
PDU 207 Basic Statistics: Frequency DistributionPDU 207 Basic Statistics: Frequency Distribution
PDU 207 Basic Statistics: Frequency DistributionAgatha N. Ardhiati
 
Frequency distributions
Frequency distributionsFrequency distributions
Frequency distributionsMark McGinley
 
Frequency Distributions and Graphs
Frequency Distributions and GraphsFrequency Distributions and Graphs
Frequency Distributions and Graphsmonritche
 
Frequency Tables, Frequency Distributions, and Graphic Presentation
Frequency Tables, Frequency Distributions, and Graphic PresentationFrequency Tables, Frequency Distributions, and Graphic Presentation
Frequency Tables, Frequency Distributions, and Graphic PresentationConflagratioNal Jahid
 
Report frequency distribution table
Report frequency distribution tableReport frequency distribution table
Report frequency distribution tableMaTeresa Berondo
 
frequency distribution & graphs
frequency distribution & graphsfrequency distribution & graphs
frequency distribution & graphsTirtha_Nil
 
2.1 Part 1 - Frequency Distributions
2.1 Part 1 - Frequency Distributions2.1 Part 1 - Frequency Distributions
2.1 Part 1 - Frequency Distributionsleblance
 
FREQUENCY DISTRIBUTION ( distribusi frekuensi) - STATISTICS
FREQUENCY DISTRIBUTION ( distribusi frekuensi) - STATISTICSFREQUENCY DISTRIBUTION ( distribusi frekuensi) - STATISTICS
FREQUENCY DISTRIBUTION ( distribusi frekuensi) - STATISTICSAirlangga University , Indonesia
 
Data array and frequency distribution
Data array and frequency distributionData array and frequency distribution
Data array and frequency distributionraboz
 
Frequency Distributions
Frequency DistributionsFrequency Distributions
Frequency Distributionsjasondroesch
 
Measures of central tendency
Measures of central tendencyMeasures of central tendency
Measures of central tendencyChie Pegollo
 
Exercise 7: Frequency Distribution
Exercise 7: Frequency DistributionExercise 7: Frequency Distribution
Exercise 7: Frequency DistributionAndrilyn Alcantara
 
Introduction to Statistics presentation
Introduction to Statistics presentationIntroduction to Statistics presentation
Introduction to Statistics presentationfazli khaliq
 

Viewers also liked (20)

frequency distribution table
frequency distribution tablefrequency distribution table
frequency distribution table
 
Chapter 2: Frequency Distribution and Graphs
Chapter 2: Frequency Distribution and GraphsChapter 2: Frequency Distribution and Graphs
Chapter 2: Frequency Distribution and Graphs
 
Presentation of Data and Frequency Distribution
Presentation of Data and Frequency DistributionPresentation of Data and Frequency Distribution
Presentation of Data and Frequency Distribution
 
PDU 207 Basic Statistics: Frequency Distribution
PDU 207 Basic Statistics: Frequency DistributionPDU 207 Basic Statistics: Frequency Distribution
PDU 207 Basic Statistics: Frequency Distribution
 
Frequency distributions
Frequency distributionsFrequency distributions
Frequency distributions
 
Frequency Distributions and Graphs
Frequency Distributions and GraphsFrequency Distributions and Graphs
Frequency Distributions and Graphs
 
Frequency distribution
Frequency distributionFrequency distribution
Frequency distribution
 
Frequency Tables, Frequency Distributions, and Graphic Presentation
Frequency Tables, Frequency Distributions, and Graphic PresentationFrequency Tables, Frequency Distributions, and Graphic Presentation
Frequency Tables, Frequency Distributions, and Graphic Presentation
 
Report frequency distribution table
Report frequency distribution tableReport frequency distribution table
Report frequency distribution table
 
frequency distribution & graphs
frequency distribution & graphsfrequency distribution & graphs
frequency distribution & graphs
 
2.1 Part 1 - Frequency Distributions
2.1 Part 1 - Frequency Distributions2.1 Part 1 - Frequency Distributions
2.1 Part 1 - Frequency Distributions
 
FREQUENCY DISTRIBUTION ( distribusi frekuensi) - STATISTICS
FREQUENCY DISTRIBUTION ( distribusi frekuensi) - STATISTICSFREQUENCY DISTRIBUTION ( distribusi frekuensi) - STATISTICS
FREQUENCY DISTRIBUTION ( distribusi frekuensi) - STATISTICS
 
Data array and frequency distribution
Data array and frequency distributionData array and frequency distribution
Data array and frequency distribution
 
Frequency distribution
Frequency distributionFrequency distribution
Frequency distribution
 
Frequency Distributions
Frequency DistributionsFrequency Distributions
Frequency Distributions
 
Frequency distribution
Frequency distributionFrequency distribution
Frequency distribution
 
Measures of central tendency
Measures of central tendencyMeasures of central tendency
Measures of central tendency
 
Exercise 7: Frequency Distribution
Exercise 7: Frequency DistributionExercise 7: Frequency Distribution
Exercise 7: Frequency Distribution
 
Displaying data
Displaying dataDisplaying data
Displaying data
 
Introduction to Statistics presentation
Introduction to Statistics presentationIntroduction to Statistics presentation
Introduction to Statistics presentation
 

Similar to Frequency distribution

Introduction to Inferential Statistics.pptx
Introduction to Inferential  Statistics.pptxIntroduction to Inferential  Statistics.pptx
Introduction to Inferential Statistics.pptxTAVITI NAIDU GONGADA
 
Chapter 02
Chapter 02Chapter 02
Chapter 02conalep
 
Ch1 The Nature of Statistics
Ch1 The Nature of StatisticsCh1 The Nature of Statistics
Ch1 The Nature of StatisticsFarhan Alfin
 
Chapter-2-Frequency-Distribution-and-Graphical-Presentation.pptx
Chapter-2-Frequency-Distribution-and-Graphical-Presentation.pptxChapter-2-Frequency-Distribution-and-Graphical-Presentation.pptx
Chapter-2-Frequency-Distribution-and-Graphical-Presentation.pptxLaurenceBernardBalbi1
 
lesson-data-presentation-tools-1.pptx
lesson-data-presentation-tools-1.pptxlesson-data-presentation-tools-1.pptx
lesson-data-presentation-tools-1.pptxAnalynPasto
 
Chapter 02 mis
Chapter 02 misChapter 02 mis
Chapter 02 misRong Mohol
 
Statistics slides..pptx
Statistics slides..pptxStatistics slides..pptx
Statistics slides..pptxSmnRaja2
 
Chapter 02
Chapter 02Chapter 02
Chapter 02bmcfad01
 
Unit 11. Interepreting the Research Findings.pptx
Unit 11. Interepreting the Research Findings.pptxUnit 11. Interepreting the Research Findings.pptx
Unit 11. Interepreting the Research Findings.pptxshakirRahman10
 
FREQUENCY DISTRIBUTION.pptx
FREQUENCY DISTRIBUTION.pptxFREQUENCY DISTRIBUTION.pptx
FREQUENCY DISTRIBUTION.pptxSreeLatha98
 
chapter2 research paper in mathematics.ppt
chapter2 research paper in mathematics.pptchapter2 research paper in mathematics.ppt
chapter2 research paper in mathematics.pptKyMarieCabilesSedico
 
Data Presentation Methods.pptx
Data Presentation Methods.pptxData Presentation Methods.pptx
Data Presentation Methods.pptxjacob735118
 
2. Descriptive Statistics.pdf
2. Descriptive Statistics.pdf2. Descriptive Statistics.pdf
2. Descriptive Statistics.pdfYomifDeksisaHerpa
 
Methods of data presentation.pptx
Methods of data presentation.pptxMethods of data presentation.pptx
Methods of data presentation.pptxssuserbd4d1e
 
Group-4-Report-Frequency-Distribution.ppt
Group-4-Report-Frequency-Distribution.pptGroup-4-Report-Frequency-Distribution.ppt
Group-4-Report-Frequency-Distribution.pptNectorMoradaRapsingB
 
Chapter 02 (1).pdf
Chapter 02 (1).pdfChapter 02 (1).pdf
Chapter 02 (1).pdfnanifaiz
 
Frequency Distribution
Frequency DistributionFrequency Distribution
Frequency DistributionTeacherMariza
 
RMBS M1 Lecture 1a.pptx
RMBS M1 Lecture 1a.pptxRMBS M1 Lecture 1a.pptx
RMBS M1 Lecture 1a.pptxWaqar Awan
 

Similar to Frequency distribution (20)

Introduction to Inferential Statistics.pptx
Introduction to Inferential  Statistics.pptxIntroduction to Inferential  Statistics.pptx
Introduction to Inferential Statistics.pptx
 
Chapter 02
Chapter 02Chapter 02
Chapter 02
 
Ch1 The Nature of Statistics
Ch1 The Nature of StatisticsCh1 The Nature of Statistics
Ch1 The Nature of Statistics
 
Chapter-2-Frequency-Distribution-and-Graphical-Presentation.pptx
Chapter-2-Frequency-Distribution-and-Graphical-Presentation.pptxChapter-2-Frequency-Distribution-and-Graphical-Presentation.pptx
Chapter-2-Frequency-Distribution-and-Graphical-Presentation.pptx
 
day two.pptx
day two.pptxday two.pptx
day two.pptx
 
lesson-data-presentation-tools-1.pptx
lesson-data-presentation-tools-1.pptxlesson-data-presentation-tools-1.pptx
lesson-data-presentation-tools-1.pptx
 
Chapter 02 mis
Chapter 02 misChapter 02 mis
Chapter 02 mis
 
Statistics slides..pptx
Statistics slides..pptxStatistics slides..pptx
Statistics slides..pptx
 
Chapter 02
Chapter 02Chapter 02
Chapter 02
 
Unit 11. Interepreting the Research Findings.pptx
Unit 11. Interepreting the Research Findings.pptxUnit 11. Interepreting the Research Findings.pptx
Unit 11. Interepreting the Research Findings.pptx
 
FREQUENCY DISTRIBUTION.pptx
FREQUENCY DISTRIBUTION.pptxFREQUENCY DISTRIBUTION.pptx
FREQUENCY DISTRIBUTION.pptx
 
chapter2.ppt
chapter2.pptchapter2.ppt
chapter2.ppt
 
chapter2 research paper in mathematics.ppt
chapter2 research paper in mathematics.pptchapter2 research paper in mathematics.ppt
chapter2 research paper in mathematics.ppt
 
Data Presentation Methods.pptx
Data Presentation Methods.pptxData Presentation Methods.pptx
Data Presentation Methods.pptx
 
2. Descriptive Statistics.pdf
2. Descriptive Statistics.pdf2. Descriptive Statistics.pdf
2. Descriptive Statistics.pdf
 
Methods of data presentation.pptx
Methods of data presentation.pptxMethods of data presentation.pptx
Methods of data presentation.pptx
 
Group-4-Report-Frequency-Distribution.ppt
Group-4-Report-Frequency-Distribution.pptGroup-4-Report-Frequency-Distribution.ppt
Group-4-Report-Frequency-Distribution.ppt
 
Chapter 02 (1).pdf
Chapter 02 (1).pdfChapter 02 (1).pdf
Chapter 02 (1).pdf
 
Frequency Distribution
Frequency DistributionFrequency Distribution
Frequency Distribution
 
RMBS M1 Lecture 1a.pptx
RMBS M1 Lecture 1a.pptxRMBS M1 Lecture 1a.pptx
RMBS M1 Lecture 1a.pptx
 

Recently uploaded

Call Girls in Defence Colony Delhi 💯Call Us 🔝8264348440🔝
Call Girls in Defence Colony Delhi 💯Call Us 🔝8264348440🔝Call Girls in Defence Colony Delhi 💯Call Us 🔝8264348440🔝
Call Girls in Defence Colony Delhi 💯Call Us 🔝8264348440🔝soniya singh
 
dokumen.tips_chapter-4-transient-heat-conduction-mehmet-kanoglu.ppt
dokumen.tips_chapter-4-transient-heat-conduction-mehmet-kanoglu.pptdokumen.tips_chapter-4-transient-heat-conduction-mehmet-kanoglu.ppt
dokumen.tips_chapter-4-transient-heat-conduction-mehmet-kanoglu.pptSonatrach
 
Customer Service Analytics - Make Sense of All Your Data.pptx
Customer Service Analytics - Make Sense of All Your Data.pptxCustomer Service Analytics - Make Sense of All Your Data.pptx
Customer Service Analytics - Make Sense of All Your Data.pptxEmmanuel Dauda
 
Delhi Call Girls Punjabi Bagh 9711199171 ☎✔👌✔ Whatsapp Hard And Sexy Vip Call
Delhi Call Girls Punjabi Bagh 9711199171 ☎✔👌✔ Whatsapp Hard And Sexy Vip CallDelhi Call Girls Punjabi Bagh 9711199171 ☎✔👌✔ Whatsapp Hard And Sexy Vip Call
Delhi Call Girls Punjabi Bagh 9711199171 ☎✔👌✔ Whatsapp Hard And Sexy Vip Callshivangimorya083
 
Call Girls In Mahipalpur O9654467111 Escorts Service
Call Girls In Mahipalpur O9654467111  Escorts ServiceCall Girls In Mahipalpur O9654467111  Escorts Service
Call Girls In Mahipalpur O9654467111 Escorts ServiceSapana Sha
 
Dubai Call Girls Wifey O52&786472 Call Girls Dubai
Dubai Call Girls Wifey O52&786472 Call Girls DubaiDubai Call Girls Wifey O52&786472 Call Girls Dubai
Dubai Call Girls Wifey O52&786472 Call Girls Dubaihf8803863
 
Log Analysis using OSSEC sasoasasasas.pptx
Log Analysis using OSSEC sasoasasasas.pptxLog Analysis using OSSEC sasoasasasas.pptx
Log Analysis using OSSEC sasoasasasas.pptxJohnnyPlasten
 
Brighton SEO | April 2024 | Data Storytelling
Brighton SEO | April 2024 | Data StorytellingBrighton SEO | April 2024 | Data Storytelling
Brighton SEO | April 2024 | Data StorytellingNeil Barnes
 
{Pooja: 9892124323 } Call Girl in Mumbai | Jas Kaur Rate 4500 Free Hotel Del...
{Pooja:  9892124323 } Call Girl in Mumbai | Jas Kaur Rate 4500 Free Hotel Del...{Pooja:  9892124323 } Call Girl in Mumbai | Jas Kaur Rate 4500 Free Hotel Del...
{Pooja: 9892124323 } Call Girl in Mumbai | Jas Kaur Rate 4500 Free Hotel Del...Pooja Nehwal
 
Industrialised data - the key to AI success.pdf
Industrialised data - the key to AI success.pdfIndustrialised data - the key to AI success.pdf
Industrialised data - the key to AI success.pdfLars Albertsson
 
100-Concepts-of-AI by Anupama Kate .pptx
100-Concepts-of-AI by Anupama Kate .pptx100-Concepts-of-AI by Anupama Kate .pptx
100-Concepts-of-AI by Anupama Kate .pptxAnupama Kate
 
Kantar AI Summit- Under Embargo till Wednesday, 24th April 2024, 4 PM, IST.pdf
Kantar AI Summit- Under Embargo till Wednesday, 24th April 2024, 4 PM, IST.pdfKantar AI Summit- Under Embargo till Wednesday, 24th April 2024, 4 PM, IST.pdf
Kantar AI Summit- Under Embargo till Wednesday, 24th April 2024, 4 PM, IST.pdfSocial Samosa
 
VIP High Class Call Girls Jamshedpur Anushka 8250192130 Independent Escort Se...
VIP High Class Call Girls Jamshedpur Anushka 8250192130 Independent Escort Se...VIP High Class Call Girls Jamshedpur Anushka 8250192130 Independent Escort Se...
VIP High Class Call Girls Jamshedpur Anushka 8250192130 Independent Escort Se...Suhani Kapoor
 
04242024_CCC TUG_Joins and Relationships
04242024_CCC TUG_Joins and Relationships04242024_CCC TUG_Joins and Relationships
04242024_CCC TUG_Joins and Relationshipsccctableauusergroup
 
定制英国白金汉大学毕业证(UCB毕业证书) 成绩单原版一比一
定制英国白金汉大学毕业证(UCB毕业证书)																			成绩单原版一比一定制英国白金汉大学毕业证(UCB毕业证书)																			成绩单原版一比一
定制英国白金汉大学毕业证(UCB毕业证书) 成绩单原版一比一ffjhghh
 
High Class Call Girls Noida Sector 39 Aarushi 🔝8264348440🔝 Independent Escort...
High Class Call Girls Noida Sector 39 Aarushi 🔝8264348440🔝 Independent Escort...High Class Call Girls Noida Sector 39 Aarushi 🔝8264348440🔝 Independent Escort...
High Class Call Girls Noida Sector 39 Aarushi 🔝8264348440🔝 Independent Escort...soniya singh
 
Schema on read is obsolete. Welcome metaprogramming..pdf
Schema on read is obsolete. Welcome metaprogramming..pdfSchema on read is obsolete. Welcome metaprogramming..pdf
Schema on read is obsolete. Welcome metaprogramming..pdfLars Albertsson
 
Indian Call Girls in Abu Dhabi O5286O24O8 Call Girls in Abu Dhabi By Independ...
Indian Call Girls in Abu Dhabi O5286O24O8 Call Girls in Abu Dhabi By Independ...Indian Call Girls in Abu Dhabi O5286O24O8 Call Girls in Abu Dhabi By Independ...
Indian Call Girls in Abu Dhabi O5286O24O8 Call Girls in Abu Dhabi By Independ...dajasot375
 
Beautiful Sapna Vip Call Girls Hauz Khas 9711199012 Call /Whatsapps
Beautiful Sapna Vip  Call Girls Hauz Khas 9711199012 Call /WhatsappsBeautiful Sapna Vip  Call Girls Hauz Khas 9711199012 Call /Whatsapps
Beautiful Sapna Vip Call Girls Hauz Khas 9711199012 Call /Whatsappssapnasaifi408
 

Recently uploaded (20)

Call Girls in Defence Colony Delhi 💯Call Us 🔝8264348440🔝
Call Girls in Defence Colony Delhi 💯Call Us 🔝8264348440🔝Call Girls in Defence Colony Delhi 💯Call Us 🔝8264348440🔝
Call Girls in Defence Colony Delhi 💯Call Us 🔝8264348440🔝
 
dokumen.tips_chapter-4-transient-heat-conduction-mehmet-kanoglu.ppt
dokumen.tips_chapter-4-transient-heat-conduction-mehmet-kanoglu.pptdokumen.tips_chapter-4-transient-heat-conduction-mehmet-kanoglu.ppt
dokumen.tips_chapter-4-transient-heat-conduction-mehmet-kanoglu.ppt
 
Customer Service Analytics - Make Sense of All Your Data.pptx
Customer Service Analytics - Make Sense of All Your Data.pptxCustomer Service Analytics - Make Sense of All Your Data.pptx
Customer Service Analytics - Make Sense of All Your Data.pptx
 
Delhi Call Girls Punjabi Bagh 9711199171 ☎✔👌✔ Whatsapp Hard And Sexy Vip Call
Delhi Call Girls Punjabi Bagh 9711199171 ☎✔👌✔ Whatsapp Hard And Sexy Vip CallDelhi Call Girls Punjabi Bagh 9711199171 ☎✔👌✔ Whatsapp Hard And Sexy Vip Call
Delhi Call Girls Punjabi Bagh 9711199171 ☎✔👌✔ Whatsapp Hard And Sexy Vip Call
 
Call Girls In Mahipalpur O9654467111 Escorts Service
Call Girls In Mahipalpur O9654467111  Escorts ServiceCall Girls In Mahipalpur O9654467111  Escorts Service
Call Girls In Mahipalpur O9654467111 Escorts Service
 
Dubai Call Girls Wifey O52&786472 Call Girls Dubai
Dubai Call Girls Wifey O52&786472 Call Girls DubaiDubai Call Girls Wifey O52&786472 Call Girls Dubai
Dubai Call Girls Wifey O52&786472 Call Girls Dubai
 
Log Analysis using OSSEC sasoasasasas.pptx
Log Analysis using OSSEC sasoasasasas.pptxLog Analysis using OSSEC sasoasasasas.pptx
Log Analysis using OSSEC sasoasasasas.pptx
 
Brighton SEO | April 2024 | Data Storytelling
Brighton SEO | April 2024 | Data StorytellingBrighton SEO | April 2024 | Data Storytelling
Brighton SEO | April 2024 | Data Storytelling
 
{Pooja: 9892124323 } Call Girl in Mumbai | Jas Kaur Rate 4500 Free Hotel Del...
{Pooja:  9892124323 } Call Girl in Mumbai | Jas Kaur Rate 4500 Free Hotel Del...{Pooja:  9892124323 } Call Girl in Mumbai | Jas Kaur Rate 4500 Free Hotel Del...
{Pooja: 9892124323 } Call Girl in Mumbai | Jas Kaur Rate 4500 Free Hotel Del...
 
Industrialised data - the key to AI success.pdf
Industrialised data - the key to AI success.pdfIndustrialised data - the key to AI success.pdf
Industrialised data - the key to AI success.pdf
 
100-Concepts-of-AI by Anupama Kate .pptx
100-Concepts-of-AI by Anupama Kate .pptx100-Concepts-of-AI by Anupama Kate .pptx
100-Concepts-of-AI by Anupama Kate .pptx
 
Kantar AI Summit- Under Embargo till Wednesday, 24th April 2024, 4 PM, IST.pdf
Kantar AI Summit- Under Embargo till Wednesday, 24th April 2024, 4 PM, IST.pdfKantar AI Summit- Under Embargo till Wednesday, 24th April 2024, 4 PM, IST.pdf
Kantar AI Summit- Under Embargo till Wednesday, 24th April 2024, 4 PM, IST.pdf
 
VIP High Class Call Girls Jamshedpur Anushka 8250192130 Independent Escort Se...
VIP High Class Call Girls Jamshedpur Anushka 8250192130 Independent Escort Se...VIP High Class Call Girls Jamshedpur Anushka 8250192130 Independent Escort Se...
VIP High Class Call Girls Jamshedpur Anushka 8250192130 Independent Escort Se...
 
04242024_CCC TUG_Joins and Relationships
04242024_CCC TUG_Joins and Relationships04242024_CCC TUG_Joins and Relationships
04242024_CCC TUG_Joins and Relationships
 
定制英国白金汉大学毕业证(UCB毕业证书) 成绩单原版一比一
定制英国白金汉大学毕业证(UCB毕业证书)																			成绩单原版一比一定制英国白金汉大学毕业证(UCB毕业证书)																			成绩单原版一比一
定制英国白金汉大学毕业证(UCB毕业证书) 成绩单原版一比一
 
High Class Call Girls Noida Sector 39 Aarushi 🔝8264348440🔝 Independent Escort...
High Class Call Girls Noida Sector 39 Aarushi 🔝8264348440🔝 Independent Escort...High Class Call Girls Noida Sector 39 Aarushi 🔝8264348440🔝 Independent Escort...
High Class Call Girls Noida Sector 39 Aarushi 🔝8264348440🔝 Independent Escort...
 
E-Commerce Order PredictionShraddha Kamble.pptx
E-Commerce Order PredictionShraddha Kamble.pptxE-Commerce Order PredictionShraddha Kamble.pptx
E-Commerce Order PredictionShraddha Kamble.pptx
 
Schema on read is obsolete. Welcome metaprogramming..pdf
Schema on read is obsolete. Welcome metaprogramming..pdfSchema on read is obsolete. Welcome metaprogramming..pdf
Schema on read is obsolete. Welcome metaprogramming..pdf
 
Indian Call Girls in Abu Dhabi O5286O24O8 Call Girls in Abu Dhabi By Independ...
Indian Call Girls in Abu Dhabi O5286O24O8 Call Girls in Abu Dhabi By Independ...Indian Call Girls in Abu Dhabi O5286O24O8 Call Girls in Abu Dhabi By Independ...
Indian Call Girls in Abu Dhabi O5286O24O8 Call Girls in Abu Dhabi By Independ...
 
Beautiful Sapna Vip Call Girls Hauz Khas 9711199012 Call /Whatsapps
Beautiful Sapna Vip  Call Girls Hauz Khas 9711199012 Call /WhatsappsBeautiful Sapna Vip  Call Girls Hauz Khas 9711199012 Call /Whatsapps
Beautiful Sapna Vip Call Girls Hauz Khas 9711199012 Call /Whatsapps
 

Frequency distribution

  • 2. INTRODUCTION • In statistics, a frequency distribution is a table that displays the frequency of various outcomes in a sample. Each entry in the table contains the frequency or count of the occurrences of values within a particular group or interval, and in this way, the table summarizes the distribution of values in the sample. • A frequency distribution shows us a summarized grouping of data divided into mutually exclusive classes and the number of occurrences in a class. It is a way of showing unorganized data. e.g. to show results of an election, income of people for a certain region, sales of a product within a certain period, student loan amounts of graduates, etc. Some of the graphs that can be used with frequency distributions are histograms, line charts, bar charts and pie charts. Frequency distributions are used for both qualitative and quantitative data. 2
  • 3. 3
  • 4. Types of frequency distribution 1. Relative frequency distribution 2. Cumulative frequency distribution - Cumulative relative frequency distribution 4
  • 5. RELATIVE FREQUENCY DISTRIBUTION A frequency distribution where each of the class frequencies is divided by the total no of observations. 5
  • 6. CUMULATIVE FREQUENCY DISTRIBUTION Technically, a cumulative frequency distribution is the sum of the class and all classes below it in a frequency distribution. All that means is you’re adding up a value and all of the values that came before it. 6
  • 7. CUMMULATIVE RELATIVE FREQUENCY DISTRIBUTION • Cumulative relative frequency is a statistical calculation figured by adding together previously tabulated relative frequencies that makes a running total along a frequency table. • The relationship between cumulative frequency and relative cumulative frequency is given by; 7
  • 8. GRAPHIC PRESENTATIONS OF FREQUENCY DISTRIBUTION 1. Histograms 2. Polygons 3. Cumulative frequency distribution 8
  • 9. STEPS TO A PROBLEM PET TYPE COUNT Dog 16 Cat 28 Fish 8 Others 4 Total 56 Step 1: Make a table with the category names and counts. Step 2: Add a second column called “relative frequency”. PET TYPE COUNT REL FREQ Dog 16 0.28 Cat 28 0.50 Fish 8 0.14 Others 4 0.07 Total 56 1 9
  • 10. To find the cumulative relative frequency, follow the steps above to create a relative frequency distribution table. As a final step, add up the relative frequencies in another column. PET TYPE COUNT REL FREQ CRel FREQ Dog 16 0.29 0.28 Cat 28 0.50 0.79 Fish 8 0.14 0.93 Others 4 0.07 1 Total 56 1 10
  • 11. ADVANTAGES AND LIMITATIONS OF FREQUENCY DISTRIBUTION Condense and summarize large amounts of data in a useful format. Describe all variable types. Facilitate graphic presentation of data. Begin to identify population characteristics. Permit cautious comparison of data sets. There are a few methods can used in formulating class intervals: “from 5-10” or “Over 55” & “less than 30”. 11