Chapter 1 Introduction to Statistics 1-1 	Overview 1-2 	Types of Data 1-3 	Critical Thinking 1-4 	Design of Experiments
Created by Tom Wegleitner, Centreville, Virginia Section 1-1 Overview
Overview A common goal of surveys and other data collecting tools is to collect data from a smaller part of a larger group so we can learn something about the larger group. In this section we will look at some of ways to describe data.
Data observations (such as measurements,  genders, survey responses) that have  been  collected. Definitions
Statistics a collection of methods for planning  experiments, obtaining data, and then  then organizing, summarizing, presenting,  analyzing, interpreting, and drawing  conclusions based on the data. Definitions
Definitions Population   the complete collection of all  elements (scores, people,  measurements, and so on) to be  studied.  The collection is complete  in the sense that it includes all  subjects to be studied.
Census the collection of data from  every   member of the population. Sample   a sub-collection of elements drawn  from a population. Definitions
Key Concepts Sample data must be collected in an  appropriate way, such as through a  process of  random  selection. If sample data are not collected in an  appropriate way, the data may be  so completely useless that no  amount of statistical torturing can  salvage them.
Created by Tom Wegleitner, Centreville, Virginia Section 1-2  Types of Data
Parameter   a numerical measurement describing  some characteristic of a  population Definitions population parameter
Definitions Statistic   a numerical measurement describing  some characteristic of a  sample . sample statistic
Definitions Quantitative data  numbers representing counts or  measurements. Example:  weights of supermodels.
Definitions Qualitative  (or categorical or  attribute)  data can be separated into different categories  that are distinguished by some nonnumeric  characteristics. Example:  genders (male/female) of  professional athletes.
Working with  Quantitative Data Quantitative data can further be distinguished between  discrete  and  continuous  types.
Discrete   data result when the number of possible  values is either a finite number or a  ‘countable’ number of possible values. 0, 1, 2, 3, . . . Example:  The number of eggs that hens lay. Definitions
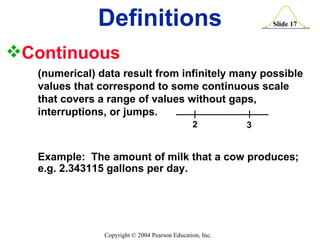
Continuous (numerical) data result from infinitely many possible  values that correspond to some continuous scale  that covers a range of values without gaps,  interruptions, or jumps. Definitions 2 3 Example:  The amount of milk that a cow produces; e.g. 2.343115 gallons per day.
Levels of Measurement Another way to classify data is to use use levels of measurement.  Four of these levels are discussed in the following slides.
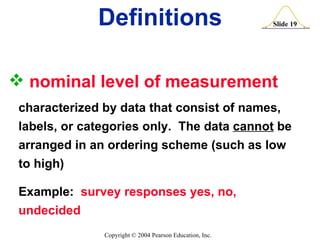
nominal level of measurement   characterized by data that consist of names, labels, or categories only.  The data  cannot  be  arranged in an ordering scheme (such as low to high) Example:  survey responses yes, no, undecided Definitions
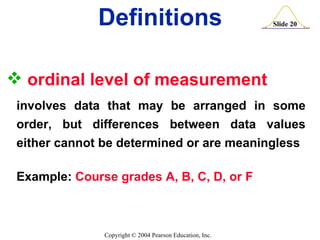
ordinal level of measurement   involves data that may be arranged in some order, but differences between data values either cannot be determined or are meaningless Example:  Course grades A, B, C, D, or F Definitions
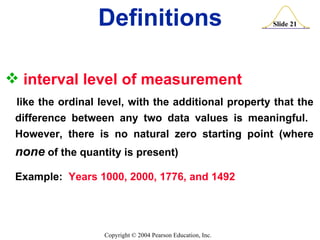
interval level of measurement   like the ordinal level, with the additional property that the difference between any two data values is meaningful.  However, there is no natural zero starting point (where  none  of the quantity is present) Example:  Years 1000, 2000, 1776, and 1492 Definitions
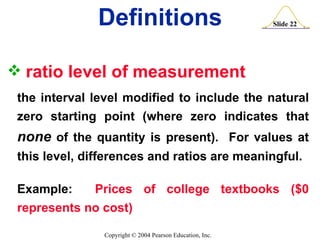
ratio level of measurement the interval level modified to include the natural zero starting point (where zero indicates that  none  of the quantity is present).  For values at this level, differences and ratios are meaningful. Example:  Prices of college textbooks ($0 represents no cost) Definitions
Nominal   - categories only Ordinal   - categories with some order Interval   - differences but no natural    starting point Ratio   - differences  and  a natural starting    point Summary -  Levels of  Measurement
Recap Basic definitions and terms describing data Parameters versus statistics Types of data (quantitative and qualitative) Levels of measurement In Sections 1-1 and 1-2 we have looked at:
Created by Tom Wegleitner, Centreville, Virginia Section 1-3  Critical Thinking
Success in Statistics Success in the introductory statistics course typically requires more  common sense  than mathematical expertise. This section is designed to illustrate how common sense is used  when we think critically about data and statistics.
Misuses of Statistics Bad Samples
Definitions Voluntary response sample (or self-selected survey) one in which the respondents themselves decide whether to be included.  In this case, valid conclusions can be made only about the specific group of people who agree to participate.
Misuses of Statistics Misleading Graphs Bad Samples Small Samples
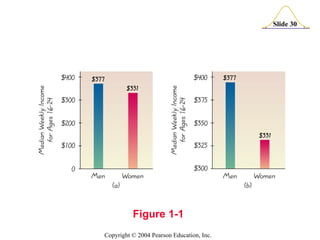
Figure 1-1
To correctly interpret a graph, we should analyze the  numerical   information given in the graph instead of being mislead by its general shape.
Misuses of Statistics Bad Samples Small Samples Misleading Graphs Pictographs
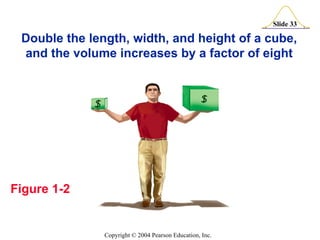
Figure 1-2 Double the length, width, and height of a cube, and the volume increases by a factor of eight
Misuses of Statistics Bad Samples Small Samples Misleading Graphs Pictographs Distorted Percentages Loaded Questions
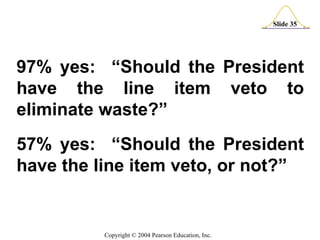
97% yes:  “Should the President have the line item veto to eliminate waste?” 57% yes:  “Should the President have the line item veto, or not?”
Bad Samples Small Samples Misleading Graphs Pictographs Distorted Percentages Loaded Questions Order of Questions Refusals Correlation & Causality Self Interest Study Precise Numbers Partial Pictures Deliberate Distortions Misuses of Statistics
Recap Reviewed 13 misuses of statistics. Illustrated how common sense can play a  big role in interpreting data and statistics In this section we have:
Created by Tom Wegleitner, Centreville, Virginia Section 1-4  Design of Experiments
Major Points If sample data are not collected in an  appropriate way, the data may be so  completely useless that no amount of  statistical tutoring can salvage them. Randomness  typically plays a critical  role in determining which data to collect.
Observational Study  observing and measuring specific  characteristics without attempting to  modify   the subjects being studied Definitions
Experiment  apply some  treatment  and then observe its  effects on the subjects Definitions
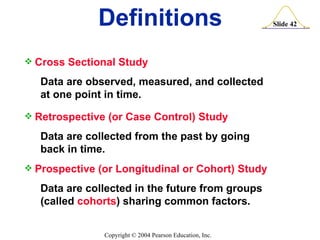
Cross Sectional Study Data are observed, measured, and collected at one point in time. Retrospective (or Case Control) Study Data are collected from the past by going back in time. Prospective (or Longitudinal or Cohort) Study Data are collected in the future from groups (called  cohorts ) sharing common factors. Definitions

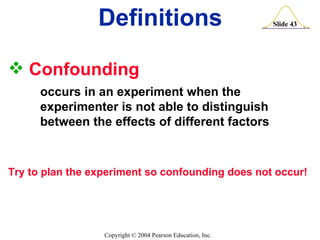
Confounding  occurs in an experiment when the  experimenter is not able to distinguish  between the effects of different factors Try to plan the experiment so confounding does not occur! Definitions
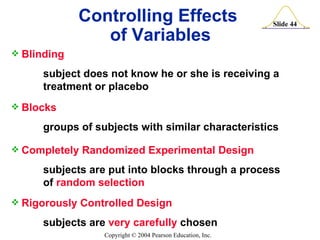
Controlling Effects  of Variables Blinding subject does not know he or she is receiving a  treatment or placebo Blocks groups of subjects with similar characteristics Completely Randomized Experimental Design subjects are put into blocks through a process  of  random selection Rigorously Controlled Design subjects are  very carefully  chosen
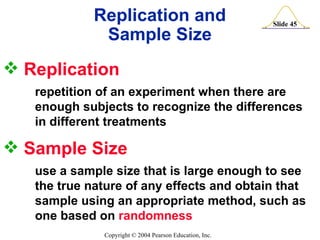
Replication  repetition of an experiment when there are    enough subjects to recognize the differences  in different treatments Replication and Sample Size Sample Size  use a sample size that is large enough to see  the true nature of any effects and obtain that  sample using an appropriate method, such as  one based on  randomness
Random Sample  members of the population are selected in  such a way that each individual member has  an  equal chance  of being selected Definitions Simple Random Sample  (of size  n ) subjects selected in such a way that every possible sample of the same size  n  has the  same chance of being chosen
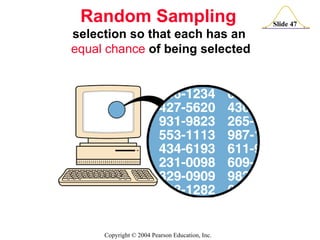
Random Sampling  selection so that each has an  equal   chance  of being selected
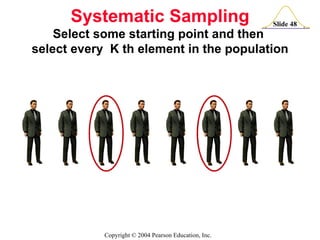
Systematic Sampling Select some starting point and then  select every  K th element in the population
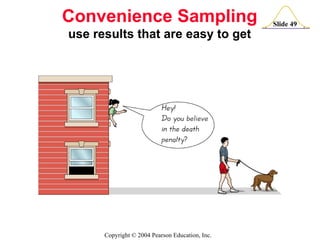
Convenience Sampling use results that are easy to get
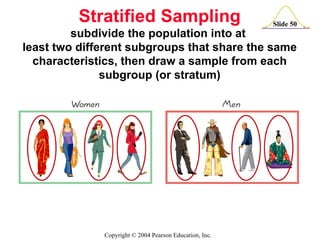
Stratified Sampling subdivide the population into at  least two different subgroups that share the same characteristics, then draw a sample from each subgroup (or stratum)
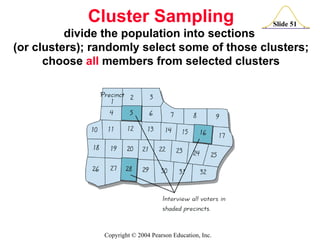
Cluster Sampling divide the population into sections  (or clusters); randomly select some of those clusters; choose  all  members from selected clusters
Random Systematic Convenience Stratified Cluster Methods of Sampling
Sampling Error the difference between a sample result and the true population result; such an error results from chance sample fluctuations Nonsampling Error  sample data that are incorrectly collected, recorded, or analyzed (such as by selecting a biased sample, using a defective instrument, or copying the data incorrectly) Definitions
Recap In this section we have looked at: Types of studies and experiments Controlling the effects of variables Randomization Types of sampling Sampling Errors