Download as PDF, PPTX

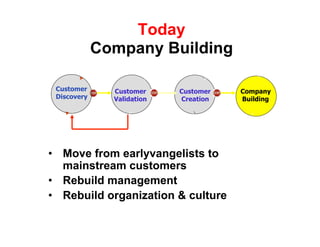
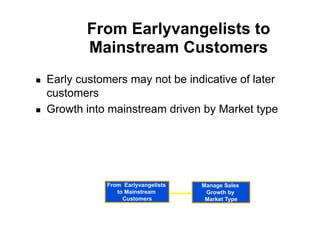
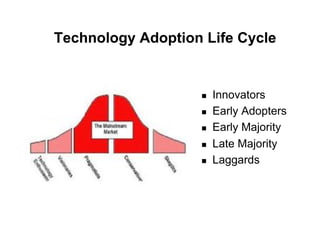
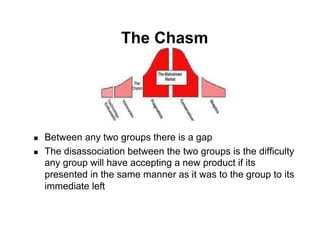
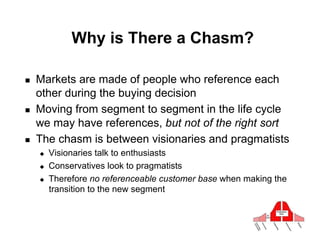
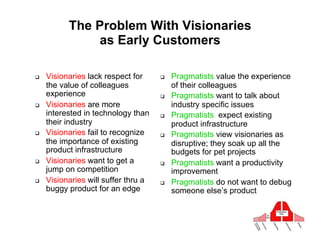
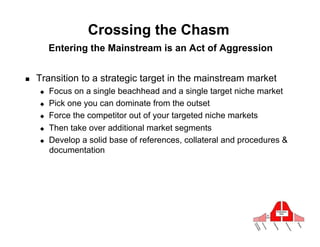
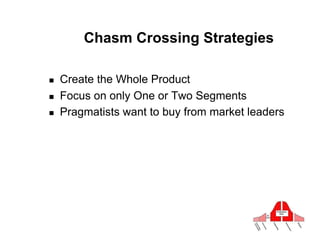


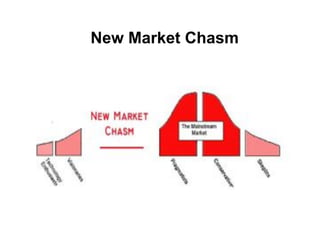


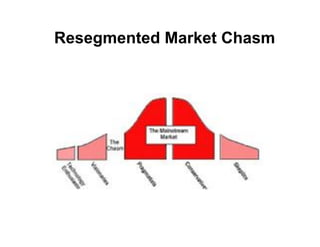
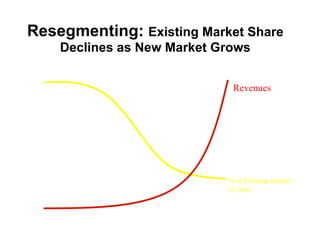

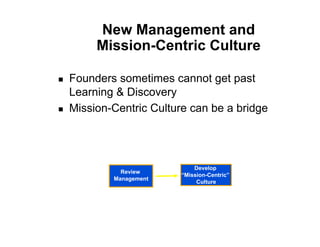
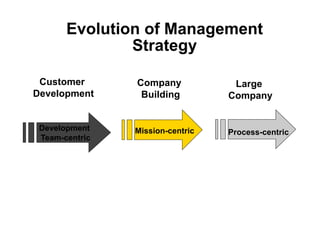


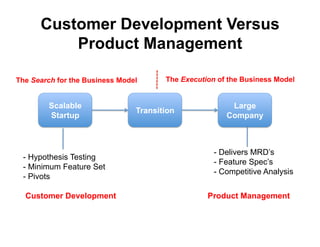
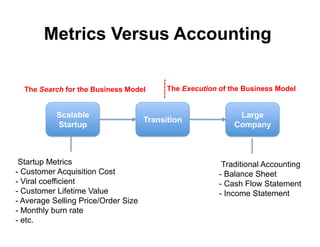
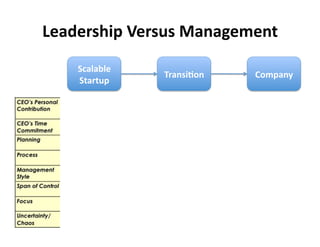
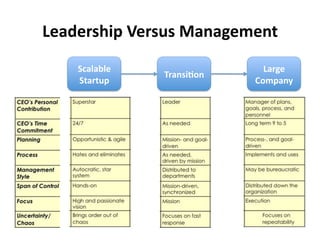
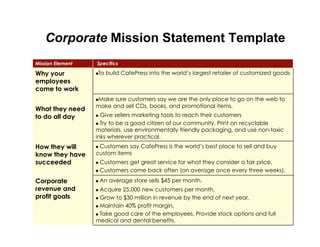
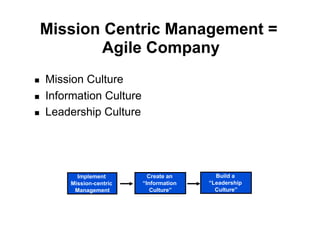
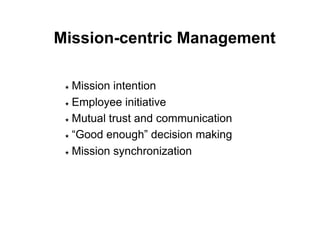
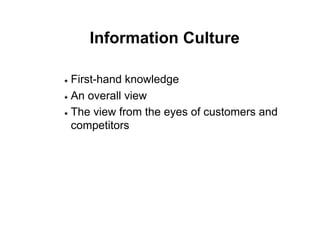
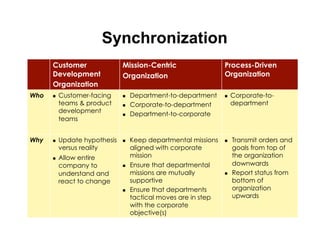
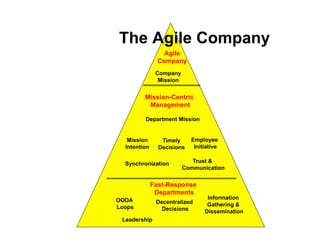
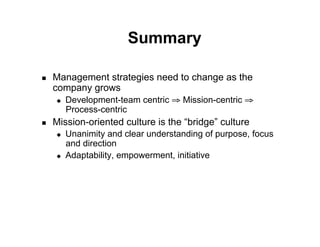

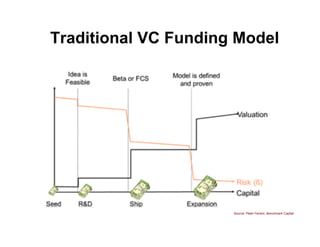

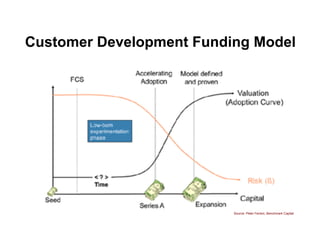


This document discusses customer development and company building. It covers moving from early adopters to mainstream customers by managing sales growth based on market type. It also discusses crossing the chasm between early adopters and mainstream pragmatists. Strategies for crossing the chasm include creating a "whole product", focusing on one or two market segments, and becoming a market leader in a niche. The document also discusses evolving management and developing a mission-centric culture as a company grows.


