
Recommended
More Related Content
What's hot
What's hot (20)
Similar to Currency high lights 03.06.16
Similar to Currency high lights 03.06.16 (20)
Recently uploaded
Recently uploaded (20)
Currency high lights 03.06.16
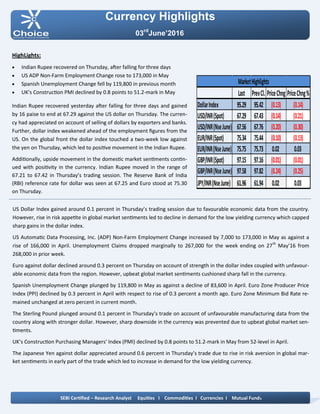
- 1. Currency Highlights 03rd June’2016 HighLights: Indian Rupee recovered on Thursday, after falling for three days US ADP Non-Farm Employment Change rose to 173,000 in May Spanish Unemployment Change fell by 119,800 in previous month UK’s Construction PMI declined by 0.8 points to 51.2-mark in May Indian Rupee recovered yesterday after falling for three days and gained by 16 paise to end at 67.29 against the US dollar on Thursday. The curren- cy had appreciated on account of selling of dollars by exporters and banks. Further, dollar index weakened ahead of the employment figures from the US. On the global front the dollar index touched a two-week low against the yen on Thursday, which led to positive movement in the Indian Rupee. Additionally, upside movement in the domestic market sentiments contin- ued with positivity in the currency. Indian Rupee moved in the range of 67.21 to 67.42 in Thursday’s trading session. The Reserve Bank of India (RBI) reference rate for dollar was seen at 67.25 and Euro stood at 75.30 on Thursday. US Dollar Index gained around 0.1 percent in Thursday’s trading session due to favourable economic data from the country. However, rise in risk appetite in global market sentiments led to decline in demand for the low yielding currency which capped sharp gains in the dollar index. US Automatic Data Processing, Inc. (ADP) Non-Farm Employment Change increased by 7,000 to 173,000 in May as against a rise of 166,000 in April. Unemployment Claims dropped marginally to 267,000 for the week ending on 27th May’16 from 268,000 in prior week. Euro against dollar declined around 0.3 percent on Thursday on account of strength in the dollar index coupled with unfavour- able economic data from the region. However, upbeat global market sentiments cushioned sharp fall in the currency. Spanish Unemployment Change plunged by 119,800 in May as against a decline of 83,600 in April. Euro Zone Producer Price Index (PPI) declined by 0.3 percent in April with respect to rise of 0.3 percent a month ago. Euro Zone Minimum Bid Rate re- mained unchanged at zero percent in current month. The Sterling Pound plunged around 0.1 percent in Thursday’s trade on account of unfavourable manufacturing data from the country along with stronger dollar. However, sharp downside in the currency was prevented due to upbeat global market sen- timents. UK’s Construction Purchasing Managers' Index (PMI) declined by 0.8 points to 51.2-mark in May from 52-level in April. The Japanese Yen against dollar appreciated around 0.6 percent in Thursday’s trade due to rise in risk aversion in global mar- ket sentiments in early part of the trade which led to increase in demand for the low yielding currency. SEBI Certified – Research Analyst Equities I Commodities I Currencies I Mutual Funds Last PrevCl. PriceChng PriceChng% DollarIndex 95.29 95.42 (0.13) (0.14) USD/INR(Spot) 67.29 67.43 (0.14) (0.21) USD/INR(NseJune) 67.56 67.76 (0.20) (0.30) EUR/INR(Spot) 75.34 75.44 (0.10) (0.13) EUR/INR(NseJune) 75.75 75.73 0.02 0.03 GBP/INR(Spot) 97.15 97.16 (0.01) (0.01) GBP/INR(NseJune) 97.58 97.82 (0.24) (0.25) JPY/INR(NseJune) 61.96 61.94 0.02 0.03 MarketHighlights
- 2. Technical View: The JPYINR price has been trading in rising channel pattern and price has taken support of its lower band of channel pattern 61.20 levels on 4 hourly chart. Prices have been taken resistance of 50% Fibonacci retracement levels form its previ- ous down move of 64 to 61 levels. However , Pair has been trading above its 50 hourly exponen- tial moving average which suggest short term trend remains Up. On 4 hourly chart, momentum oscillator RSI has moved above its 45 levels, which gives positive confirmation to the prices. A momentum indicator MACD has shown positive crossover on 4 hourly chart, which indicates short term trend remains bullish. For now we expect prices to move lower higher 62.30 levels in few trading sessions. Pivot levels for the Day Technical View: The price has been moving in its rising channel formation from past few weeks and price has taken support of its lower band of channel pattern at 67 levels on 4 hourly chart. Moreover, price have been trading above of its 21 four hourly exponential moving average which suggest near term trend remains up. So any dips in the prices towards 67.50 level, used as buying opportunity. A momentum indicator RSI has moved above 60 levels on 4 hourly chart, which suggest bullishness in the prices. A momentum indictor MACD has given positive crossover and trading above its single line on 4 hourly chart, which gives positive confirmation to the prices. For now we expect prices to move higher towards 67.90 lev- els in few trading sessions. Currency Highlights 03rd June’2016 USDINR JPYINR SEBI Certified – Research Analyst Equities I Commodities I Currencies I Mutual Funds S3 S2 S1 Pivot R1 R2 R3 USDINR 67.11 67.35 67.45 67.59 67.69 67.83 68.07 JPYINR 61.24 61.59 61.78 61.94 62.13 62.29 62.64
- 3. Pivot levels for the Day Currency Highlights 03rd June’2016 GBPINR EURINR Technical View: The pair has been trading in ascending triangle pattern and taken support of its lower band of pattern at 75.10 levels on 4 hourly chart. On the other hand, Pair has been trading above its 21 hourly exponential moving average which indi- cates that trend is remains positive. The pair has taken support of its 38.20% Fibonacci retrace- ment levels on hourly chart form its previous rally of 74 to 77 levels. A momentum oscillator RSI have been trading above 40 lev- els on 4 hourly chart which gives the signs of bullishness to the prices. Moreover, momentum indicator MACD has shown positive crossover on daily chart which support our bullish view on the pair. Technical View: The prices have been moving in rising wedge formation form past few days and price has faced resistance of its upper band of wedge pattern at 99.10 levels on 4 hourly chart. Moreover, price has formed evening star candle stick pattern on 4 hourly chart which gives negative confirmation to the prices. On the other hand, Pair has been trading below its 21 hourly exponential moving average which indicates that medium term trend is remains bearish. A momentum oscillator RSI has given negative divergence on 4 hourly chart 58 levels which gives the sign of bearish- ness to the prices. Moreover, momentum indicator MACD has shown negative crossover on 4 hourly chart which support our bearish view on the pair. SEBI Certified – Research Analyst Equities I Commodities I Currencies I Mutual Funds S3 S2 S1 Pivot R1 R2 R3 GBPINR 97.01 97.29 97.45 97.57 97.73 97.85 98.13 EURINR 75.12 75.46 75.61 75.80 75.95 76.14 76.48
- 4. Currency Highlights SEBI Certified – Research Analyst Equities I Commodities I Currencies I Mutual Funds Economic Indicators Date Time Data Prior Expected Impact 03.06.16 7:15am Caixin Services PMI 51.8 52.0 Actual < Forecast = Good for Yuan 03.06.16 2:00pm Services PMI 52.3 52.5 Actual < Forecast = Good for currency; GBPINR 03.06.16 6:00pm Average Hourly Earnings m/m 0.3% 0.2% Actual > Forecast = Good for currency; USDINR 03.06.16 6:00pm Non-Farm Employment Change 160K 159K Actual > Forecast = Good for currency; USDINR 03.06.16 6:00pm Unemployment Rate 5.0% 4.9% Actual < Forecast = Good for currency; USDINR 03.06.16 6:00pm Trade Balance -40.4B -41.2B Actual < Forecast = Good for currency; USDINR 03.06.16 7:30pm ISM Non-Manufacturing PMI 55.7 55.4 Actual < Forecast = Good for currency; USDINR 03.06.16 7:30pm Factory Orders m/m 1.1% 1.8% Actual < Forecast = Good for currency; USDINR 03.06.16 10:00pm FOMC Member Brainard Speaks 03rd June’2016
- 5. Currency Highlights 03rd June’2016 SEBI Certified – Research Analyst Equities I Commodities I Currencies I Mutual Funds Amit Pathania Digitally signed by Amit Pathania DN: cn=Amit Pathania, o=Choice Equity Broking Pvt. ltd, ou=Research Department, email=amit.pathania@choiceindia.com, c=IN Date: 2016.06.03 08:34:11 +05'30'