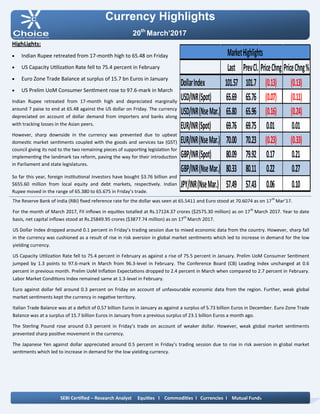
Vasai-Virar High Profile Model Call Girls📞9833754194-Nalasopara Satisfy Call ...
Currency high lights 20.03.17
1. Currency Highlights
20th
March’2017
HighLights:
Indian Rupee retreated from 17-month high to 65.48 on Friday
US Capacity Utilization Rate fell to 75.4 percent in February
Euro Zone Trade Balance at surplus of 15.7 bn Euros in January
US Prelim UoM Consumer Sentiment rose to 97.6-mark in March
Indian Rupee retreated from 17-month high and depreciated marginally
around 7 paise to end at 65.48 against the US dollar on Friday. The currency
depreciated on account of dollar demand from importers and banks along
with tracking losses in the Asian peers.
However, sharp downside in the currency was prevented due to upbeat
domestic market sentiments coupled with the goods and services tax (GST)
council giving its nod to the two remaining pieces of supporting legislation for
implementing the landmark tax reform, paving the way for their introduction
in Parliament and state legislatures.
So far this year, foreign institutional investors have bought $3.76 billion and
$655.60 million from local equity and debt markets, respectively. Indian
Rupee moved in the range of 65.380 to 65.675 in Friday’s trade.
The Reserve Bank of India (RBI) fixed reference rate for the dollar was seen at 65.5411 and Euro stood at 70.6074 as on 17th
Mar’17.
For the month of March 2017, FII inflows in equities totalled at Rs.17124.37 crores ($2575.30 million) as on 17th
March 2017. Year to date
basis, net capital inflows stood at Rs.25849.95 crores ($3877.74 million) as on 17th
March 2017.
US Dollar Index dropped around 0.1 percent in Friday’s trading session due to mixed economic data from the country. However, sharp fall
in the currency was cushioned as a result of rise in risk aversion in global market sentiments which led to increase in demand for the low
yielding currency.
US Capacity Utilization Rate fell to 75.4 percent in February as against a rise of 75.5 percent in January. Prelim UoM Consumer Sentiment
jumped by 1.3 points to 97.6-mark in March from 96.3-level in February. The Conference Board (CB) Leading Index unchanged at 0.6
percent in previous month. Prelim UoM Inflation Expectations dropped to 2.4 percent in March when compared to 2.7 percent in February.
Labor Market Conditions Index remained same at 1.3-level in February.
Euro against dollar fell around 0.3 percent on Friday on account of unfavourable economic data from the region. Further, weak global
market sentiments kept the currency in negative territory.
Italian Trade Balance was at a deficit of 0.57 billion Euros in January as against a surplus of 5.73 billion Euros in December. Euro Zone Trade
Balance was at a surplus of 15.7 billion Euros in January from a previous surplus of 23.1 billion Euros a month ago.
The Sterling Pound rose around 0.3 percent in Friday’s trade on account of weaker dollar. However, weak global market sentiments
prevented sharp positive movement in the currency.
The Japanese Yen against dollar appreciated around 0.5 percent in Friday’s trading session due to rise in risk aversion in global market
sentiments which led to increase in demand for the low yielding currency.
SEBI Certified – Research Analyst Equities I Commodities I Currencies I Mutual Funds
Last PrevCl. PriceChng PriceChng%
DollarIndex 101.57 101.7 (0.13) (0.13)
USD/INR(Spot) 65.69 65.76 (0.07) (0.11)
USD/INR(NseMar.) 65.80 65.96 (0.16) (0.24)
EUR/INR(Spot) 69.76 69.75 0.01 0.01
EUR/INR(NseMar.) 70.00 70.23 (0.23) (0.33)
GBP/INR(Spot) 80.09 79.92 0.17 0.21
GBP/INR(NseMar.) 80.33 80.11 0.22 0.27
JPY/INR(NseMar.) 57.49 57.43 0.06 0.10
MarketHighlights
2. Technical View:
On a daily chart, the pair has been trading in horizontal
channel pattern from past few months and price has
taken the support of its horizontal channel pattern at
57.25 levels.
Moreover, prices have been trading above its 10 HSMA
which gives the sign of bullishness in the prices.
On daily chart momentum indicator, RSI is taking
support at 30 levels which indicate pull back in the
prices.
In addition, momentum indicator MACD has shown
positive crossover which suggests strength in the prices
on a daily chart.
So for trading perspective, one can buy JPYINR in the
range of 57.90 with SL of 57.70 for the target of 58.35
levels.
Pivot levels for the Day
Technical View:
The pair has given a breakdown of its “Symmetrical
Triangle” pattern at 66.60 levels on a daily chart.
Moreover, prices have been trading above its 50 DSMA
which gives the sign of bearishness in the prices.
Furthermore, the price has shown a breakdown of its
consolidation range from 67.40 to 66.60 levels on a daily
chart.
A momentum indicator RSI has remained below 45
levels, which suggest further negative momentum can
be seen in the prices.
In addition, momentum indicator MACD has shown
negative crossover and moving below its signal line on a
daily chart.
So for trading perspective, one can sell USDINR in the
range of 65.60 with SL of 66.80 for the target of 65.20
levels.
Currency Highlights
20th
March’2017
USDINR JPYINR
SEBI Certified – Research Analyst Equities I Commodities I Currencies I Mutual Funds
S3 S2 S1 Pivot R1 R2 R3
USDINR 64.89 65.32 65.56 65.75 65.99 66.18 66.61
JPYINR 56.62 57.00 57.25 57.38 57.63 57.76 58.14
3. Pivot levels for the Day
Currency Highlights
20th
March’2017
GBPINR EURINR
Technical View:
On a daily chart, prices have been trading in falling
channel pattern from past few weeks and price has
taken the support of its lower band of channel pattern
at 69.60 levels.
The price has taken the support of its falling trend line
at 69.50 levels o daily chart.
The pair has been trading above its 10 HSMA on the
hourly chart, which suggests further positive
momentum can be seen in the prices.
On daily chart momentum oscillator, RSI has been
taking support at 35 levels on a daily chart, which
suggests bullishness in the prices.
A momentum indicator MACD has shown positive
crossover on the hourly chart, which supports our
bullish view on the prices.
For now, we can expect prices should move higher
towards 71.10 levels in the coming trading session.
Technical View:
The pair has been trading in “Falling Wedge” pattern
from past few weeks and price has taken support of its
lower band of pattern at 80 levels on a daily chart.
Moreover, prices have been trading above 10 HSMA,
which suggest short term trend looks up.
Moreover, momentum indicator MACD has given
positive crossover on the hourly chart, which gives the
sign of bullishness in the prices.
The momentum indicator RSI has been trading near its
support levels on the daily chart, which suggest the
possibilities of further up side momentum in the prices.
For now, we expect prices should move higher
towards 81.60 levels in the coming trading sessions.
SEBI Certified – Research Analyst Equities I Commodities I Currencies I Mutual Funds
S3 S2 S1 Pivot R1 R2 R3
GBPINR 78.62 79.41 79.87 80.20 80.66 80.99 81.78
EURINR 69.03 69.50 69.87 69.97 70.34 70.44 70.91
4. Currency Highlights
SEBI Certified – Research Analyst Equities I Commodities I Currencies I Mutual Funds
20th
March’2017
Economic Indicators
Date Time Data Prior Expected Impact
20.03.17 12:30 PM German PPI m/m 0.7% 0.4%
Actual > Forecast = Good for
currency; EURINR
20.03.17 10:40 PM FOMC Member Evans Speech
5. Currency Highlights
20th
March’2017
SEBI Certified – Research Analyst Equities I Commodities I Currencies I Mutual Funds
Anish Vyas
Digitally signed by Anish Vyas
DN: cn=Anish Vyas, o=Choice Merchandise
Broking Pvt. Ltd, ou=Sr. Research Associate,
email=anish.vyas@choiceindia.com, c=IN
Date: 2017.03.18 13:48:45 +05'30'