
Recommended
More Related Content
What's hot
What's hot (20)
Viewers also liked
Viewers also liked (16)
Similar to Currency high lights 18.10.16
Similar to Currency high lights 18.10.16 (20)
Recently uploaded
Recently uploaded (20)
Currency high lights 18.10.16
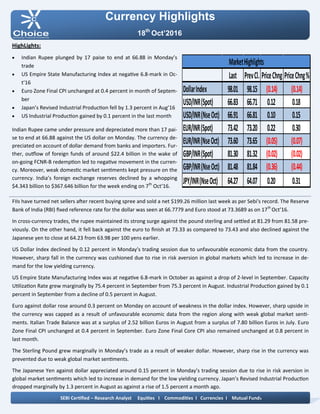
- 1. Currency Highlights 18th Oct’2016 HighLights: Indian Rupee plunged by 17 paise to end at 66.88 in Monday’s trade US Empire State Manufacturing Index at negative 6.8-mark in Oc- t’16 Euro Zone Final CPI unchanged at 0.4 percent in month of Septem- ber Japan’s Revised Industrial Production fell by 1.3 percent in Aug’16 US Industrial Production gained by 0.1 percent in the last month Indian Rupee came under pressure and depreciated more than 17 pai- se to end at 66.88 against the US dollar on Monday. The currency de- preciated on account of dollar demand from banks and importers. Fur- ther, outflow of foreign funds of around $22.4 billion in the wake of on-going FCNR-B redemption led to negative movement in the curren- cy. Moreover, weak domestic market sentiments kept pressure on the currency. India’s foreign exchange reserves declined by a whopping $4.343 billion to $367.646 billion for the week ending on 7th Oct’16. FIIs have turned net sellers after recent buying spree and sold a net $199.26 million last week as per Sebi's record. The Reserve Bank of India (RBI) fixed reference rate for the dollar was seen at 66.7779 and Euro stood at 73.3689 as on 17th Oct’16. In cross-currency trades, the rupee maintained its strong surge against the pound sterling and settled at 81.29 from 81.58 pre- viously. On the other hand, it fell back against the euro to finish at 73.33 as compared to 73.43 and also declined against the Japanese yen to close at 64.23 from 63.98 per 100 yens earlier. US Dollar Index declined by 0.12 percent in Monday’s trading session due to unfavourable economic data from the country. However, sharp fall in the currency was cushioned due to rise in risk aversion in global markets which led to increase in de- mand for the low yielding currency. US Empire State Manufacturing Index was at negative 6.8-mark in October as against a drop of 2-level in September. Capacity Utilization Rate grew marginally by 75.4 percent in September from 75.3 percent in August. Industrial Production gained by 0.1 percent in September from a decline of 0.5 percent in August. Euro against dollar rose around 0.3 percent on Monday on account of weakness in the dollar index. However, sharp upside in the currency was capped as a result of unfavourable economic data from the region along with weak global market senti- ments. Italian Trade Balance was at a surplus of 2.52 billion Euros in August from a surplus of 7.80 billion Euros in July. Euro Zone Final CPI unchanged at 0.4 percent in September. Euro Zone Final Core CPI also remained unchanged at 0.8 percent in last month. The Sterling Pound grew marginally in Monday’s trade as a result of weaker dollar. However, sharp rise in the currency was prevented due to weak global market sentiments. The Japanese Yen against dollar appreciated around 0.15 percent in Monday’s trading session due to rise in risk aversion in global market sentiments which led to increase in demand for the low yielding currency. Japan’s Revised Industrial Production dropped marginally by 1.3 percent in August as against a rise of 1.5 percent a month ago. SEBI Certified – Research Analyst Equities I Commodities I Currencies I Mutual Funds Last PrevCl. PriceChng PriceChng% DollarIndex 98.01 98.15 (0.14) (0.14) USD/INR(Spot) 66.83 66.71 0.12 0.18 USD/INR(NseOct) 66.91 66.81 0.10 0.15 EUR/INR(Spot) 73.42 73.20 0.22 0.30 EUR/INR(NseOct) 73.60 73.65 (0.05) (0.07) GBP/INR(Spot) 81.30 81.32 (0.02) (0.02) GBP/INR(NseOct) 81.48 81.84 (0.36) (0.44) JPY/INR(NseOct) 64.27 64.07 0.20 0.31 MarketHighlights
- 2. Technical View: On daily chart JPYINR prices have been trading in sym- metrical triangle pattern and shown breakdown of its symmetrical triangle pattern. However, price has formed bearish candle stick on daily chart. Moreover, price has shown breakdown of its rising trend line at 65 levels. On the other hand price has shown breakdown of its rising trend line at 65.60 levels on daily chart. Furthermore, prices have been trading below its 21 DE- MA, which suggest short term trend is negative. On daily chart momentum indicator RSI is trading below at 45 levels which suggest further weakness in the pric- es. So for trading perspective, one could use sell in the range of 64.30 with SL of 64.70 for Target of 63.80 levels. Pivot levels for the Day Technical View: On daily USDINR prices have been trading in falling channel formation from past few weeks and prices have been facing resistance at upper band of channel pattern at 67.05 levels. The pair has formed bearish candle stick with appealing volumes. On the other hand, prices have been facing resistance of horizontal trend line at 66.95 levels on daily chart. Moreover, prices have been trading below 21 DEMA which gives the sign of bearishness in the prices. A momentum indictor RSI has traded below 60 levels, which suggest further weakness in the prices. In addition, momentum indicator MACD has shown neg- ative crossover on daily chart. So for trading perspective, one could sell in range 66.90 with SL of 67.25 for target of 66.20. Currency Highlights 18th Oct’2016 USDINR JPYINR SEBI Certified – Research Analyst Equities I Commodities I Currencies I Mutual Funds S3 S2 S1 Pivot R1 R2 R3 USDINR 66.64 66.77 66.84 66.90 66.97 67.03 67.16 JPYINR 63.85 64.05 64.16 64.25 64.36 64.45 64.65
- 3. Pivot levels for the Day Currency Highlights 18th Oct’2016 GBPINR EURINR Technical View: The EURINR pair has shown breakdown of its descend- ing triangle pattern at 74 levels on daily chart. On the other hand price has shown breakdown of its symmet- rical triangle pattern at 74.80 levels on daily chart. Moreover, prices have been trading below its 21 DE- MA, which suggest short term trend is down. The pair has shown breakdown of its horizontal trend line at 74.70 levels on daily chart. On daily chart momentum oscillator RSI have been trad- ing below 60 which suggest bearishness in the prices. A momentum indicator MACD has shown negative crossover on daily chart, which add more bearishness in the prices. For now we can expect prices should move lower to- wards 73 levels in the coming trading session. Technical View: On daily GBPINR prices have been taking support of its falling trend line at 81.20 levels. Moreover, prices have been trading below 21 HEMA, which suggest short term trend looks positive. The price has formed bullish hammer candle stick pattern on daily chart, which is bullish pattern. A momentum indicator MADC has given positive Cross over on hourly chart, which gives the sign of bullishness in the prices. The momentum indictor RSI has been trading in over- sold zone levels on daily chart, which suggest the possi- bilities of bounce back in the in the prices. For now we expect prices should move higher towards 82.50 levels coming trading sessions. SEBI Certified – Research Analyst Equities I Commodities I Currencies I Mutual Funds S3 S2 S1 Pivot R1 R2 R3 GBPINR 73.15 73.36 73.48 73.57 73.69 73.78 73.99 EURINR 73.15 73.36 73.48 73.57 73.69 73.78 73.99
- 4. Currency Highlights SEBI Certified – Research Analyst Equities I Commodities I Currencies I Mutual Funds 18th Oct’2016 Economic Indicators Date Time Data Prior Expected Impact 18.10.16 18th-19th M2 Money Supply y/y 11.4% 11.6% Actual< Forecast = Good for currency; USDINR 18.10.16 18th-19th New Loans 949B 1000B More hawkish than expected = Good for currency; 18.10.16 2:00 PM CPI y/y 0.6% 0.9% Actual > Forecast = Good for currency; EURINR 18.10.16 6:00 PM CPI m/m 0.2% 0.3% Actual > Forecast = Good for currency; EURINR 18.10.16 6:00 PM Core CPI m/m 0.3% 0.2% Actual > Forecast = Good for currency; USDINR 18.10.16 Tentative GDT Price Index -0.3 More hawkish than expected = Good for currency; NZD
- 5. Currency Highlights 18th Oct’2016 SEBI Certified – Research Analyst Equities I Commodities I Currencies I Mutual Funds Amit Pathania Digitally signed by Amit Pathania DN: cn=Amit Pathania, o=Choice Equity Broking Pvt. ltd, ou=Research Department, email=amit.pathania@choiceindia.com, c=IN Date: 2016.10.18 08:51:48 +05'30'