Mira Road Awesome 100% Independent Call Girls NUmber-9833754194-Dahisar Inter...
Currency high lights 28.06.16
1. Currency Highlights
28th
June’2016
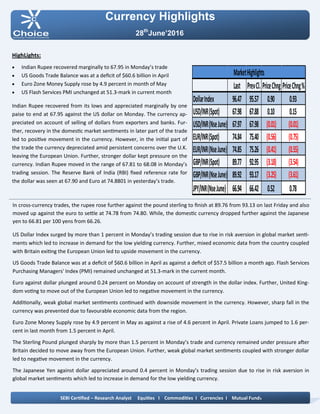
HighLights:
Indian Rupee recovered marginally to 67.95 in Monday’s trade
US Goods Trade Balance was at a deficit of $60.6 billion in April
Euro Zone Money Supply rose by 4.9 percent in month of May
US Flash Services PMI unchanged at 51.3-mark in current month
Indian Rupee recovered from its lows and appreciated marginally by one
paise to end at 67.95 against the US dollar on Monday. The currency ap-
preciated on account of selling of dollars from exporters and banks. Fur-
ther, recovery in the domestic market sentiments in later part of the trade
led to positive movement in the currency. However, in the initial part of
the trade the currency depreciated amid persistent concerns over the U.K.
leaving the European Union. Further, stronger dollar kept pressure on the
currency. Indian Rupee moved in the range of 67.81 to 68.08 in Monday’s
trading session. The Reserve Bank of India (RBI) fixed reference rate for
the dollar was seen at 67.90 and Euro at 74.8801 in yesterday’s trade.
In cross-currency trades, the rupee rose further against the pound sterling to finish at 89.76 from 93.13 on last Friday and also
moved up against the euro to settle at 74.78 from 74.80. While, the domestic currency dropped further against the Japanese
yen to 66.81 per 100 yens from 66.26.
US Dollar Index surged by more than 1 percent in Monday’s trading session due to rise in risk aversion in global market senti-
ments which led to increase in demand for the low yielding currency. Further, mixed economic data from the country coupled
with Britain exiting the European Union led to upside movement in the currency.
US Goods Trade Balance was at a deficit of $60.6 billion in April as against a deficit of $57.5 billion a month ago. Flash Services
Purchasing Managers' Index (PMI) remained unchanged at 51.3-mark in the current month.
Euro against dollar plunged around 0.24 percent on Monday on account of strength in the dollar index. Further, United King-
dom voting to move out of the European Union led to negative movement in the currency.
Additionally, weak global market sentiments continued with downside movement in the currency. However, sharp fall in the
currency was prevented due to favourable economic data from the region.
Euro Zone Money Supply rose by 4.9 percent in May as against a rise of 4.6 percent in April. Private Loans jumped to 1.6 per-
cent in last month from 1.5 percent in April.
The Sterling Pound plunged sharply by more than 1.5 percent in Monday’s trade and currency remained under pressure after
Britain decided to move away from the European Union. Further, weak global market sentiments coupled with stronger dollar
led to negative movement in the currency.
The Japanese Yen against dollar appreciated around 0.4 percent in Monday’s trading session due to rise in risk aversion in
global market sentiments which led to increase in demand for the low yielding currency.
SEBI Certified – Research Analyst Equities I Commodities I Currencies I Mutual Funds
Last PrevCl. PriceChng PriceChng%
DollarIndex 96.47 95.57 0.90 0.93
USD/INR(Spot) 67.98 67.88 0.10 0.15
USD/INR(NseJune) 67.97 67.98 (0.01) (0.01)
EUR/INR(Spot) 74.84 75.40 (0.56) (0.75)
EUR/INR(NseJune) 74.85 75.26 (0.41) (0.55)
GBP/INR(Spot) 89.77 92.95 (3.18) (3.54)
GBP/INR(NseJune) 89.92 93.17 (3.25) (3.61)
JPY/INR(NseJune) 66.94 66.42 0.52 0.78
MarketHighlights
2. Technical View:
The pair has shown breakout of its rising wedge pattern at
65.50 levels on daily chart. The price has given breakout of its
consolidation range of 62.50 to 65 levels on daily chart, which
indicates further upside momentum in the prices.
In addition, on daily chart prices have been trading above its
21 daily exponential moving average which gives the positive
confirmation to the prices.
On daily chart, momentum oscillator RSI has remained above
60 levels, which gives positive confirmation to the prices.
A momentum indicator MACD has shown positive crossover
on daily chart, which indicates short term trend remains bull-
ish.
For now we expect prices to move higher towards 67.30 lev-
els in few trading sessions.
Pivot levels for the Day
Technical View:
The price has been trading in its rising channel formation
from past few months and price has face strong resistance of
its upper band at 68.50 levels on daily chart.
Moreover, price have been trading below its 21 hourly expo-
nential moving average which suggest near term remains
down. So any rally in the prices towards 68.10 level, used as
selling opportunity.
A momentum indicator RSI has faced resistance of its hori-
zontal trend line at 65 levels on daily chart, which suggest
bearishness in the prices.
A momentum indictor MACD has given negative crossover on
hourly chart, which gives negative confirmation to the prices.
For now we expect prices to move lower towards 67.50 lev-
els in few trading sessions.
Currency Highlights
28th
June’2016
USDINR JPYINR
SEBI Certified – Research Analyst Equities I Commodities I Currencies I Mutual Funds
S3 S2 S1 Pivot R1 R2 R3
USDINR 67.36 67.66 67.81 67.96 68.11 68.26 68.56
JPYINR 65.25 66.03 66.49 66.81 67.27 67.59 68.37
3. Pivot levels for the Day
Currency Highlights
28th
June’2016
GBPINR EURINR
Technical View:
The price has shown breakdown of its rising channel pattern
at 75.50 levels on daily chart. The pair has given breakdown
of its symmetrical triangle pattern at 76.45 levels on daily
chart with bolstering volumes.
On the other hand, Pair has been trading below its 21 daily
exponential moving average which indicates that trend is
remains down.
A momentum oscillator RSI have been trading below 45 lev-
els on daily chart which gives the signs of bearishness to the
prices.
Moreover, momentum indicator MACD has shown negative
crossover on daily chart which support our bearish view on
the pair.
For now we expect prices should move lower towards 74
levels in the coming trading sessions.
Technical View:
The price has shown breakdown of its horizontal channel
pattern at 94 levels on daily chart.
On the other hand, Pair has been trading below its 50 daily
exponential moving average which indicates that short term
trend is remains bearish.
A momentum indicator RSI has moved below 45 levels on
daily chart, which suggest bearishness in the prices.
Moreover, momentum indicator MACD has shown negative
crossover on daily chart which support our bearish view on
the pair.
For now we expect prices should move lower towards 88.90
levels in the coming trading sessions.
SEBI Certified – Research Analyst Equities I Commodities I Currencies I Mutual Funds
S3 S2 S1 Pivot R1 R2 R3
GBPINR 86.99 88.72 89.33 90.45 91.06 92.18 93.91
EURINR 73.97 74.45 74.64 74.93 75.12 75.41 75.89
4. Currency Highlights
SEBI Certified – Research Analyst Equities I Commodities I Currencies I Mutual Funds
Economic Indicators
Date Time Data Prior Expected Impact
28.06.16 1:30pm ECB President Draghi Speaks
28.06.16 Day 1 EU Economic Summit
28.06.16 6:00pm Final GDP q/q 0.8% 1.0% Actual > Forecast = Good for
currency; USDINR
28.06.16 7:30pm CB Consumer Confidence 92.6 93.2 Actual > Forecast = Good for
currency; USDINR
28th
June’2016
5. Currency Highlights
28th
June’2016
SEBI Certified – Research Analyst Equities I Commodities I Currencies I Mutual Funds
Amit Pathania
Digitally signed by Amit Pathania
DN: cn=Amit Pathania, o=Choice Equity Broking Pvt. ltd, ou=Research
Department, email=amit.pathania@choiceindia.com, c=IN
Date: 2016.06.28 08:47:43 +05'30'