VIP Independent Call Girls in Mira Bhayandar 🌹 9920725232 ( Call Me ) Mumbai ...
Currency high lights 12.05.16
1. Currency Highlights
12th
May’2016
HighLights:
Indian Rupee snapped its two day losing streak and rose at 66.56 on
Wednday.
US Federal Budget Balance was at a surplus of $106.5 billion in April
UK’s Manufacturing Production rose by 0.1 percent in March
Japan’s Current Account was at a surplus of 1.89 trillion Yen in March
Indian Rupee snapped its two day losing streak and recovered around 11
paise to end at 66.56 against the US dollar on Wednesday. The currency
had appreciated on account of fresh selling of dollars from exporters and
banks. Further, inflow of foreign capital led to positive movement in the
currency. Foreign Portfolio Investors and Foreign Institutional Investors
bought shares worth a net Rs 328.59 crore on Tuesday, as per the provi-
sional data issued by stock exchanges. However, sharp upside movement
in the currency was capped due to fall in domestic market sentiments. In-
dian Rupee moved in the range of 66.56 to 66.84 in Wednesday’s trading
session.
In cross-currency trades, the rupee recovered against the pound sterling to finish at 96.09 from 96.36 yesterday. However, it
declined further against the euro to 75.87 from 75.84. The domestic currency also fell against the yen to 61.19 per 100 yens
from 61.13.
US Dollar Index declined around 0.5 percent in Wednesday’s trading session due to rise in risk appetite in global market senti-
ments in early part of the trade which led to decline in demand for the low yielding currency. However, favourable economic
data from the country cushioned sharp negative movement in the currency.
US Federal Budget Balance was at a surplus of $106.5 billion in April as against a deficit of $108 billion in March.
Euro against dollar rose around 0.5 percent on Wednesday on account of weakness in the dollar index. However, sharp rise in
the currency was prevented due to weak global market sentiments in later part of the trade.
The Sterling Pound against dollar fell marginally in Wednesday’s trade on account of weak global market sentiments in later
part of the trade. However, weakness in the dollar index along with optimistic economic data from the country cushioned
sharp fall in the currency.
UK’s Manufacturing Production rose by 0.1 percent in March as against a decline of 0.9 percent in February. Industrial Produc-
tion increased by 0.3 percent in March from a previous fall of 0.2 percent a month ago. National Institute of Economic and So-
cial Research (NIESR) Gross Domestic Product (GDP) Estimate dropped to 0.3 percent in April with respect to 0.4 percent in
March.
The Japanese Yen against dollar appreciated around 0.8 percent in yesterday’s trade due to rise in risk aversion in global mar-
ket sentiments in later part of the trade which led to increase in demand for the low yielding currency.
SEBI Certified – Research Analyst Equities I Commodities I Currencies I Mutual Funds
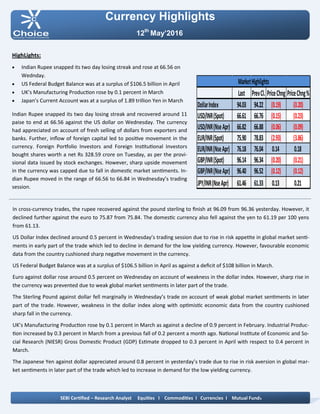
Last PrevCl. PriceChng PriceChng%
DollarIndex 94.03 94.22 (0.19) (0.20)
USD/INR(Spot) 66.61 66.76 (0.15) (0.23)
USD/INR(NseApr) 66.82 66.88 (0.06) (0.09)
EUR/INR(Spot) 75.90 78.83 (2.93) (3.86)
EUR/INR(NseApr) 76.18 76.04 0.14 0.18
GBP/INR(Spot) 96.14 96.34 (0.20) (0.21)
GBP/INR(NseApr) 96.40 96.52 (0.12) (0.12)
JPY/INR(NseApr) 61.46 61.33 0.13 0.21
MarketHighlights
2. Technical View:
The JPYINR price has been trading in rising wedge formation
form past few weeks. Price has faced resistance of upper
band of wedge pattern at 62.80 levels on 4 hourly chart. Pric-
es have been facing resistance of horizontal trend line at
62.10 levels on 4 hourly chart.
The prices have been facing resistance of 161.80% Fibonacci
projection at 63.10 levels which is known as golden ration.
Moreover, Pair has been trading below its 50 hourly exponen-
tial moving average which suggest short term trend remains
down.
On 4 hourly chart, momentum oscillator RSI has moved be-
low 60 levels, which gives negative confirmation to the prices.
A momentum indicator MACD has shown negative crossover
on 4 hourly chart, which indicates short term trend remains
negative.
Pivot levels for the Day
Technical View:
The price has formed evening star candle stick pattern on 4
hourly chart, which is bearish pattern. Moreover, price has
been moving in rectangle pattern and facing resistance at
67.10 levels on hourly chart.
Moreover, price have been trading below its 21 daily expo-
nential moving average which suggest near term trend re-
mains weak. So any rally towards 67.95 level, used as selling
opportunity.
A momentum indicator RSI has been trading below 60 levels
on 4 hourly chart, which suggest bearishness in the prices.
Momentum indictor MACD has shown negative crossover
and trading below single line on 4 hourly chart, which gives
negative confirmation to the prices.
For now we expect prices to move lower towards 66.50 lev-
els in few trading sessions.
Currency Highlights
12th
May’2016
USDINR JPYINR
SEBI Certified – Research Analyst Equities I Commodities I Currencies I Mutual Funds
S3 S2 S1 Pivot R1 R2 R3
USDINR 66.33 66.61 66.71 66.89 66.99 67.17 67.45
JPYINR 61.14 61.33 61.40 61.52 61.59 61.71 61.90
3. Pivot levels for the Day
Currency Highlights
12th
May’2016
GBPINR EURINR
Technical View:
Price has been trading in ascending triangle pattern on 4
hourly chart and facing resistance of its upper band at 76.90
levels. The price has been trading in rising channel formation
and facing resistance of upper band of channel pattern at
77.50 levels. On the other hand, Pair has been trading below
its 50 hourly exponential moving average which indicates
that trend is remains down.
A momentum oscillator RSI have been trading below 60 lev-
els on daily chart which gives bearishness to the prices.
Moreover, momentum indicator MACD has shown negative
crossover on four hourly chart which support our bearish
view on the pair.
For now we expect prices should move lower towards 75.80
levels in the coming trading sessions.
Technical View:
The price has retested its falling channel pattern trend line at
96 level on 4 hourly chart. Moreover, price has formed bull-
ish engulfing pattern on daily chart ,which is followed by pos-
itive candle stick.
On the other hand, Pair has been trading above its 60 hourly
exponential moving average which indicates that short term
trend is remains bullish.
On daily chart, GBPINR has taken support of 61.80% Fibonac-
ci retracement from its previous rally of 94 to 98 levels. A
momentum oscillator RSI have been trading above 45 levels
on 4 hourly chart which gives bullishness to the prices.
Moreover, momentum indicator MACD has shown positive
signs on 4 hourly chart and traded above of its signal line
which support our bullish view on the pair.
SEBI Certified – Research Analyst Equities I Commodities I Currencies I Mutual Funds
S3 S2 S1 Pivot R1 R2 R3
GBPINR 95.28 95.91 96.16 96.54 96.79 97.17 97.80
EURINR 75.75 75.98 76.06 76.21 76.29 76.44 76.67
4. Currency Highlights
SEBI Certified – Research Analyst Equities I Commodities I Currencies I Mutual Funds
Economic Indicators
Date Time Data Prior Expected Impact
12.05.16 5:20am Current Account 1.73T 1.90T Actual > Forecast = Good for
currency; JPYINR
12.05.16 4:30pm BOE Inflation Report
12.05.16 4:30pm MPC Official Bank Rate Votes 0-0-9 0-0-9 Actual > Forecast = Good for
currency; GBPINR
12.05.16 4:30pm Monetary Policy Summary
12.05.16 4:30pm Official Bank Rate 0.50% 0.50% Actual > Forecast = Good for
currency; GBPINR
12.05.16 4:30pm Asset Purchase Facility 375B 375B Actual > Forecast = Good for
currency; GBPINR
12.05.16 4:30pm MPC Asset Purchase Facility
Votes
0-0-9 0-0-9 Actual > Forecast = Good for
currency; GBPINR
12.05.16 5:15pm BOE Gov Carney Speaks
12.05.16 6:00pm Unemployment Claims 274K 277K Actual > Forecast = Good for
currency; USDINR
12.05.16 6:00pm Import Prices m/m 0.2% 0.6% Actual > Forecast = Good for
currency; USDINR
12.05.16 12th-13th Mortgage Delinquencies 4.77% Actual > Forecast = Good for
currency; USDINR
12.05.16 9:15pm FOMC Member Rosengren
Speaks
12.05.16 11:00pm FOMC Member George Speaks
12th
May’2016
5. Currency Highlights
12th
May’2016
SEBI Certified – Research Analyst Equities I Commodities I Currencies I Mutual Funds
Amit Pathania
Digitally signed by Amit Pathania
DN: cn=Amit Pathania, o=Choice Equity Broking Pvt. ltd, ou=Research
Department, email=amit.pathania@choiceindia.com, c=IN
Date: 2016.05.12 08:43:04 +05'30'