
Recommended
More Related Content
What's hot
What's hot (20)
Similar to Currency high lights 09.06.16
Similar to Currency high lights 09.06.16 (19)
Recently uploaded
Recently uploaded (20)
Currency high lights 09.06.16
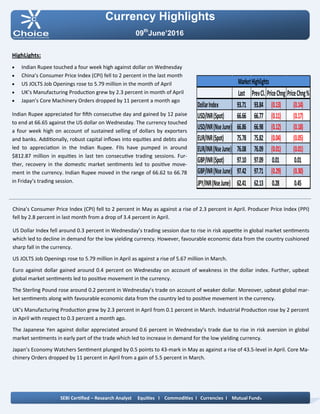
- 1. Currency Highlights 09th June’2016 HighLights: Indian Rupee touched a four week high against dollar on Wednesday China’s Consumer Price Index (CPI) fell to 2 percent in the last month US JOLTS Job Openings rose to 5.79 million in the month of April UK’s Manufacturing Production grew by 2.3 percent in month of April Japan’s Core Machinery Orders dropped by 11 percent a month ago Indian Rupee appreciated for fifth consecutive day and gained by 12 paise to end at 66.65 against the US dollar on Wednesday. The currency touched a four week high on account of sustained selling of dollars by exporters and banks. Additionally, robust capital inflows into equities and debts also led to appreciation in the Indian Rupee. FIIs have pumped in around $812.87 million in equities in last ten consecutive trading sessions. Fur- ther, recovery in the domestic market sentiments led to positive move- ment in the currency. Indian Rupee moved in the range of 66.62 to 66.78 in Friday’s trading session. China’s Consumer Price Index (CPI) fell to 2 percent in May as against a rise of 2.3 percent in April. Producer Price Index (PPI) fell by 2.8 percent in last month from a drop of 3.4 percent in April. US Dollar Index fell around 0.3 percent in Wednesday’s trading session due to rise in risk appetite in global market sentiments which led to decline in demand for the low yielding currency. However, favourable economic data from the country cushioned sharp fall in the currency. US JOLTS Job Openings rose to 5.79 million in April as against a rise of 5.67 million in March. Euro against dollar gained around 0.4 percent on Wednesday on account of weakness in the dollar index. Further, upbeat global market sentiments led to positive movement in the currency. The Sterling Pound rose around 0.2 percent in Wednesday’s trade on account of weaker dollar. Moreover, upbeat global mar- ket sentiments along with favourable economic data from the country led to positive movement in the currency. UK’s Manufacturing Production grew by 2.3 percent in April from 0.1 percent in March. Industrial Production rose by 2 percent in April with respect to 0.3 percent a month ago. The Japanese Yen against dollar appreciated around 0.6 percent in Wednesday’s trade due to rise in risk aversion in global market sentiments in early part of the trade which led to increase in demand for the low yielding currency. Japan’s Economy Watchers Sentiment plunged by 0.5 points to 43-mark in May as against a rise of 43.5-level in April. Core Ma- chinery Orders dropped by 11 percent in April from a gain of 5.5 percent in March. SEBI Certified – Research Analyst Equities I Commodities I Currencies I Mutual Funds Last PrevCl. PriceChng PriceChng% DollarIndex 93.71 93.84 (0.13) (0.14) USD/INR(Spot) 66.66 66.77 (0.11) (0.17) USD/INR(NseJune) 66.86 66.98 (0.12) (0.18) EUR/INR(Spot) 75.78 75.82 (0.04) (0.05) EUR/INR(NseJune) 76.08 76.09 (0.01) (0.01) GBP/INR(Spot) 97.10 97.09 0.01 0.01 GBP/INR(NseJune) 97.42 97.71 (0.29) (0.30) JPY/INR(NseJune) 62.41 62.13 0.28 0.45 MarketHighlights
- 2. Technical View: The JPYINR price has been trading in rectangle pattern form past few weeks and prices are facing resistance of its upper band of channel pattern at 62.50 levels on hourly chart. In addition, on four hourly chart price has formed hanging man candle stick pattern , which is bearish reversal pattern. On hourly chart, momentum oscillator RSI has moved below 60 levels, which gives negative confirmation to the prices. A momentum indicator MACD has shown negative crossover on hourly chart, which indicates short term trend remains bearish. For now we expect prices to move lower towards 61.70 levels in few trading sessions. Pivot levels for the Day Technical View: The price has been moving in its rising channel formation from past few weeks and price has given breakdown of its of its lower band of channel pattern at 67.10 levels on daily chart. Moreover, price have been trading below of its 21 daily expo- nential moving average which suggest near term trend re- mains down. So any rally in the prices towards 67.20 level, used as selling opportunity. A momentum indicator RSI has moved below 60 levels on daily chart, which suggest bearishness in the prices. A momentum indictor MACD has given negative crossover on daily chart, which gives negative confirmation to the prices. For now we expect prices to move lower towards 66.50 lev- els in few trading sessions. Currency Highlights 09th June’2016 USDINR JPYINR SEBI Certified – Research Analyst Equities I Commodities I Currencies I Mutual Funds S3 S2 S1 Pivot R1 R2 R3 USDINR 66.62 66.76 66.81 66.90 66.95 67.04 67.18 JPYINR 61.86 62.11 62.12 62.36 62.37 62.61 62.86
- 3. Pivot levels for the Day Currency Highlights 09th June’2016 GBPINR EURINR Technical View: The pair has given breakdown of its symmetrical triangle pattern at 76.10 levels on daily chart. Now, the price has re- tested the breakdown trend line at 76.30 levels. On the other hand, Pair has been trading below its 21 half hourly exponential moving average which indicates that trend is remains negative. A momentum oscillator RSI have been trading below 60 lev- els on hourly chart which gives the signs of bearishness to the prices. Moreover, momentum indicator MACD has shown negative crossover on hourly chart which support our bearish view on the pair. For now we expect prices should move lower towards 75.65 levels in the coming trading sessions. Technical View: The prices have been moving in rising channel formation form past few weeks and price has taken support of its low- er band of its channel pattern at 97 levels on daily chart. The pair has formed Moring star candle stick pattern on daily chart, which is bullish pattern. On the other hand, Pair has been trading above its 50 hourly exponential moving average which indicates that medium term trend is remains bullish. A momentum indicator RSI has moved above 45 levels on daily chart, which suggest bullishness in the prices. Moreover, momentum indicator MACD has shown positive crossover on 4 hourly chart which support our bullish view on the pair. For now we expect prices should move higher towards 98 levels in the coming trading sessions. SEBI Certified – Research Analyst Equities I Commodities I Currencies I Mutual Funds S3 S2 S1 Pivot R1 R2 R3 GBPINR 95.38 96.53 97.11 97.68 98.26 98.83 99.98 EURINR 75.76 75.97 76.05 76.18 76.26 76.39 76.60
- 4. Currency Highlights SEBI Certified – Research Analyst Equities I Commodities I Currencies I Mutual Funds Economic Indicators Date Time Data Prior Expected Impact 09.06.16 All Day China Bank Holiday 09.06.16 7:00am CPI y/y 2.3% 2.3% Actual > Forecast = Good for currency; Yuan 09.06.16 7:00am PPI y/y -3.4% -3.1% Actual > Forecast = Good for currency; Yuan 09.06.16 12:30pm ECB President Draghi Speaks 09.06.16 2:00pm Goods Trade Balance -11.2B -11.1B Actual > Forecast = Good for currency; GBPINR 09.06.16 6:00pm Unemployment Claims 267K 269K Actual > Forecast = Good for currency; USDINR 09th June’2016
- 5. Currency Highlights 09th June’2016 SEBI Certified – Research Analyst Equities I Commodities I Currencies I Mutual Funds Amit Pathania Digitally signed by Amit Pathania DN: cn=Amit Pathania, o=Choice Equity Broking Pvt. ltd, ou=Research Department, email=amit.pathania@choiceindia.com, c=IN Date: 2016.06.09 08:47:50 +05'30'