
Recommended
More Related Content
What's hot
What's hot (20)
Similar to Currency high lights 15.03.17
Similar to Currency high lights 15.03.17 (19)
Recently uploaded
Recently uploaded (20)
Currency high lights 15.03.17
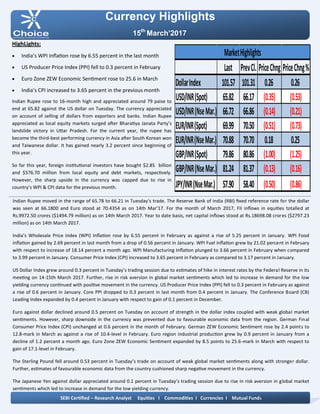
- 1. Currency Highlights 15th March’2017 HighLights: India’s WPI Inflation rose by 6.55 percent in the last month US Producer Price Index (PPI) fell to 0.3 percent in February Euro Zone ZEW Economic Sentiment rose to 25.6 in March India’s CPI increased to 3.65 percent in the previous month Indian Rupee rose to 16-month high and appreciated around 79 paise to end at 65.82 against the US dollar on Tuesday. The currency appreciated on account of selling of dollars from exporters and banks. Indian Rupee appreciated as local equity markets surged after Bharatiya Janata Party’s landslide victory in Uttar Pradesh. For the current year, the rupee has become the third-best performing currency in Asia after South Korean won and Taiwanese dollar. It has gained nearly 3.2 percent since beginning of this year. So far this year, foreign institutional investors have bought $2.85 billion and $576.70 million from local equity and debt markets, respectively. However, the sharp upside in the currency was capped due to rise in country’s WPI & CPI data for the previous month. Indian Rupee moved in the range of 65.78 to 66.21 in Tuesday’s trade. The Reserve Bank of India (RBI) fixed reference rate for the dollar was seen at 66.1800 and Euro stood at 70.4354 as on 14th Mar’17. For the month of March 2017, FII inflows in equities totalled at Rs.9972.50 crores ($1494.79 million) as on 14th March 2017. Year to date basis, net capital inflows stood at Rs.18698.08 crores ($2797.23 million) as on 14th March 2017. India’s Wholesale Price Index (WPI) Inflation rose by 6.55 percent in February as against a rise of 5.25 percent in January. WPI Food inflation gained by 2.69 percent in last month from a drop of 0.56 percent in January. WPI Fuel inflation grew by 21.02 percent in February with respect to increase of 18.14 percent a month ago. WPI Manufacturing Inflation plunged to 3.66 percent in February when compared to 3.99 percent in January. Consumer Price Index (CPI) increased to 3.65 percent in February as compared to 3.17 percent in January. US Dollar Index grew around 0.3 percent in Tuesday’s trading session due to estimates of hike in interest rates by the Federal Reserve in its meeting on 14-15th March 2017. Further, rise in risk aversion in global market sentiments which led to increase in demand for the low yielding currency continued with positive movement in the currency. US Producer Price Index (PPI) fell to 0.3 percent in February as against a rise of 0.6 percent in January. Core PPI dropped to 0.3 percent in last month from 0.4 percent in January. The Conference Board (CB) Leading Index expanded by 0.4 percent in January with respect to gain of 0.1 percent in December. Euro against dollar declined around 0.5 percent on Tuesday on account of strength in the dollar index coupled with weak global market sentiments. However, sharp downside in the currency was prevented due to favourable economic data from the region. German Final Consumer Price Index (CPI) unchanged at 0.6 percent in the month of February. German ZEW Economic Sentiment rose by 2.4 points to 12.8-mark in March as against a rise of 10.4-level in February. Euro region industrial production grew by 0.9 percent in January from a decline of 1.2 percent a month ago. Euro Zone ZEW Economic Sentiment expanded by 8.5 points to 25.6-mark in March with respect to gain of 17.1-level in February. The Sterling Pound fell around 0.53 percent in Tuesday’s trade on account of weak global market sentiments along with stronger dollar. Further, estimates of favourable economic data from the country cushioned sharp negative movement in the currency. The Japanese Yen against dollar appreciated around 0.1 percent in Tuesday’s trading session due to rise in risk aversion in global market sentiments which led to increase in demand for the low yielding currency. SEBI Certified – Research Analyst Equities I Commodities I Currencies I Mutual Funds Last PrevCl. PriceChng PriceChng% DollarIndex 101.57 101.31 0.26 0.26 USD/INR(Spot) 65.82 66.17 (0.35) (0.53) USD/INR(NseMar.) 66.72 66.86 (0.14) (0.21) EUR/INR(Spot) 69.99 70.50 (0.51) (0.73) EUR/INR(NseMar.) 70.88 70.70 0.18 0.25 GBP/INR(Spot) 79.86 80.86 (1.00) (1.25) GBP/INR(NseMar.) 81.24 81.37 (0.13) (0.16) JPY/INR(NseMar.) 57.90 58.40 (0.50) (0.86) MarketHighlights
- 2. Technical View: On a daily chart, the pair has given a breakdown of its rising channel pattern at 59.10 levels. The pair has shown a breakdown of its rising trend line at 59.20 levels on a daily chart. Moreover, prices have been trading below its 50 DSMA which gives the sign of bearishness in the prices. On daily chart momentum indicator, RSI is trading below 50 levels which indicate more downside momentum can be seen in the prices. In addition, momentum indicator MACD has shown negative crossover which suggests a lack of strength in the prices on a daily chart. So for trading perspective, one can sell JPYINR in the range of 57.60 with SL of 57.90 for the target of 57 levels. Pivot levels for the Day Technical View: The pair has given a breakdown of its rising trend line at 66.80 levels on a daily chart. Moreover, prices have been trading above its 50 DSMA which gives the sign of bearishness in the prices. Furthermore, the price has shown a breakdown of its consolidation range from 67.40 to 66.80 levels on a daily chart. A momentum indicator RSI has remained below 45 levels, which suggest further negative momentum can be seen in the prices. In addition, momentum indicator MACD has shown negative crossover and moving below its signal line on a daily chart. So for trading perspective, one can sell USDINR in the range of 66.05 with SL of 66.30 for the target of 65.50 levels. Currency Highlights 15th March’2017 USDINR JPYINR SEBI Certified – Research Analyst Equities I Commodities I Currencies I Mutual Funds S3 S2 S1 Pivot R1 R2 R3 USDINR 65.18 65.63 65.80 66.08 66.25 66.53 66.98 JPYINR 56.60 57.08 57.26 57.56 57.74 58.04 58.52
- 3. Pivot levels for the Day Currency Highlights 15th March’2017 GBPINR EURINR Technical View: On a daily chart, prices have been trading in falling channel pattern from past few weeks and price has taken the support of its lower band of channel pattern at 70.60 levels. The price has taken the support of its horizontal trend line at 70.30 levels o daily chart. The pair has been trading above its 10 HSMA on the hourly chart, which suggests further positive momentum can be seen in the prices. On daily chart momentum oscillator, RSI has been taking support at 35 levels on a daily chart, which suggests bullishness in the prices. A momentum indicator MACD has shown positive crossover on the hourly chart, which supports our bullish view on the prices. For now, we can expect prices should move higher towards 70.80 levels in the coming trading session. Technical View: The pair has been trading in symmetrical triangle formation from past few weeks and price has given a breakdown of its lower band of the pattern at 82.60 levels on a daily chart. Moreover, prices have been trading below 21 DSMA, which suggest short term trend looks down. Moreover, momentum indicator MACD has given negative crossover on a daily chart, which gives the sign of bearishness in the prices. The momentum indicator RSI has been trading below 50 levels on the daily chart, which suggest the possibilities of further downside momentum in the prices. For now, we expect prices should move lower towards 79.70 levels in the coming trading sessions. SEBI Certified – Research Analyst Equities I Commodities I Currencies I Mutual Funds S3 S2 S1 Pivot R1 R2 R3 GBPINR 78.34 79.38 79.74 80.42 80.78 81.46 82.50 EURINR 69.06 69.72 69.98 70.38 70.64 71.04 71.70
- 4. Currency Highlights SEBI Certified – Research Analyst Equities I Commodities I Currencies I Mutual Funds 15th March’2017 Economic Indicators Date Time Data Prior Expected Impact 15.03.17 03:00 PM Average Earnings Index 3m/y 2.6% 2.4% Actual > Forecast = Good for currency; GBPINR 15.03.17 06:00 PM CPI m/m 0.6% 0.0% Actual > Forecast = Good for currency; USDINR 15.03.17 06:00 PM Core CPI m/m 0.3% 0.2% Actual > Forecast = Good for currency; USDINR 15.03.17 06:00 PM Core Retail Sales m/m 0.8% 0.1% Actual > Forecast = Good for currency; USDINR 15.03.17 06:00 PM Retail Sales m/m 0.4% 0.2% Actual > Forecast = Good for currency; USDINR 15.03.17 08:00 PM Crude Oil Inventories 8.2M 15.03.17 11:30 PM FOMC Economic Projections More hawkish than expected = Good for currency; USDINR 15.03.17 11:30 PM FOMC Statement More hawkish than expected = Good for currency; USDINR 15.03.17 11:30 PM Federal Funds Rate More hawkish than expected = Good for currency; USDINR
- 5. Currency Highlights 15th March’2017 SEBI Certified – Research Analyst Equities I Commodities I Currencies I Mutual Funds Anish Vyas Digitally signed by Anish Vyas DN: cn=Anish Vyas, o=Choice Merchandise Broking Pvt. Ltd, ou=Sr. Research Associate, email=anish.vyas@choiceindia.com, c=IN Date: 2017.03.15 09:43:18 +05'30'