
Recommended
More Related Content
What's hot
What's hot (20)
Viewers also liked
Similar to Currency high lights 07.10.16
Similar to Currency high lights 07.10.16 (20)
Recently uploaded
Recently uploaded (20)
Currency high lights 07.10.16
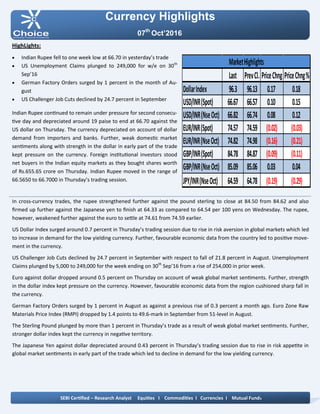
- 1. Currency Highlights 07th Oct’2016 HighLights: Indian Rupee fell to one week low at 66.70 in yesterday’s trade US Unemployment Claims plunged to 249,000 for w/e on 30th Sep’16 German Factory Orders surged by 1 percent in the month of Au- gust US Challenger Job Cuts declined by 24.7 percent in September Indian Rupee continued to remain under pressure for second consecu- tive day and depreciated around 19 paise to end at 66.70 against the US dollar on Thursday. The currency depreciated on account of dollar demand from importers and banks. Further, weak domestic market sentiments along with strength in the dollar in early part of the trade kept pressure on the currency. Foreign institutional investors stood net buyers in the Indian equity markets as they bought shares worth of Rs.655.65 crore on Thursday. Indian Rupee moved in the range of 66.5650 to 66.7000 in Thursday’s trading session. In cross-currency trades, the rupee strengthened further against the pound sterling to close at 84.50 from 84.62 and also firmed up further against the Japanese yen to finish at 64.33 as compared to 64.54 per 100 yens on Wednesday. The rupee, however, weakened further against the euro to settle at 74.61 from 74.59 earlier. US Dollar Index surged around 0.7 percent in Thursday’s trading session due to rise in risk aversion in global markets which led to increase in demand for the low yielding currency. Further, favourable economic data from the country led to positive move- ment in the currency. US Challenger Job Cuts declined by 24.7 percent in September with respect to fall of 21.8 percent in August. Unemployment Claims plunged by 5,000 to 249,000 for the week ending on 30th Sep’16 from a rise of 254,000 in prior week. Euro against dollar dropped around 0.5 percent on Thursday on account of weak global market sentiments. Further, strength in the dollar index kept pressure on the currency. However, favourable economic data from the region cushioned sharp fall in the currency. German Factory Orders surged by 1 percent in August as against a previous rise of 0.3 percent a month ago. Euro Zone Raw Materials Price Index (RMPI) dropped by 1.4 points to 49.6-mark in September from 51-level in August. The Sterling Pound plunged by more than 1 percent in Thursday’s trade as a result of weak global market sentiments. Further, stronger dollar index kept the currency in negative territory. The Japanese Yen against dollar depreciated around 0.43 percent in Thursday’s trading session due to rise in risk appetite in global market sentiments in early part of the trade which led to decline in demand for the low yielding currency. SEBI Certified – Research Analyst Equities I Commodities I Currencies I Mutual Funds Last PrevCl. PriceChng PriceChng% DollarIndex 96.3 96.13 0.17 0.18 USD/INR(Spot) 66.67 66.57 0.10 0.15 USD/INR(NseOct) 66.82 66.74 0.08 0.12 EUR/INR(Spot) 74.57 74.59 (0.02) (0.03) EUR/INR(NseOct) 74.82 74.98 (0.16) (0.21) GBP/INR(Spot) 84.78 84.87 (0.09) (0.11) GBP/INR(NseOct) 85.09 85.06 0.03 0.04 JPY/INR(NseOct) 64.59 64.78 (0.19) (0.29) MarketHighlights
- 2. Technical View: On daily chart JPYINR prices have been trading in sym- metrical triangle pattern and shown breakdown of its symmetrical triangle pattern. However, price has formed bearish candle stick on daily chart. Moreover, breakdown can be seen in the prices with bol- stering volumes. Furthermore, prices have been trading below its 21 DE- MA, which suggest short term trend is negative. On daily chart momentum indicator RSI is trading below at 45 levels which suggest further weakness in the pric- es. So for trading perspective, one could use sell in the range of 65.10 with SL of 66.50 for Target of 64.60. lev- els. Pivot levels for the Day Technical View: On daily USDINR prices have been trading in falling channel formation from past few weeks. The pair has formed bearish candle stick with appealing volumes. On the other hand, prices have been facing resistance of falling trend line at 66.85 levels on daily chart. On the other hand, prices have been facing resistance of its upper band of channel pattern at 67.10 levels on dai- ly. Moreover, prices have been trading below 21 DEMA which gives the sign of bearishness in the prices. A momentum indictor RSI has traded below 60 levels, which suggest further weakness in the prices. So for trading perspective, one could sell in range 66.85 with SL of 67.10 for target of 66.20 Currency Highlights 07th Oct’2016 USDINR JPYINR SEBI Certified – Research Analyst Equities I Commodities I Currencies I Mutual Funds S3 S2 S1 Pivot R1 R2 R3 USDINR 66.53 66.66 66.74 66.79 66.87 66.92 67.05 JPYINR 64.11 64.33 64.45 64.55 64.67 64.77 64.99
- 3. Pivot levels for the Day Currency Highlights 07th Oct’2016 GBPINR EURINR Technical View: The EURINR pair has been trading in rising channel pattern and price has shown breakdown of its rising channel pattern at 75 levels on daily chart. On daily chart EURINR price have been trading in de- scending triangle pattern from past months. Moreover, prices have been trading below its 21 DE- MA, which suggest short term trend is down. On daily chart momentum oscillator RSI have been trad- ing below 60 which suggest bearishness in the prices. A momentum indicator MACD has shown negative crossover on daily chart, which add more bearishness in the prices. For now we can expect prices should move lower to- wards 74.10 levels in the coming trading session. Technical View: On daily GBPINR price has been trading in falling chan- nel pattern and price has shown breakdown of its falling channel pattern at 86.50 levels on daily chart. Moreover, prices have been trading below 21 DEMA, which suggest short term trend remains weak. The price has given breakdown of horizontal trend line at 87.30 levels on daily chart. A momentum indicator MADC has given negative Cross over on daily chart, which gives the sign of bearishness in the prices. The momentum indictor RSI has been trading below 40 levels on daily chart. Which suggest lack of strength in the prices. For now we expect prices should move lower towards 84.40 levels coming trading sessions. SEBI Certified – Research Analyst Equities I Commodities I Currencies I Mutual Funds S3 S2 S1 Pivot R1 R2 R3 GBPINR 84.41 84.72 84.89 85.03 85.20 85.34 85.65 EURINR 74.55 74.69 74.76 74.83 74.90 74.97 75.11
- 4. Currency Highlights SEBI Certified – Research Analyst Equities I Commodities I Currencies I Mutual Funds 07th Oct’2016 Economic Indicators Date Time Data Prior Expected Impact 07.10.16 2:00 PM Manufacturing Production m/m -0.9% 0.4% Actual > Forecast = Good for currency; GBPINR 07.10.16 6:00 PM Average Hourly Earnings m/ m 0.1% 0.2% Actual >Forecast = Good for currency; USDINR 07.10.16 6:00 PM Non-Farm Employment Change 151K 171K Actual >Forecast = Good for currency; USDINR 07.10.16 6:00 PM Unemployment Rate 4.9% 4.9% Actual > Forecast = Good for currency; USDINR 07.10.16 6:00 PM Final Wholesale Inventories m/m -0.1% 0.1% Actual < Forecast = Good for currency; USDINR
- 5. Currency Highlights 07th Oct’2016 SEBI Certified – Research Analyst Equities I Commodities I Currencies I Mutual Funds Amit Pathania Digitally signed by Amit Pathania DN: cn=Amit Pathania, o=Choice Equity Broking Pvt. ltd, ou=Research Department, email=amit.pathania@choiceindia.com, c=IN Date: 2016.10.07 09:13:48 +05'30'