
Recommended
More Related Content
What's hot
What's hot (20)
Viewers also liked
Viewers also liked (17)
Similar to Currency high lights 08.11.16
Similar to Currency high lights 08.11.16 (18)
Recently uploaded
Recently uploaded (20)
Currency high lights 08.11.16
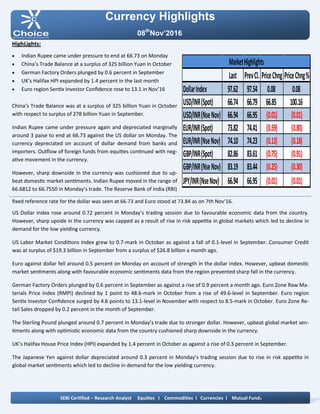
- 1. Currency Highlights 08th Nov’2016 HighLights: Indian Rupee came under pressure to end at 66.73 on Monday China’s Trade Balance at a surplus of 325 billion Yuan in October German Factory Orders plunged by 0.6 percent in September UK’s Halifax HPI expanded by 1.4 percent in the last month Euro region Sentix Investor Confidence rose to 13.1 in Nov’16 China’s Trade Balance was at a surplus of 325 billion Yuan in October with respect to surplus of 278 billion Yuan in September. Indian Rupee came under pressure again and depreciated marginally around 3 paise to end at 66.73 against the US dollar on Monday. The currency depreciated on account of dollar demand from banks and importers. Outflow of foreign funds from equities continued with neg- ative movement in the currency. However, sharp downside in the currency was cushioned due to up- beat domestic market sentiments. Indian Rupee moved in the range of 66.6812 to 66.7550 in Monday’s trade. The Reserve Bank of India (RBI) fixed reference rate for the dollar was seen at 66.73 and Euro stood at 73.84 as on 7th Nov’16. US Dollar Index rose around 0.72 percent in Monday’s trading session due to favourable economic data from the country. However, sharp upside in the currency was capped as a result of rise in risk appetite in global markets which led to decline in demand for the low yielding currency. US Labor Market Conditions Index grew to 0.7-mark in October as against a fall of 0.1-level in September. Consumer Credit was at surplus of $19.3 billion in September from a surplus of $26.8 billion a month ago. Euro against dollar fell around 0.5 percent on Monday on account of strength in the dollar index. However, upbeat domestic market sentiments along with favourable economic sentiments data from the region prevented sharp fall in the currency. German Factory Orders plunged by 0.6 percent in September as against a rise of 0.9 percent a month ago. Euro Zone Raw Ma- terials Price Index (RMPI) declined by 1 point to 48.6-mark in October from a rise of 49.6-level in September. Euro region Sentix Investor Confidence surged by 4.6 points to 13.1-level in November with respect to 8.5-mark in October. Euro Zone Re- tail Sales dropped by 0.2 percent in the month of September. The Sterling Pound plunged around 0.7 percent in Monday’s trade due to stronger dollar. However, upbeat global market sen- timents along with optimistic economic data from the country cushioned sharp downside in the currency. UK’s Halifax House Price Index (HPI) expanded by 1.4 percent in October as against a rise of 0.3 percent in September. The Japanese Yen against dollar depreciated around 0.3 percent in Monday’s trading session due to rise in risk appetite in global market sentiments which led to decline in demand for the low yielding currency. SEBI Certified – Research Analyst Equities I Commodities I Currencies I Mutual Funds Last PrevCl. PriceChng PriceChng% DollarIndex 97.62 97.54 0.08 0.08 USD/INR(Spot) 66.74 66.79 66.85 100.16 USD/INR(NseNov) 66.94 66.95 (0.01) (0.01) EUR/INR(Spot) 73.82 74.41 (0.59) (0.80) EUR/INR(NseNov) 74.10 74.23 (0.13) (0.18) GBP/INR(Spot) 82.86 83.61 (0.75) (0.91) GBP/INR(NseNov) 83.19 83.44 (0.25) (0.30) JPY/INR(NseNov) 66.94 66.95 (0.01) (0.01) MarketHighlights
- 2. Technical View: On daily chart JPYINR prices have been trading in sym- metrical triangle pattern and price has taken support of its lower band at 64.10 levels. Moreover, price has taken support of its horizontal trend line at 64.50 levels on daily chart. Furthermore, prices have been trading above its 50 DE- MA, which suggest short term trend is positive. On daily chart momentum indicator RSI is trading above 55 levels which suggest further bullishness can be seen in the prices. In addition, momentum indicator MACD has shown posi- tive crossover on daily chart. So for trading perspective, one could use buy in the range of 64.05 with SL of 63.70 for target of 65.60 levels. Pivot levels for the Day Technical View: The pair has been trading in falling channel pattern from past few months and prices have been facing resistance of its upper band at 67.30 levels on daily chart. On daily USDINR prices have been facing resistance of its falling trend line at 67.30 levels. On the other hand, prices have been facing resistance of falling trend line at 67.20 levels on daily chart. Moreover, prices have been trading below 21 HEMA which gives the sign of bearishness in the prices. A momentum indictor RSI has traded below 60 levels, which suggest further weakness in the prices. In addition, momentum indicator MACD has shown neg- ative crossover on daily chart. So for trading perspective, one could sell in range 67.05 with SL of 67.40 for target of 66.40. Currency Highlights 08th Nov’2016 USDINR JPYINR SEBI Certified – Research Analyst Equities I Commodities I Currencies I Mutual Funds S3 S2 S1 Pivot R1 R2 R3 USDINR 66.72 66.82 66.88 66.92 66.98 67.02 67.12 JPYINR 63.51 63.83 63.98 64.15 64.30 64.47 64.79
- 3. Pivot levels for the Day Currency Highlights 08th Nov’2016 GBPINR EURINR Technical View: The EURINR pair has been trading in falling channel pattern and prices have been taking support of its lower band of channel pattern at 73.20 levels on daily chart. On the other hand price has taken support of its hori- zontal trend line at 73.80 levels on daily chart. Moreover, prices have been trading above its 25 DE- MA, which suggest short term trend is up. On daily chart momentum oscillator RSI have been trad- ing above 50 which suggest bullishness in the prices. A momentum indicator MACD has shown positive cross- over on daily chart, which add more bullishness in the prices. For now we can expect prices should move higher to- wards 74.90 levels in the coming trading session. Technical View: The pair has been trading in falling channel pattern form pas few months and price has given breakout of its channel pattern at 83 levels on daily chart. Moreo- ver, prices have been trading below 25 DEMA, which suggest short term trend looks positive. The price has formed bullish hammer candle stick pattern on daily chart, which is bullish pattern. A momentum indicator MADC has given positive Cross over on hourly chart, which gives the sign of bullishness in the prices. The momentum indictor RSI has been trading above 50levels on daily chart, which suggest the possibilities of bounce back in the in the prices. For now we expect prices should move higher towards 84 levels coming trading sessions. SEBI Certified – Research Analyst Equities I Commodities I Currencies I Mutual Funds S3 S2 S1 Pivot R1 R2 R3 GBPINR 81.31 82.34 82.76 83.37 83.79 84.40 85.43 EURINR 73.63 73.87 73.98 74.11 74.22 74.35 74.59
- 4. Currency Highlights SEBI Certified – Research Analyst Equities I Commodities I Currencies I Mutual Funds 08th Nov’2016 Economic Indicators Date Time Data Prior Expected Impact 08.11.16 Tentative Trade Balance 278B 366B Actual > Forecast = Good for currency; CNY 08.11.16 Tentative USD-Denominated Trade Balance 42.0B 51.98B Actual > Forecast = Good for currency; CNY 08.11.16 03:00 PM Manufacturing Production m/m 0.2% 0.5% Actual > Forecast = Good for currency; GBPINR 08.11.16 08:30 PM JOLTS Job Openings 5.44M 5.67M Actual > Forecast = Good for currency; USDINR 08.11.16 All Day Presidential Election
- 5. Currency Highlights 08th Nov’2016 SEBI Certified – Research Analyst Equities I Commodities I Currencies I Mutual Funds Anish Vyas Digitally signed by Anish Vyas DN: cn=Anish Vyas, o=Choice Merchandise Broking Pvt. Ltd, ou=Sr. Research Associate, email=anish.vyas@choiceindia.com, c=IN Date: 2016.11.08 08:59:24 +05'30'