
Recommended
More Related Content
What's hot
What's hot (20)
Similar to Currency high lights 20.05.16
Similar to Currency high lights 20.05.16 (19)
Recently uploaded
Recently uploaded (20)
Currency high lights 20.05.16
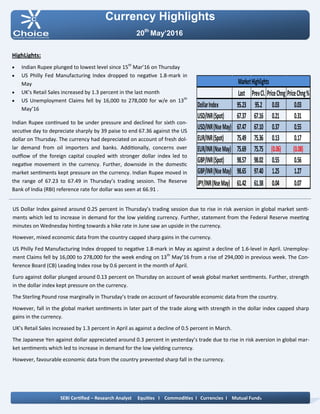
- 1. Currency Highlights 20th May’2016 HighLights: Indian Rupee plunged to lowest level since 15th Mar’16 on Thursday US Philly Fed Manufacturing Index dropped to negative 1.8-mark in May UK’s Retail Sales increased by 1.3 percent in the last month US Unemployment Claims fell by 16,000 to 278,000 for w/e on 13th May’16 Indian Rupee continued to be under pressure and declined for sixth con- secutive day to depreciate sharply by 39 paise to end 67.36 against the US dollar on Thursday. The currency had depreciated on account of fresh dol- lar demand from oil importers and banks. Additionally, concerns over outflow of the foreign capital coupled with stronger dollar index led to negative movement in the currency. Further, downside in the domestic market sentiments kept pressure on the currency. Indian Rupee moved in the range of 67.23 to 67.49 in Thursday’s trading session. The Reserve Bank of India (RBI) reference rate for dollar was seen at 66.91 . US Dollar Index gained around 0.25 percent in Thursday’s trading session due to rise in risk aversion in global market senti- ments which led to increase in demand for the low yielding currency. Further, statement from the Federal Reserve meeting minutes on Wednesday hinting towards a hike rate in June saw an upside in the currency. However, mixed economic data from the country capped sharp gains in the currency. US Philly Fed Manufacturing Index dropped to negative 1.8-mark in May as against a decline of 1.6-level in April. Unemploy- ment Claims fell by 16,000 to 278,000 for the week ending on 13th May’16 from a rise of 294,000 in previous week. The Con- ference Board (CB) Leading Index rose by 0.6 percent in the month of April. Euro against dollar plunged around 0.13 percent on Thursday on account of weak global market sentiments. Further, strength in the dollar index kept pressure on the currency. The Sterling Pound rose marginally in Thursday’s trade on account of favourable economic data from the country. However, fall in the global market sentiments in later part of the trade along with strength in the dollar index capped sharp gains in the currency. UK’s Retail Sales increased by 1.3 percent in April as against a decline of 0.5 percent in March. The Japanese Yen against dollar appreciated around 0.3 percent in yesterday’s trade due to rise in risk aversion in global mar- ket sentiments which led to increase in demand for the low yielding currency. However, favourable economic data from the country prevented sharp fall in the currency. SEBI Certified – Research Analyst Equities I Commodities I Currencies I Mutual Funds Last PrevCl. PriceChng PriceChng% DollarIndex 95.23 95.2 0.03 0.03 USD/INR(Spot) 67.37 67.16 0.21 0.31 USD/INR(NseMay) 67.47 67.10 0.37 0.55 EUR/INR(Spot) 75.49 75.36 0.13 0.17 EUR/INR(NseMay) 75.69 75.75 (0.06) (0.08) GBP/INR(Spot) 98.57 98.02 0.55 0.56 GBP/INR(NseMay) 98.65 97.40 1.25 1.27 JPY/INR(NseMay) 61.42 61.38 0.04 0.07 MarketHighlights
- 2. Technical View: The JPYINR price has been taking support of rising trend line at 61 levels on hourly chart. Prices have been taking support of 50% Fibonacci retracement levels form its previous rally of 58 to 63 levels. Moreover, Pair has been trading above its 21 hourly exponen- tial moving average which suggest short term trend remains up. On hourly chart, momentum oscillator RSI has moved above its 45 levels, which gives positive confirmation to the prices. A momentum indicator MACD has shown positive crossover on hourly chart, which indicates short term trend remains Bullish. For now we expect prices to move higher towards 61.60 lev- els in coming trading sessions. Pivot levels for the Day Technical View: The price has shown breakout of its rectangle pattern triangle at 67 levels on daily chart with heavy volumes. The pair has given breakout of its head and shoulder neckline pattern at 67.05 levels on daily chart. Moreover, price have been trading above its 21 daily expo- nential moving average which suggest near term trend re- mains positive. So any dips in the prices lower towards 67.20 level, used as buying opportunity. A momentum indicator RSI has moved above 60 levels on daily chart, which suggest bullishness in the prices. Momentum indictor MACD has shown positive crossover and trading above single line on hourly chart, which gives posi- tive confirmation to the prices. For now we expect prices to move higher towards 67.70 lev- els in few trading sessions. Currency Highlights 20th May’2016 USDINR JPYINR SEBI Certified – Research Analyst Equities I Commodities I Currencies I Mutual Funds S3 S2 S1 Pivot R1 R2 R3 USDINR 66.79 67.08 67.28 67.37 67.57 67.66 67.95 JPYINR 60.44 60.87 61.13 61.30 61.56 61.73 62.16
- 3. Pivot levels for the Day Currency Highlights 20th May’2016 GBPINR EURINR Technical View: The pair has given breakdown of its rising trend line at 75.80 levels and price has retested the breakdown trend line at 75.80 levels. Price has given breakdown of its symmetrical triangle pattern on 4 hourly chart at 76 levels. On the other hand, Pair has been trading below its 50 hourly exponential moving average which indicates that trend is remains weak. A momentum oscillator RSI have been trading below 60 lev- els on 4 hourly chart which gives bearishness to the prices. Moreover, momentum indicator MACD has shown negative crossover on four hourly chart which support our bearish view on the pair. For now we expect prices should move lower towards 75.30 levels in the coming trading sessions. Technical View: The price has given breakout of its falling channel pattern with bolstering volumes on daily chart. Moreover, price has formed long bullish candle stick on daily chart which gives positive confirmation to the prices. On the other hand, Pair has been trading above its 21 hourly exponential moving average which indicates that short term trend is remains bullish. A momentum oscillator RSI have been trading above 60 lev- els on daily chart which gives bullishness to the prices. Moreover, momentum indicator MACD has shown positive crossover on daily chart and traded above of its signal line which support our bullish view on the pair. SEBI Certified – Research Analyst Equities I Commodities I Currencies I Mutual Funds S3 S2 S1 Pivot R1 R2 R3 GBPINR 96.70 97.57 98.12 98.44 98.99 99.31 100.18 EURINR 75.18 75.40 75.53 75.62 75.75 75.84 76.06
- 4. Currency Highlights SEBI Certified – Research Analyst Equities I Commodities I Currencies I Mutual Funds Economic Indicators Date Time Data Prior Expected Impact 20.05.16 Day 1 G7 Meetings 20.05.16 7:30pm Existing Home Sales 5.33M 5.40M Actual > Forecast = Good for currency; USDINR 20th May’2016
- 5. Currency Highlights 20th May’2016 SEBI Certified – Research Analyst Equities I Commodities I Currencies I Mutual Funds Amit Pathania Digitally signed by Amit Pathania DN: cn=Amit Pathania, o=Choice Equity Broking Pvt. ltd, ou=Research Department, email=amit.pathania@choiceindia.com, c=IN Date: 2016.05.20 08:43:55 +05'30'