
Recommended
More Related Content
What's hot
What's hot (20)
Viewers also liked
Viewers also liked (20)
Similar to Aaj ka trend 11.05.16
Similar to Aaj ka trend 11.05.16 (20)
Recently uploaded
Recently uploaded (20)
Aaj ka trend 11.05.16
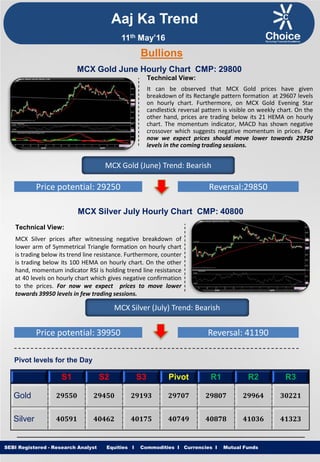
- 1. Equities I Commodities I Currencies I Mutual Funds Aaj Ka Trend Technical View: It can be observed that MCX Gold prices have given breakdown of its Rectangle pattern formation at 29607 levels on hourly chart. Furthermore, on MCX Gold Evening Star candlestick reversal pattern is visible on weekly chart. On the other hand, prices are trading below its 21 HEMA on hourly chart. The momentum indicator, MACD has shown negative crossover which suggests negative momentum in prices. For now we expect prices should move lower towards 29250 levels in the coming trading sessions. SEBI Registered - Research Analyst Equities I Commodities I Currencies I Mutual Funds Bullions MCX Gold June Hourly Chart CMP: 29800 MCX Gold (June) Trend: Bearish Price potential: 29250 Reversal:29850 MCX Silver July Hourly Chart CMP: 40800 Technical View: MCX Silver prices after witnessing negative breakdown of lower arm of Symmetrical Triangle formation on hourly chart is trading below its trend line resistance. Furthermore, counter is trading below its 100 HEMA on hourly chart. On the other hand, momentum indicator RSI is holding trend line resistance at 40 levels on hourly chart which gives negative confirmation to the prices. For now we expect prices to move lower towards 39950 levels in few trading sessions. MCX Silver (July) Trend: Bearish Price potential: 39950 Reversal: 41190 Pivot levels for the Day S1 S2 S3 Pivot R1 R2 R3 Gold 29550 29450 29193 29707 29807 29964 30221 Silver 40591 40462 40175 40749 40878 41036 41323 11th May’16
- 2. Equities I Commodities I Currencies I Mutual Funds Technical View: MCX Copper Prices have witnessed breakdown of its consolidation formation at 312.25 on hourly charts. However, MCX Copper prices is trading below its 50 HEMA on hourly chart which indicates short term trend remains down. Furthermore counter is trading in Falling Channel formation on hourly chart. On the other hand, momentum indicator RSI has moved below 40 levels on hourly chart which gives negative confirmation to the prices. For now we expect prices to move lower towards 303 levels in coming trading sessions. SEBI Registered - Research Analyst Equities I Commodities I Currencies I Mutual Funds MCX Copper June hourly Chart CMP: 312.15 MCX Copper (June) Trend: Bearish Price potential: 303 Reversal: 317 MCX Crude Oil May. Hourly Chart CMP: 2969 Technical View: MCX Crude Oil prices are trading in Descending Channel formation on hourly time frame. On Weekly chart, the MCX Crude Oil price has completed a “Bearish White Swan Harmonic Pattern” at 3115 levels. Moreover, counter is trading below its 100 HEMA on hourly chart. On the other hand, momentum indicator RSI is facing resistance at 60 levels on hourly chart which gives negative confirmation to the prices. For now we expect prices to move lower towards 2875 levels in coming trading sessions. MCX Crude Oil (May) Trend: Bearish Price potential: 2875 Reversal: 3015 Pivot levels for the Day S1 S2 S3 Pivot R1 R2 R3 Copper 310.8 309.1 304.9 313.3 315.0 317.5 321.7 Crude 2907 2851 2761 2941 2997 3031 3121 Base Metal Energy Aaj Ka Trend 11th May’16
- 3. Equities I Commodities I Currencies I Mutual FundsSEBI Registered - Research Analyst Equities I Commodities I Currencies I Mutual Funds Other Base Metals & Energy S1 S2 S3 Pivot R1 R2 R3 Trend Copper 310.8 309.1 304.9 313.3 315.0 317.5 321.7 Aluminum 103.1 102.6 101.5 103.8 104.2 104.9 106.1 Lead 116.1 115.2 113.7 116.7 117.6 118.2 119.7 Nickel 578.6 572.6 562.1 583.1 589.1 593.6 604.1 Zinc 122.7 122.2 121.2 123.2 123.7 124.2 125.2 Natural Gas 140.8 137.9 132.8 143.0 145.9 148.1 153.2 Fundamental News: Gold prices gained slightly in Asia on Tuesday after mixed consumer and producer price data from China. Gold futures held steady in European trade on Tuesday, after falling to the lowest level in almost two weeks overnight, as investors continued to monitor movements in the U.S. dollar. Gold futures struggled near the lowest level in almost two weeks in North American trade on Tuesday, as investors continued to monitor movements in the U.S. dollar. Iran has set its June official selling prices (OSPs) for heavier crude grades it sells to Asia at the biggest discounts to Saudi and Iraqi oil since 2007-2008, raising the stakes in its fight to regain market share. Internal differences are killing OPEC and its ability to influence the markets has all but evaporated, top Russian oil executive Igor Sachem told Reuters in some of his harshest remarks ever about the oil cartel. Oil rose on Tuesday, boosted by supply disruptions in Canada and elsewhere that have knocked out 2.5 million barrels of daily production and temporarily eclipsed concern over high global inventories and a looming surplus of refined products. Oil prices were higher in North American trade on Tuesday, after flipping between gains and losses overnight, as investors looked ahead to fresh weekly information on U.S. stockpiles of crude and refined products. U.S. natural gas futures rose sharply on Tuesday, as forecasts for late this week and early next week turned cooler, boosting near-term demand expectations for the heating fuel. Aaj Ka Trend 11th May’16
- 4. Equities I Commodities I Currencies I Mutual FundsSEBI Registered - Research Analyst Equities I Commodities I Currencies I Mutual Funds International Market Commodity Closing Price Gold 1267.60 Silver 17.18 Crude Oil 44.65 Brent Crude Oil 45.53 Natural Gas 2.17 COMEX/NYMEX/ICE ( Precious Metals & Energy) Currency & Commodity Index Currency (Spot) Current Price USD / INR 66.67 Dollar Index 94.22 EUR / USD 1.1374 CRB Index* 180.28 Closing as on 10.05.16 *Closing as on 10.05.16 LME (Base Metals) ( $ per tones) Commodity Closing Price Copper 4680 Aluminum 1554 Zinc 1848 Lead 1747 Nickel 8710 SHFE (Base Metals) (Yuan per tones) Commodity Closing Price Copper 35960 Aluminum 11965 Zinc 14770 Lead 13000 Closing as on 10.05.16 Closing as on 10.05.16 LME INVENTORY DATA Aaj Ka Trend 04-May-16 05-May-16 06-May-16 09-May-16 10-May-16 Aluminium -12350 -2900 -6275 -2900 -7150 Copper 1825 2300 225 2300 1300 Lead -200 -650 550 -650 1575 Nickel -1062 150 -1308 150 24 Zinc -4275 -1225 -1125 -1225 -825 11th May’16
- 5. Equities I Commodities I Currencies I Mutual Funds This is solely for information of clients of Choice Broking and does not construe to be an investment advice. It is also not intended as an offer or solicitation for the purchase and sale of any financial instruments. Any action taken by you on the basis of the information contained herein is your responsibility alone and Choice Broking its subsidiaries or its employees or associates will not be liable in any manner for the consequences of such action taken by you. We have exercised due diligence in checking the correctness and authenticity of the information contained in this recommendation, but Choice Broking or any of its subsidiaries or associates or employees shall not be in any way responsible for any loss or damage that may arise to any person from any inadvertent error in the information contained in this recommendation or any action taken on basis of this information. Technical analysis studies market psychology, price patterns and volume levels. It is used to forecast future price and market movements. Technical analysis is complementary to fundamental analysis and news sources. The recommendations issued herewith might be contrary to recommendations issued by Choice Broking in the company research undertaken as the recommendations stated in this report is derived purely from technical analysis. Choice Broking has based this document on information obtained from sources it believes to be reliable but which it has not independently verified; Choice Broking makes no guarantee, representation or warranty and accepts no responsibility or liability as to its accuracy or completeness. The opinions contained within the report are based upon publicly available information at the time of publication and are subject to change without notice. The information and any disclosures provided herein are in summary form and have been prepared for informational purposes. The recommendations and suggested price levels are intended purely for trading purposes. The recommendations are valid for the day of the report however trading trends and volumes might vary substantially on an intraday basis and the recommendations may be subject to change. The information and any disclosures provided herein may be considered confidential. Any use, distribution, modification, copying, forwarding or disclosure by any person is strictly prohibited. The information and any disclosures provided herein do not constitute a solicitation or offer to purchase or sell any security or other financial product or instrument. The current performance may be unaudited. Past performance does not guarantee future returns. There can be no assurance that investments will achieve any targeted rates of return, and there is no guarantee against the loss of your entire investment. POTENTIAL CONFLICT OF INTEREST DISCLOSURE (as on date of report) Disclosure of interest statement – • Analyst interest of the stock /Instrument(s): - No. • Firm interest of the stock / Instrument (s): - No. Disclaimer Contact Us Amit Pathania Research Associate amit.pathania@choiceindia.com Rohan Patil Research Associate rohan.patil@choiceindia.com www.choiceindia.comcustomercare@choiceindia.com SEBI Registered - Research Analyst Equities I Commodities I Currencies I Mutual Funds Aaj Ka Trend 11th May’16 Neeraj Yadav Research Advisor neeraj.yadav@choiceindia.com Anish Vyas Senior Research Associate anish.vyas@choiceindia.com Amit Pathania Digitally signed by Amit Pathania DN: cn=Amit Pathania, o=Choice Equity Broking Pvt. ltd, ou=Research Department, email=amit.pathania@choiceindia.com, c=IN Date: 2016.05.11 08:40:29 +05'30'