
Recommended
More Related Content
What's hot
What's hot (20)
Viewers also liked
Similar to Currency high lights 17.10.16
Similar to Currency high lights 17.10.16 (20)
Recently uploaded
Recently uploaded (20)
Currency high lights 17.10.16
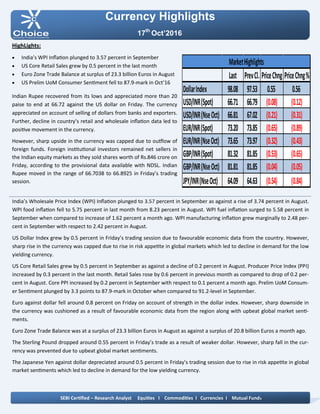
- 1. Currency Highlights 17th Oct’2016 HighLights: India’s WPI Inflation plunged to 3.57 percent in September US Core Retail Sales grew by 0.5 percent in the last month Euro Zone Trade Balance at surplus of 23.3 billion Euros in August US Prelim UoM Consumer Sentiment fell to 87.9-mark in Oct’16 Indian Rupee recovered from its lows and appreciated more than 20 paise to end at 66.72 against the US dollar on Friday. The currency appreciated on account of selling of dollars from banks and exporters. Further, decline in country’s retail and wholesale inflation data led to positive movement in the currency. However, sharp upside in the currency was capped due to outflow of foreign funds. Foreign institutional investors remained net sellers in the Indian equity markets as they sold shares worth of Rs.846 crore on Friday, according to the provisional data available with NDSL. Indian Rupee moved in the range of 66.7038 to 66.8925 in Friday’s trading session. India’s Wholesale Price Index (WPI) Inflation plunged to 3.57 percent in September as against a rise of 3.74 percent in August. WPI food inflation fell to 5.75 percent in last month from 8.23 percent in August. WPI fuel inflation surged to 5.58 percent in September when compared to increase of 1.62 percent a month ago. WPI manufacturing inflation grew marginally to 2.48 per- cent in September with respect to 2.42 percent in August. US Dollar Index grew by 0.5 percent in Friday’s trading session due to favourable economic data from the country. However, sharp rise in the currency was capped due to rise in risk appetite in global markets which led to decline in demand for the low yielding currency. US Core Retail Sales grew by 0.5 percent in September as against a decline of 0.2 percent in August. Producer Price Index (PPI) increased by 0.3 percent in the last month. Retail Sales rose by 0.6 percent in previous month as compared to drop of 0.2 per- cent in August. Core PPI increased by 0.2 percent in September with respect to 0.1 percent a month ago. Prelim UoM Consum- er Sentiment plunged by 3.3 points to 87.9-mark in October when compared to 91.2-level in September. Euro against dollar fell around 0.8 percent on Friday on account of strength in the dollar index. However, sharp downside in the currency was cushioned as a result of favourable economic data from the region along with upbeat global market senti- ments. Euro Zone Trade Balance was at a surplus of 23.3 billion Euros in August as against a surplus of 20.8 billion Euros a month ago. The Sterling Pound dropped around 0.55 percent in Friday’s trade as a result of weaker dollar. However, sharp fall in the cur- rency was prevented due to upbeat global market sentiments. The Japanese Yen against dollar depreciated around 0.5 percent in Friday’s trading session due to rise in risk appetite in global market sentiments which led to decline in demand for the low yielding currency. SEBI Certified – Research Analyst Equities I Commodities I Currencies I Mutual Funds Last PrevCl. PriceChng PriceChng% DollarIndex 98.08 97.53 0.55 0.56 USD/INR(Spot) 66.71 66.79 (0.08) (0.12) USD/INR(NseOct) 66.81 67.02 (0.21) (0.31) EUR/INR(Spot) 73.20 73.85 (0.65) (0.89) EUR/INR(NseOct) 73.65 73.97 (0.32) (0.43) GBP/INR(Spot) 81.32 81.85 (0.53) (0.65) GBP/INR(NseOct) 81.81 81.85 (0.04) (0.05) JPY/INR(NseOct) 64.09 64.63 (0.54) (0.84) MarketHighlights
- 2. Technical View: On daily chart JPYINR prices have been trading in sym- metrical triangle pattern and shown breakdown of its symmetrical triangle pattern. However, price has formed bearish candle stick on daily chart. Moreover, price has shown breakdown of its rising trend line at 65 levels. On the other hand price has shown breakdown of its rising trend line at 65.60 levels on daily chart. Furthermore, prices have been trading below its 21 DE- MA, which suggest short term trend is negative. On daily chart momentum indicator RSI is trading below at 45 levels which suggest further weakness in the pric- es. So for trading perspective, one could use sell in the range of 64.30 with SL of 64.70 for Target of 63.80 levels. Pivot levels for the Day Technical View: On daily USDINR prices have been trading in falling channel formation from past few weeks and prices have been facing resistance at upper band of channel pattern at 67.05 levels. The pair has formed bearish candle stick with appealing volumes. On the other hand, prices have been facing resistance of horizontal trend line at 66.95 levels on daily chart. Moreover, prices have been trading below 21 DEMA which gives the sign of bearishness in the prices. A momentum indictor RSI has traded below 60 levels, which suggest further weakness in the prices. In addition, momentum indicator MACD has shown neg- ative crossover on daily chart. So for trading perspective, one could sell in range 66.90 with SL of 67.25 for target of 66.20. Currency Highlights 17th Oct’2016 USDINR JPYINR SEBI Certified – Research Analyst Equities I Commodities I Currencies I Mutual Funds S3 S2 S1 Pivot R1 R2 R3 USDINR 66.49 66.68 66.74 66.87 66.93 67.06 67.25 JPYINR 63.27 63.73 63.91 64.19 64.37 64.65 65.11
- 3. Pivot levels for the Day Currency Highlights 17th Oct’2016 GBPINR EURINR Technical View: The EURINR pair has shown breakdown of its descend- ing triangle pattern at 74 levels on daily chart. On the other hand price has shown breakdown of its symmet- rical triangle pattern at 74.80 levels on daily chart. Moreover, prices have been trading below its 21 DE- MA, which suggest short term trend is down. The pair has shown breakdown of its horizontal trend line at 74.70 levels on daily chart. On daily chart momentum oscillator RSI have been trad- ing below 60 which suggest bearishness in the prices. A momentum indicator MACD has shown negative crossover on daily chart, which add more bearishness in the prices. For now we can expect prices should move lower to- wards 73 levels in the coming trading session. Technical View: On daily GBPINR prices have been taking support of its falling trend line at 81.20 levels. Moreover, prices have been trading below 21 HEMA, which suggest short term trend looks positive. The price has formed bullish hammer candle stick pattern on daily chart, which is bullish pattern. A momentum indicator MADC has given positive Cross over on hourly chart, which gives the sign of bullishness in the prices. The momentum indictor RSI has been trading in over- sold zone levels on daily chart, which suggest the possi- bilities of bounce back in the in the prices. For now we expect prices should move higher towards 83 levels coming trading sessions. SEBI Certified – Research Analyst Equities I Commodities I Currencies I Mutual Funds S3 S2 S1 Pivot R1 R2 R3 GBPINR 80.77 81.27 81.54 81.77 82.04 82.27 82.77 EURINR 73.07 73.41 73.53 73.75 73.87 74.09 74.43
- 4. Currency Highlights SEBI Certified – Research Analyst Equities I Commodities I Currencies I Mutual Funds 17th Oct’2016 Economic Indicators Date Time Data Prior Expected Impact 17.10.16 17th-19th M2 Money Supply y/y 11.4% 11.6% Actual< Forecast = Good for currency; USDINR 17.10.16 17th-19th New Loans 949B 1000B More hawkish than expected = Good for currency; 17.10.16 2:30 PM Final CPI y/y 0.4% 0.4% Actual > Forecast = Good for currency; EURINR 17.10.16 2:30 PM Final Core CPI y/y 0.8% 0.8% Actual > Forecast = Good for currency; EURINR 17.10.16 6:45 PM Industrial Production m/m -0.4% 0.3% Actual > Forecast = Good for currency; USDINR 17.10.16 9:45 pm FOMC Member Fischer Speaks More hawkish than expected = Good for currency; USDINR
- 5. Currency Highlights 17th Oct’2016 SEBI Certified – Research Analyst Equities I Commodities I Currencies I Mutual Funds Amit Pathania Digitally signed by Amit Pathania DN: cn=Amit Pathania, o=Choice Equity Broking Pvt. ltd, ou=Research Department, email=amit.pathania@choiceindia.com, c=IN Date: 2016.10.15 13:17:10 +05'30'