
Recommended
More Related Content
What's hot
What's hot (20)
Viewers also liked
Viewers also liked (18)
Similar to Aaj ka trend 05.01.17
Similar to Aaj ka trend 05.01.17 (20)
Recently uploaded
Recently uploaded (20)
Aaj ka trend 05.01.17
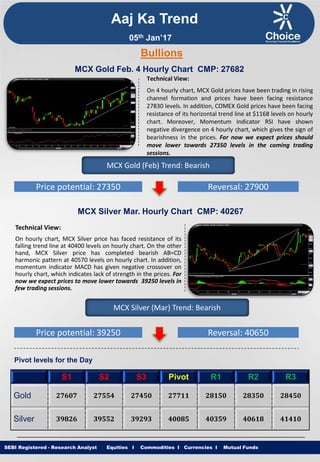
- 1. Equities I Commodities I Currencies I Mutual Funds Aaj Ka Trend Technical View: On 4 hourly chart, MCX Gold prices have been trading in rising channel formation and prices have been facing resistance 27830 levels. In addition, COMEX Gold prices have been facing resistance of its horizontal trend line at $1168 levels on hourly chart. Moreover, Momentum Indicator RSI have shown negative divergence on 4 hourly chart, which gives the sign of bearishness in the prices. For now we expect prices should move lower towards 27350 levels in the coming trading sessions. SEBI Registered - Research Analyst Equities I Commodities I Currencies I Mutual Funds Bullions MCX Gold Feb. 4 Hourly Chart CMP: 27682 MCX Gold (Feb) Trend: Bearish Price potential: 27350 Reversal: 27900 MCX Silver Mar. Hourly Chart CMP: 40267 Technical View: On hourly chart, MCX Silver price has faced resistance of its falling trend line at 40400 levels on hourly chart. On the other hand, MCX Silver price has completed bearish AB=CD harmonic pattern at 40570 levels on hourly chart. In addition, momentum indicator MACD has given negative crossover on hourly chart, which indicates lack of strength in the prices. For now we expect prices to move lower towards 39250 levels in few trading sessions. MCX Silver (Mar) Trend: Bearish Price potential: 39250 Reversal: 40650 Pivot levels for the Day S1 S2 S3 Pivot R1 R2 R3 Gold 27607 27554 27450 27711 28150 28350 28450 Silver 39826 39552 39293 40085 40359 40618 41410 05th Jan’17
- 2. Equities I Commodities I Currencies I Mutual Funds Technical View: MCX Copper price has been trading in falling channel pattern and prices have been hovering around its resistance of its upper band of channel pattern at 386 levels on daily chart. In addition MCX Copper prices are trading below its 21 HEMA. Furthermore, momentum indicator MACD has remained below signal line on daily time frame, which suggest further down side momentum can be seen. For now we expect prices to move lower towards 374 levels in coming trading sessions. SEBI Registered - Research Analyst Equities I Commodities I Currencies I Mutual Funds MCX Copper Feb. Daily Chart CMP: 384.05 MCX Copper (Feb) Trend: Bearish Price potential: 374 Reversal: 389 MCX Crude Oil Jan. 4 Hourly Chart CMP: 3621 Technical View: MCX Crude Oil prices has given breakdown of its rising trend line at 3610 levels on 4 hourly chart. MCX Crude Oil is trading below its 50 HEMA on hourly chart. On the other hand, NYMEX WTI Crude oil price has shown breakdown of its rising trend line at $54 levels. Moreover, Momentum indicator MACD has shown negative crossover and moving below its signal line on 4 hourly chart which suggest negative movement in the prices. For now we expect prices to move lower towards 3470 levels in coming trading sessions. MCX Crude Oil (Jan) Trend: Bearish Price potential: 3470 Reversal: 3660 Pivot levels for the Day S1 S2 S3 Pivot R1 R2 R3 Copper 378.8 373.5 370.2 382.1 387.4 390.7 402.7 Crude 3563 3530 3503 3590 3623 3650 3737 Base Metal Energy Aaj Ka Trend 05th Jan’17
- 3. Equities I Commodities I Currencies I Mutual FundsSEBI Registered - Research Analyst Equities I Commodities I Currencies I Mutual Funds Other Base Metals & Energy S1 S2 S3 Pivot R1 R2 R3 Trend Copper 378.8 373.5 370.2 382.1 387.4 390.7 402.7 Aluminum 114.4 114.1 113.5 115.0 115.3 115.9 117.3 Lead 138.6 136.4 135.3 139.7 141.9 143.0 147.5 Nickel 685.9 676.8 672.0 690.7 699.8 704.6 723.3 Zinc 173.9 170.5 168.6 175.8 179.1 181.0 188.2 Natural Gas 220.6 218.1 213.7 225.0 227.5 231.9 243.2 Fundamental News: Gold touched a near-four week high on Wednesday as the dollar edged back from a 14-year peak and physical demand from major consumers China and India increased. "The dollar index has consolidated and the big outflow from exchange-traded products (ETPs), which has been the biggest headwind for gold in the past few months, has stopped recently," Julius Baer analyst Carsten Menke said Holdings of the SPDR Gold Trust GLD , the world's largest gold-backed exchange-traded fund, dropped 1 percent to 813.87 tonnes on Tuesday. Holdings are down about 14 percent since the U.S. presidential election in November. Gold imports to Turkey rose to 36.7 tonnes in December, their highest monthly level in just over two years, data from the Istanbul bourse showed on Wednesday. XAG= was up 1 percent at $16.42 an ounce, after hitting near three-week highs in the last session Oil fell from the highest level since July 2015 as the dollar strengthened while doubts persisted about the ability of OPEC and its partners to balance the market. Futures slipped on the first trading day of 2017 after rising 45 percent last year, the biggest annual gain since 2009. Prices touched an 18-month high earlier as output cuts by Kuwait and Oman signaled OPEC and its partners are delivering on their deal to stabilize the market. Oil fell from the session’s highs as a strengthening greenback reduced investor demand for commodities priced in the U.S. currency. Oil rose in 2016 for the first time in three years as the Organization of Petroleum Exporting Countries and 11 other countries agreed to cut output starting Jan. 1 in an effort to reduce bloated global stockpiles. Aaj Ka Trend 05th Jan’17
- 4. Equities I Commodities I Currencies I Mutual FundsSEBI Registered - Research Analyst Equities I Commodities I Currencies I Mutual Funds International Market Commodity Closing Price Gold 1173.60 Silver 16.60 Crude Oil 53.13 Brent Crude Oil 56.28 Natural Gas 3.247 COMEX/NYMEX/ICE ( Precious Metals & Energy) Currency & Commodity Index Currency (Spot) Current Price USD / INR 68.05 Dollar Index 102.17 EUR / USD 1.0527 CRB Index* 192.97 Closing as on 04.01.17 *Closing as on 04.01.17 LME (Base Metals) ( $ per tones) Commodity Closing Price Copper 5644 Aluminum 1685 Zinc 2621 Lead 2079 Nickel 10220 SHFE (Base Metals) (Yuan per tones) Commodity Closing Price Copper 45880 Aluminum 12640 Zinc 21515 Lead 17975 Closing as on 04.01.17 Closing as on 04.01.17 LME INVENTORY DATA Aaj Ka Trend 29-Dec-16 30-Dec-16 02-Jan-17 03-Jan-17 04-Jan-17 Aluminium 6875 22251 0 -3750 -5701 Copper -2751 -6125 0 -10401 -5949 Lead -51 -799 0 -51 -1000 Nickel -125 -125 0 787 -343 Zinc -475 -475 0 -475 54 05th Jan’17
- 5. Equities I Commodities I Currencies I Mutual Funds This is solely for information of clients of Choice Broking and does not construe to be an investment advice. It is also not intended as an offer or solicitation for the purchase and sale of any financial instruments. Any action taken by you on the basis of the information contained herein is your responsibility alone and Choice Broking its subsidiaries or its employees or associates will not be liable in any manner for the consequences of such action taken by you. We have exercised due diligence in checking the correctness and authenticity of the information contained in this recommendation, but Choice Broking or any of its subsidiaries or associates or employees shall not be in any way responsible for any loss or damage that may arise to any person from any inadvertent error in the information contained in this recommendation or any action taken on basis of this information. Technical analysis studies market psychology, price patterns and volume levels. It is used to forecast future price and market movements. Technical analysis is complementary to fundamental analysis and news sources. The recommendations issued herewith might be contrary to recommendations issued by Choice Broking in the company research undertaken as the recommendations stated in this report is derived purely from technical analysis. Choice Broking has based this document on information obtained from sources it believes to be reliable but which it has not independently verified; Choice Broking makes no guarantee, representation or warranty and accepts no responsibility or liability as to its accuracy or completeness. The opinions contained within the report are based upon publicly available information at the time of publication and are subject to change without notice. The information and any disclosures provided herein are in summary form and have been prepared for informational purposes. The recommendations and suggested price levels are intended purely for trading purposes. The recommendations are valid for the day of the report however trading trends and volumes might vary substantially on an intraday basis and the recommendations may be subject to change. The information and any disclosures provided herein may be considered confidential. Any use, distribution, modification, copying, forwarding or disclosure by any person is strictly prohibited. The information and any disclosures provided herein do not constitute a solicitation or offer to purchase or sell any security or other financial product or instrument. The current performance may be unaudited. Past performance does not guarantee future returns. There can be no assurance that investments will achieve any targeted rates of return, and there is no guarantee against the loss of your entire investment. POTENTIAL CONFLICT OF INTEREST DISCLOSURE (as on date of report) Disclosure of interest statement – • Analyst interest of the stock /Instrument(s): - No. • Firm interest of the stock / Instrument (s): - No. Disclaimer Contact Us Amit Pathania Research Associate amit.pathania@choiceindia.com www.choicebroking.incustomercare@choiceindia.com SEBI Registered - Research Analyst Equities I Commodities I Currencies I Mutual Funds Aaj Ka Trend 05th Jan’17 Neeraj Yadav Research Advisor neeraj.yadav@choiceindia.com Anish Vyas Senior Research Associate anish.vyas@choiceindia.com Anish Vyas Digitally signed by Anish Vyas DN: cn=Anish Vyas, o=Choice Merchandise Broking Pvt. Ltd, ou=Sr. Research Associate, email=anish.vyas@choiceindia.com, c=IN Date: 2017.01.05 09:07:55 +05'30'