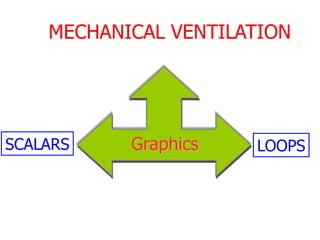
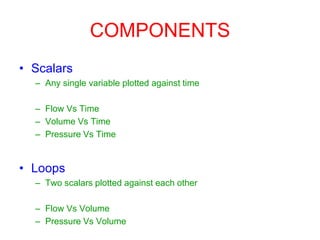
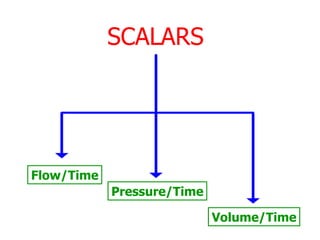
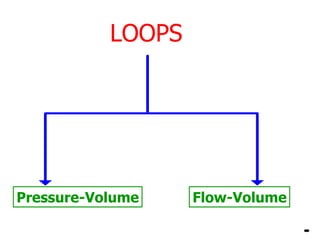
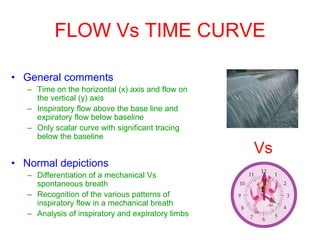
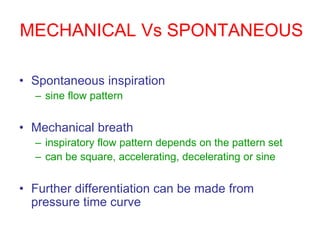
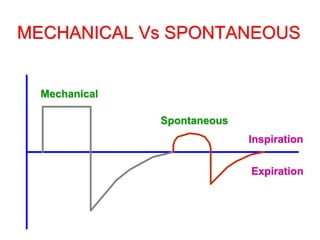
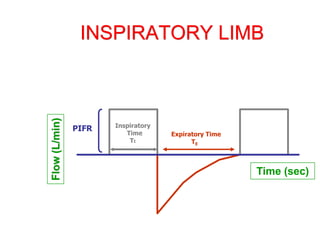
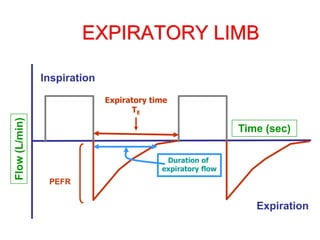
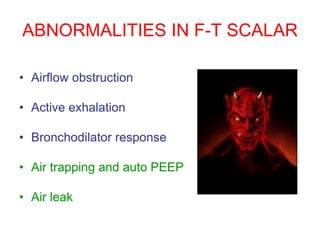
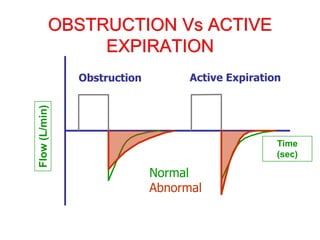
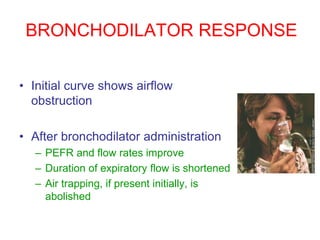
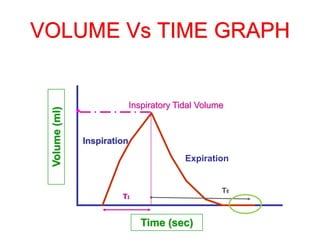
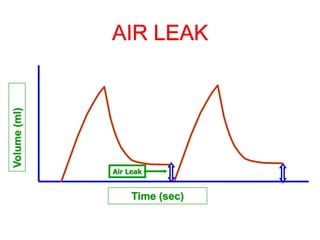
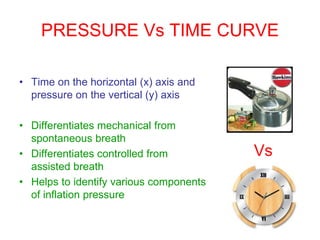
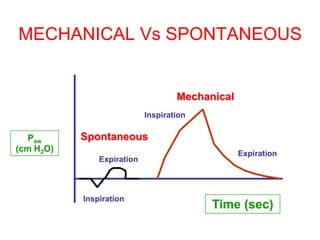
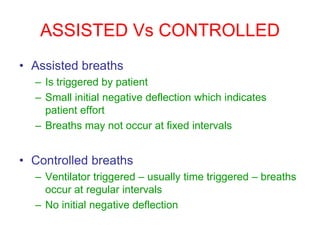
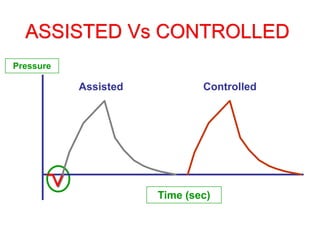
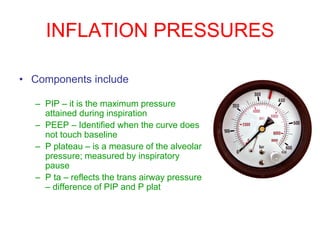
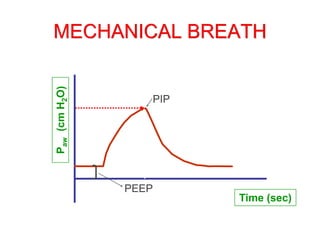
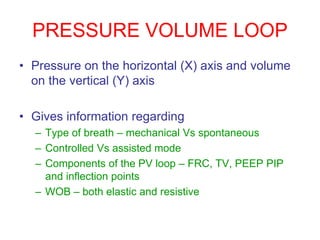
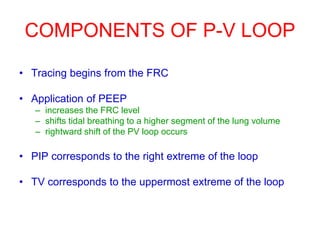
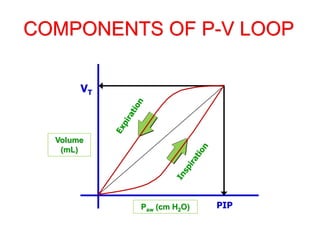
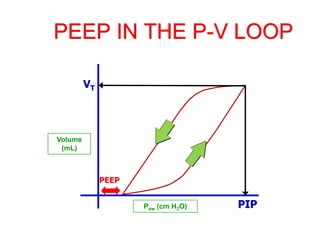
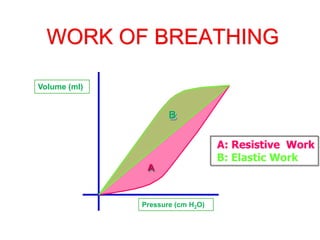
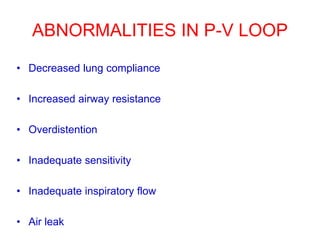
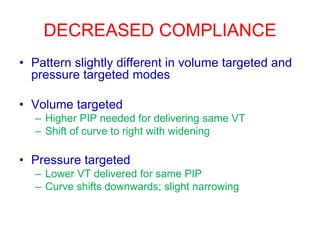
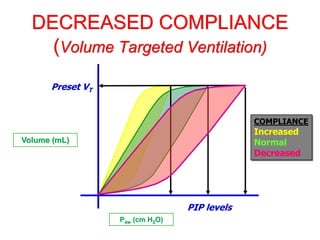
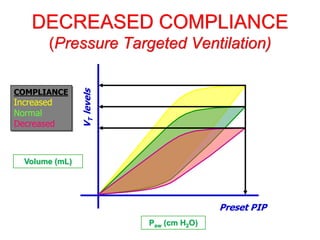
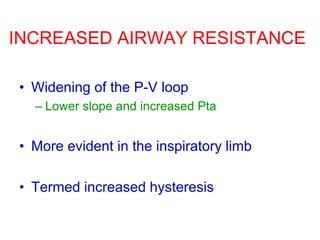
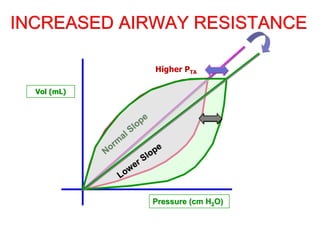
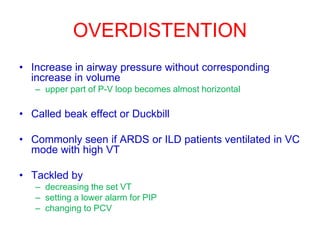
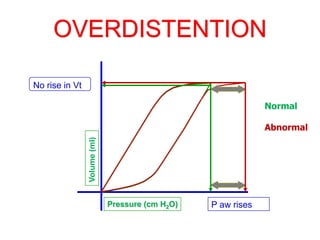
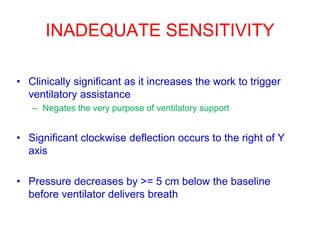
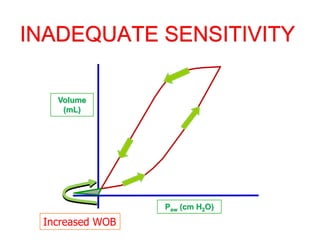
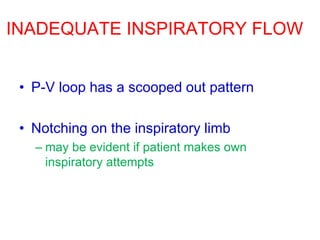
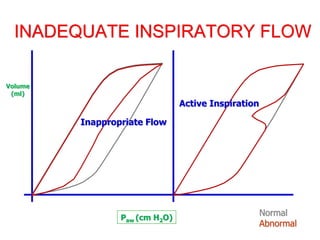
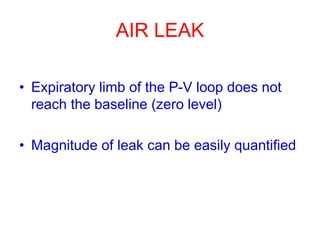
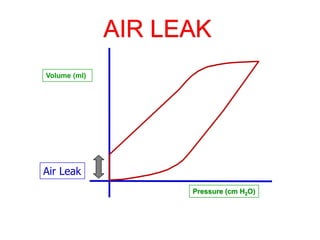
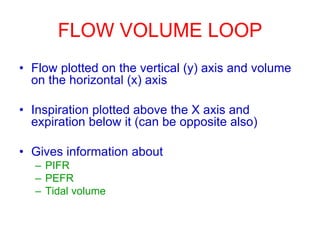
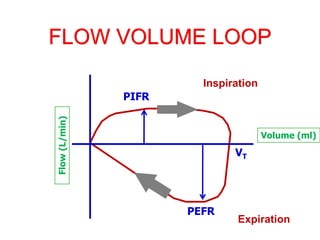
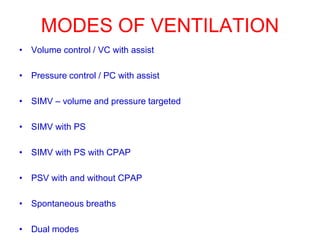
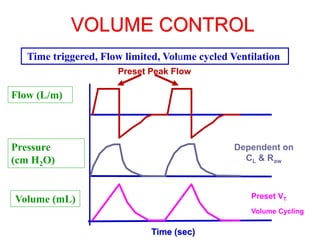
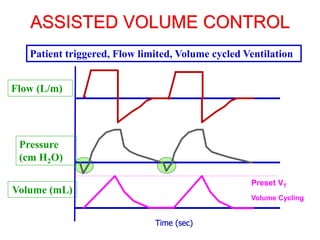
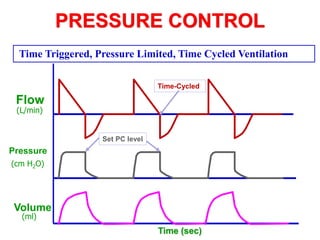
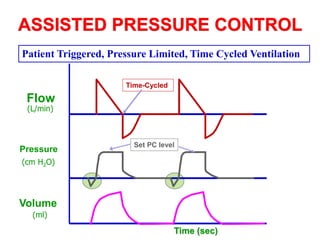
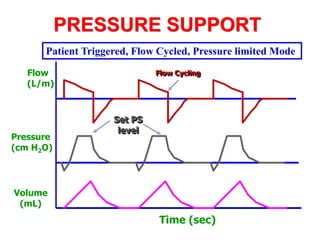
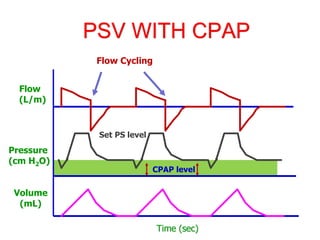
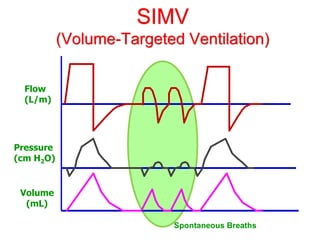
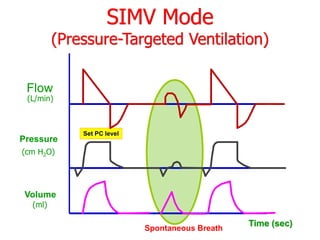
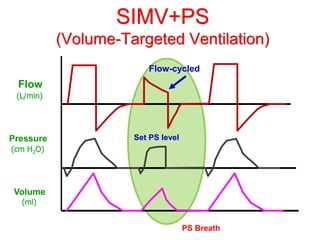
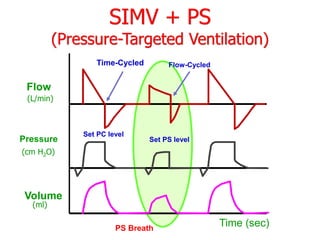
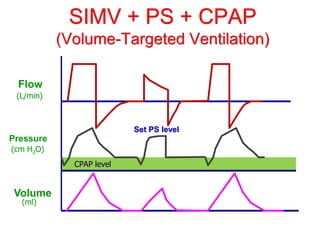
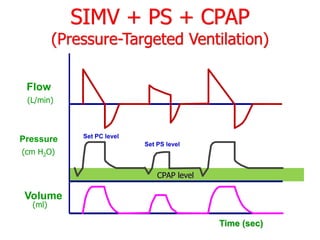
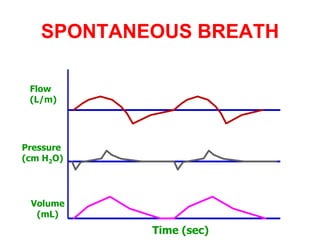
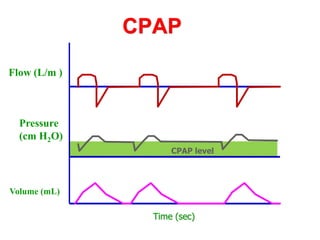
WHAT DO GRAPHICS TELL
YOU ?
DR.RAJESH.V
MD (chest), DNB (Resp Med)
IDCC (Critical Care)
Associate Professor, AIMS
PREPARING…
WHAT AM I UP TO ?
• Familiarize clinicians with
– Common patterns of ventilator graphics
encountered in the ICU
• Recognize the normal scalar and loop
graphics
– Its different components
• Recognize abnormalities in each
• Identify mode of ventilation from the
graphics
• What did I learn ?
NUMBERS Vs GRAPHICS
• NUMBERS
• Apparently objective
• May be easier for
beginners
• Provide less information
• Less catchy
• GRAPHICS
• More subjective
• Interpretation needs
some experience
• More detailed information
• More catchy
• 22 year old female
• Tall, fair, good looking
• Cute smile with nice
dimples
• 36-24-36
• Flashy dressing style
Pictorial representations more informative
and attractive too!!!
MECHANICAL VENTILATION
Graphics
SCALARS LOOPS
COMPONENTS
• Scalars
– Any single variable plotted against time
– Flow Vs Time
– Volume Vs Time
– Pressure Vs Time
• Loops
– Two scalars plotted against each other
– Flow Vs Volume
– Pressure Vs Volume
SCALARS
Flow/Time
Pressure/Time
Volume/Time
Pressure-Volume Flow-Volume
LOOPS
FLOW Vs TIME CURVE
• General comments
– Time on the horizontal (x) axis and flow on
the vertical (y) axis
– Inspiratory flow above the base line and
expiratory flow below baseline
– Only scalar curve with significant tracing
below the baseline
• Normal depictions
– Differentiation of a mechanical Vs
spontaneous breath
– Recognition of the various patterns of
inspiratory flow in a mechanical breath
– Analysis of inspiratory and expiratory limbs
Vs
MECHANICAL Vs SPONTANEOUS
• Spontaneous inspiration
– sine flow pattern
• Mechanical breath
– inspiratory flow pattern depends on the pattern set
– can be square, accelerating, decelerating or sine
• Further differentiation can be made from
pressure time curve
MECHANICAL Vs SPONTANEOUS
Inspiration
Expiration
Spontaneous
Mechanical
INSPIRATORY LIMB
• Depicts the pattern of inspiratory
flow
– sine, square, decelerating or
accelerating
• Depicts the
– PIFR and
– inspiratory time
INSPIRATORY LIMB
Time (sec)
Flow
(L/min)
PIFR Inspiratory
Time
TI
Expiratory Time
TE
EXPIRATORY LIMB
• Depicts the PEFR and expiratory time
• PEFR is reached instantly and
expiratory flow ceases before the
expiration ends
• Expiratory flow pattern depends on
– Patient effort (active exhalation)
– Raw (bronchospasm, secretions etc)
– Elastic recoil of the lungs (compliance)
EXPIRATORY LIMB
Inspiration
Expiration
Time (sec)
Flow
(L/min)
Duration of
expiratory flow
Expiratory time
TE
PEFR
ABNORMALITIES IN F-T SCALAR
• Airflow obstruction
• Active exhalation
• Bronchodilator response
• Air trapping and auto PEEP
• Air leak
OBSTRUCTION Vs ACTIVE
EXPIRATION
• Obstruction
– Decreased PEFR which is attained
slightly later in expiration
– Duration of expiratory flow is prolonged
– Air trapping may be evident
• Active exhalation
– High PEFR and shortened duration of
expiratory flow
OBSTRUCTION Vs ACTIVE
EXPIRATION
Obstruction Active Expiration
Time
(sec)
Normal
Abnormal
Flow
(L/min)
BRONCHODILATOR RESPONSE
• Initial curve shows airflow
obstruction
• After bronchodilator administration
– PEFR and flow rates improve
– Duration of expiratory flow is shortened
– Air trapping, if present initially, is
abolished
BRONCHODILATOR RESPONSE
Before
Time (sec)
Flow
(L/min)
PEFR
After
Long TE
Higher
PEFR
Shorter TE
AIR TRAPPING AND AUTO PEEP
• Expiratory flow does not return
to baseline before the next
inspiration
• Auto PEEP results
– Flow time curve is very sensitive
to detect auto PEEP
– Does not display the magnitude
of auto PEEP
• Larger the distance from the
baseline, more is the auto
PEEP
0
+
AIR TRAPPING AND AUTO PEEP
Inspiration
Expiration
Normal
Patient
Time (sec)
Flow
(L/min)
Auto PEEP
VOLUME Vs TIME CURVE
• Time on the horizontal (x) axis and volume
on the vertical (y) axis
• Gives information about
– inspiratory and expiratory time
– inspiratory and expiratory tidal volumes
• Normally, the FRC is reached in expiration
much before the next inspiration begins
Vs
VOLUME Vs TIME GRAPH
Inspiration
Expiration
Time (sec)
Volume
(ml)
TI
Inspiratory Tidal Volume
TE
ABNORMALITIES
• Abnormalities that can
be identified include
– Active exhalation
– Air leak
ACTIVE EXHALATION
• Expiratory tracing of the
curve extends below the
baseline
• Another cause for a similar
appearance is poor
calibration of flow
transducer
ACTIVE EXHALATION
Volume (ml)
Time (sec)
Expiration
AIR LEAK
• Expiratory tracing does not
reach the baseline
– plateau after a smooth descent
• Volume of leak can be easily
measured from the graph
AIR LEAK
Volume
(ml)
Time (sec)
Air Leak
PRESSURE Vs TIME CURVE
• Time on the horizontal (x) axis and
pressure on the vertical (y) axis
• Differentiates mechanical from
spontaneous breath
• Differentiates controlled from
assisted breath
• Helps to identify various components
of inflation pressure
Vs
MECHANICAL Vs SPONTANEOUS
• For a spontaneous breath
– Inspiratory tracing is below baseline (negative)
– Magnitude of pressure swings are usually smaller
• For mechanical breath
– Both inspiratory and expiratory tracings are above
baseline
MECHANICAL Vs SPONTANEOUS
Mechanical
Time (sec)
Spontaneous
Paw
(cm H2O)
Inspiration
Expiration
Expiration
Inspiration
ASSISTED Vs CONTROLLED
• Assisted breaths
– Is triggered by patient
– Small initial negative deflection which indicates
patient effort
– Breaths may not occur at fixed intervals
• Controlled breaths
– Ventilator triggered – usually time triggered – breaths
occur at regular intervals
– No initial negative deflection
ASSISTED Vs CONTROLLED
Time (sec)
Assisted Controlled
Pressure
INFLATION PRESSURES
• Components include
– PIP – it is the maximum pressure
attained during inspiration
– PEEP – Identified when the curve does
not touch baseline
– P plateau – is a measure of the alveolar
pressure; measured by inspiratory
pause
– P ta – reflects the trans airway pressure
– difference of PIP and P plat
MECHANICAL BREATH
P
aw
(cm
H
2
O)
Time (sec)
PEEP
PIP
INSPIRATORY HOLD
• Ventilator gives us the option of holding breath in end
inspiration by pressing a button
• Possible/meaningful only in controlled mode with no
patient effort to inspire or expire
• This ceases airflow in full inspiration and the measured
airway pressure reflects alveolar pressure
• Alveolar pressure at end inspiration is a measure of
static lung compliance
INFLATION PRESSURES
Expiration begins
(Expiratory valve opens)
P
aw
(cm
H
2
O)
Time (sec)
PIP
Expiration
Inspiratory
Pause
P Plat
Transairway pressure (P ta)
Both valves closed
Begin Inspiration
Begin Expiration
P
aw
(cm
H
2
O)
Time (sec)
Distending
(Alveolar)
Pressure Expiration
Inflation Hold
(seconds)
PIP
WHAT DOES EACH SIGNIFY ?
P plat
P Plat reflects alveolar pressure – measure of elastic work
P ta reflects airway resistance – measure of resistive work
STATIC COMPLIANCE
• Static compliance (C st) = lung
volume at inspiratory hold divided
by pressure
• C st = Expiratory TV / (P plat –
PEEP)
ABNORMALITIES
• Increased airway resistance
• Decreased lung compliance
• High or inadequate inspiratory
flows
HIGH PEAK PRESSURES
• Can be due to
– Decreased lung compliance
– Increased airway resistance
– High inspiratory flow rates
INCREASED RESISTANCE Vs
DECREASED COMPLIANCE
INCREASED Raw
• Elevated PIP
• Normal P plat
• Elevated P ta
• Often, responds to
bronchodilators or
clearance of secretions
DECREASED Cst
• Elevated PIP
• Elevated P plat
• P ta normal or decreased
• Poor response
PIP Vs P plat IN VARIOUS STATES
Normal High Raw
High Flow
Low Compliance
Time (sec)
Paw
(cm
H
2
O)
PIP
PPlat
PIP
PIP PIP
PPlat
PPlat
PPlat
HIGH FLOW RATES
• Elevated PIP
• Normal P plat
• Elevated P ta
• Decreased inspiratory time (Ti) with supranormal
PIFR
PRESSURE VOLUME LOOP
• Pressure on the horizontal (X) axis and volume
on the vertical (Y) axis
• Gives information regarding
– Type of breath – mechanical Vs spontaneous
– Controlled Vs assisted mode
– Components of the PV loop – FRC, TV, PEEP PIP
and inflection points
– WOB – both elastic and resistive
COMPONENTS OF P-V LOOP
• Tracing begins from the FRC
• Application of PEEP
– increases the FRC level
– shifts tidal breathing to a higher segment of the lung volume
– rightward shift of the PV loop occurs
• PIP corresponds to the right extreme of the loop
• TV corresponds to the uppermost extreme of the loop
COMPONENTS OF P-V LOOP
Volume
(mL)
PIP
VT
Paw (cm H2O)
PEEP IN THE P-V LOOP
Volume
(mL)
VT
PIP
Paw (cm H2O)
PEEP
INFLECTION POINTS
• These are points of sudden change in slope of
the tracings
• Represent alveolar opening and recoil
– The lower inflection point indicates the beginning of
alveolar opening
– The upper inflection point indicates lung recoil and
over distention
• A higher LIP (shift of curve to right) indicates a
stiffer lung
INFLECTION POINTS
Pressure (cm H2O)
Volume (mL)
Upper Inflection Point
Lower Inflection Point
TYPE OF BREATH
• Mechanical breath
– Tracing is counter clockwise
– entire tracing is to the right of Y axis (pressure
remains positive throughout respiratory cycle)
• Assisted
– Tracing starts clockwise (patient trigger) and then
becomes counter clockwise
– Small negative deflection in pressure tracing (pt
trigger)
• Spontaneous
– Clockwise tracing
– inspiratory tracing on left side of Y axis (negative
intrathoracic inspiratory pressure)
PRESSURE VOLUME LOOP
Controlled Assisted Spontaneous
Vol
(ml)
Paw
(cm H2O)
I: Inspiration
E: Expiration
I
E
E
E
I
I
WORK OF BREATHING
A: Resistive Work
B: Elastic Work
Pressure (cm H2O)
Volume (ml)
B
A
ABNORMALITIES IN P-V LOOP
• Decreased lung compliance
• Increased airway resistance
• Overdistention
• Inadequate sensitivity
• Inadequate inspiratory flow
• Air leak
DECREASED COMPLIANCE
• Pattern slightly different in volume targeted and
pressure targeted modes
• Volume targeted
– Higher PIP needed for delivering same VT
– Shift of curve to right with widening
• Pressure targeted
– Lower VT delivered for same PIP
– Curve shifts downwards; slight narrowing
DECREASED COMPLIANCE
(Volume Targeted Ventilation)
Volume (mL)
PIP levels
Preset VT
Paw (cm H2O)
COMPLIANCE
Increased
Normal
Decreased
DECREASED COMPLIANCE
(Pressure Targeted Ventilation)
Volume (mL)
Preset PIP
V
T
levels
Paw (cm H2O)
COMPLIANCE
Increased
Normal
Decreased
INCREASED AIRWAY RESISTANCE
• Widening of the P-V loop
– Lower slope and increased Pta
• More evident in the inspiratory limb
• Termed increased hysteresis
INCREASED AIRWAY RESISTANCE
Pressure (cm H2O)
Higher PTA
Vol (mL)
OVERDISTENTION
• Increase in airway pressure without corresponding
increase in volume
– upper part of P-V loop becomes almost horizontal
• Called beak effect or Duckbill
• Commonly seen if ARDS or ILD patients ventilated in VC
mode with high VT
• Tackled by
– decreasing the set VT
– setting a lower alarm for PIP
– changing to PCV
OVERDISTENTION
Volume
(ml)
Pressure (cm H2O)
Normal
Abnormal
P aw rises
No rise in Vt
INADEQUATE SENSITIVITY
• Clinically significant as it increases the work to trigger
ventilatory assistance
– Negates the very purpose of ventilatory support
• Significant clockwise deflection occurs to the right of Y
axis
• Pressure decreases by >= 5 cm below the baseline
before ventilator delivers breath
INADEQUATE SENSITIVITY
Volume
(mL)
Paw (cm H2O)
Increased WOB
INADEQUATE INSPIRATORY FLOW
• P-V loop has a scooped out pattern
• Notching on the inspiratory limb
– may be evident if patient makes own
inspiratory attempts
INADEQUATE INSPIRATORY FLOW
Paw (cm H2O)
Volume
(ml)
Normal
Abnormal
Active Inspiration
Inappropriate Flow
AIR LEAK
• Expiratory limb of the P-V loop does not
reach the baseline (zero level)
• Magnitude of leak can be easily quantified
AIR LEAK
Volume (ml)
Pressure (cm H2O)
Air Leak
FLOW VOLUME LOOP
• Flow plotted on the vertical (y) axis and volume
on the horizontal (x) axis
• Inspiration plotted above the X axis and
expiration below it (can be opposite also)
• Gives information about
– PIFR
– PEFR
– Tidal volume
FLOW VOLUME LOOP
Volume (ml)
PEFR
Inspiration
Expiration
PIFR
VT
ABNORMALITIES
• Air leak
• Auto PEEP
• Increased airway resistance
• Airway secretions/condensate
AIRWAY SECRETIONS
• Flow volume loop tracing assumes a saw tooth
appearance
– Seen in the expiratory limb first
– If not promptly corrected, appears in inspiratory limb
also
• This feature has
– Positive predictive value of 94%
– Negative predictive value of 77% if absent
AIRWAY SECRETIONS
Inspiration
Expiration
Volume (ml)
Flow
(L/min)
Normal
Abnormal
INCREASED Raw
• Decreased expiratory flow rates – esp. – PEFR
• Expiratory tracing has a scooped out
appearance
• Tracing becomes slightly convex towards the
volume axis in early stages
INCREASED Raw
Inspiration
Expiration
Volume (ml)
Flow
(L/min)
Decreased PEFR
Normal
Abnormal
“Scooped out”
pattern
MODES OF VENTILATION
• Volume control / VC with assist
• Pressure control / PC with assist
• SIMV – volume and pressure targeted
• SIMV with PS
• SIMV with PS with CPAP
• PSV with and without CPAP
• Spontaneous breaths
• Dual modes
VOLUME CONTROL
Preset VT
Volume Cycling
Dependent on
CL & Raw
Time (sec)
Flow (L/m)
Pressure
(cm H2O)
Volume (mL)
Preset Peak Flow
Time triggered, Flow limited, Volume cycled Ventilation
ASSISTED VOLUME CONTROL
Time (sec)
Flow (L/m)
Pressure
(cm H2O)
Volume (mL)
Preset VT
Volume Cycling
Patient triggered, Flow limited, Volume cycled Ventilation
PRESSURE CONTROL
Pressure
Flow
Volume
(L/min)
(cm H2O)
(ml)
Time (sec)
Time-Cycled
Set PC level
Time Triggered, Pressure Limited, Time Cycled Ventilation
ASSISTED PRESSURE CONTROL
Pressure
Flow
Volume
(L/min)
(cm H2O)
(ml)
Set PC level
Time (sec)
Time-Cycled
Patient Triggered, Pressure Limited, Time Cycled Ventilation
PRESSURE SUPPORT
Time (sec)
Flow
(L/m)
Pressure
(cm H2O)
Volume
(mL)
Flow Cycling
Set PS
level
Patient Triggered, Flow Cycled, Pressure limited Mode
PSV WITH CPAP
Set PS level
CPAP level
Time (sec)
Flow
(L/m)
Pressure
(cm H2O)
Volume
(mL)
Flow Cycling
SIMV
(Volume-Targeted Ventilation)
Spontaneous Breaths
Flow
(L/m)
Pressure
(cm H2O)
Volume
(mL)
Pressure
Flow
Volume
(L/min)
(cm H2O)
(ml)
Set PC level
Time (sec)
SIMV Mode
(Pressure-Targeted Ventilation)
Spontaneous Breath
SIMV+PS
(Volume-Targeted Ventilation)
Flow
Pressure
Volume
(L/min)
(cm H2O)
(ml)
Set PS level
PS Breath
Flow-cycled
Pressure
Flow
Volume
(L/min)
(cm H2O)
(ml)
SIMV + PS
(Pressure-Targeted Ventilation)
PS Breath
Set PS level
Set PC level
Time (sec)
Time-Cycled Flow-Cycled
SIMV + PS + CPAP
(Volume-Targeted Ventilation)
Flow
Pressure
Volume
(L/min)
(cm H2O)
(ml)
Set PS level
CPAP level
Pressure
Flow
Volume
(L/min)
(cm H2O)
(ml)
Set PC level
Time (sec)
SIMV + PS + CPAP
(Pressure-Targeted Ventilation)
Set PS level
CPAP level
SPONTANEOUS BREATH
Time (sec)
Flow
(L/m)
Pressure
(cm H2O)
Volume
(mL)
CPAP
Time (sec)
CPAP level
Flow (L/m )
Pressure
(cm H2O)
Volume (mL)
ARDS ?
Useless ?
Too
complicated !!
How should
I proceed ?
What is
graphics ?
Modo de ventilación Mecanica, funcionamiento

Modo de ventilación Mecanica, funcionamiento

  • 1.
    WHAT DO GRAPHICSTELL YOU ? DR.RAJESH.V MD (chest), DNB (Resp Med) IDCC (Critical Care) Associate Professor, AIMS
  • 2.
  • 3.
    WHAT AM IUP TO ? • Familiarize clinicians with – Common patterns of ventilator graphics encountered in the ICU • Recognize the normal scalar and loop graphics – Its different components • Recognize abnormalities in each • Identify mode of ventilation from the graphics • What did I learn ?
  • 4.
    NUMBERS Vs GRAPHICS •NUMBERS • Apparently objective • May be easier for beginners • Provide less information • Less catchy • GRAPHICS • More subjective • Interpretation needs some experience • More detailed information • More catchy
  • 5.
    • 22 yearold female • Tall, fair, good looking • Cute smile with nice dimples • 36-24-36 • Flashy dressing style Pictorial representations more informative and attractive too!!!
  • 6.
  • 7.
    COMPONENTS • Scalars – Anysingle variable plotted against time – Flow Vs Time – Volume Vs Time – Pressure Vs Time • Loops – Two scalars plotted against each other – Flow Vs Volume – Pressure Vs Volume
  • 8.
  • 9.
  • 10.
    FLOW Vs TIMECURVE • General comments – Time on the horizontal (x) axis and flow on the vertical (y) axis – Inspiratory flow above the base line and expiratory flow below baseline – Only scalar curve with significant tracing below the baseline • Normal depictions – Differentiation of a mechanical Vs spontaneous breath – Recognition of the various patterns of inspiratory flow in a mechanical breath – Analysis of inspiratory and expiratory limbs Vs
  • 11.
    MECHANICAL Vs SPONTANEOUS •Spontaneous inspiration – sine flow pattern • Mechanical breath – inspiratory flow pattern depends on the pattern set – can be square, accelerating, decelerating or sine • Further differentiation can be made from pressure time curve
  • 12.
  • 13.
    INSPIRATORY LIMB • Depictsthe pattern of inspiratory flow – sine, square, decelerating or accelerating • Depicts the – PIFR and – inspiratory time
  • 14.
    INSPIRATORY LIMB Time (sec) Flow (L/min) PIFRInspiratory Time TI Expiratory Time TE
  • 15.
    EXPIRATORY LIMB • Depictsthe PEFR and expiratory time • PEFR is reached instantly and expiratory flow ceases before the expiration ends • Expiratory flow pattern depends on – Patient effort (active exhalation) – Raw (bronchospasm, secretions etc) – Elastic recoil of the lungs (compliance)
  • 16.
  • 17.
    ABNORMALITIES IN F-TSCALAR • Airflow obstruction • Active exhalation • Bronchodilator response • Air trapping and auto PEEP • Air leak
  • 18.
    OBSTRUCTION Vs ACTIVE EXPIRATION •Obstruction – Decreased PEFR which is attained slightly later in expiration – Duration of expiratory flow is prolonged – Air trapping may be evident • Active exhalation – High PEFR and shortened duration of expiratory flow
  • 19.
    OBSTRUCTION Vs ACTIVE EXPIRATION ObstructionActive Expiration Time (sec) Normal Abnormal Flow (L/min)
  • 20.
    BRONCHODILATOR RESPONSE • Initialcurve shows airflow obstruction • After bronchodilator administration – PEFR and flow rates improve – Duration of expiratory flow is shortened – Air trapping, if present initially, is abolished
  • 21.
  • 22.
    AIR TRAPPING ANDAUTO PEEP • Expiratory flow does not return to baseline before the next inspiration • Auto PEEP results – Flow time curve is very sensitive to detect auto PEEP – Does not display the magnitude of auto PEEP • Larger the distance from the baseline, more is the auto PEEP 0 +
  • 23.
    AIR TRAPPING ANDAUTO PEEP Inspiration Expiration Normal Patient Time (sec) Flow (L/min) Auto PEEP
  • 24.
    VOLUME Vs TIMECURVE • Time on the horizontal (x) axis and volume on the vertical (y) axis • Gives information about – inspiratory and expiratory time – inspiratory and expiratory tidal volumes • Normally, the FRC is reached in expiration much before the next inspiration begins Vs
  • 25.
    VOLUME Vs TIMEGRAPH Inspiration Expiration Time (sec) Volume (ml) TI Inspiratory Tidal Volume TE
  • 26.
    ABNORMALITIES • Abnormalities thatcan be identified include – Active exhalation – Air leak
  • 27.
    ACTIVE EXHALATION • Expiratorytracing of the curve extends below the baseline • Another cause for a similar appearance is poor calibration of flow transducer
  • 28.
  • 29.
    AIR LEAK • Expiratorytracing does not reach the baseline – plateau after a smooth descent • Volume of leak can be easily measured from the graph
  • 30.
  • 31.
    PRESSURE Vs TIMECURVE • Time on the horizontal (x) axis and pressure on the vertical (y) axis • Differentiates mechanical from spontaneous breath • Differentiates controlled from assisted breath • Helps to identify various components of inflation pressure Vs
  • 32.
    MECHANICAL Vs SPONTANEOUS •For a spontaneous breath – Inspiratory tracing is below baseline (negative) – Magnitude of pressure swings are usually smaller • For mechanical breath – Both inspiratory and expiratory tracings are above baseline
  • 33.
    MECHANICAL Vs SPONTANEOUS Mechanical Time(sec) Spontaneous Paw (cm H2O) Inspiration Expiration Expiration Inspiration
  • 34.
    ASSISTED Vs CONTROLLED •Assisted breaths – Is triggered by patient – Small initial negative deflection which indicates patient effort – Breaths may not occur at fixed intervals • Controlled breaths – Ventilator triggered – usually time triggered – breaths occur at regular intervals – No initial negative deflection
  • 35.
    ASSISTED Vs CONTROLLED Time(sec) Assisted Controlled Pressure
  • 36.
    INFLATION PRESSURES • Componentsinclude – PIP – it is the maximum pressure attained during inspiration – PEEP – Identified when the curve does not touch baseline – P plateau – is a measure of the alveolar pressure; measured by inspiratory pause – P ta – reflects the trans airway pressure – difference of PIP and P plat
  • 37.
  • 38.
    INSPIRATORY HOLD • Ventilatorgives us the option of holding breath in end inspiration by pressing a button • Possible/meaningful only in controlled mode with no patient effort to inspire or expire • This ceases airflow in full inspiration and the measured airway pressure reflects alveolar pressure • Alveolar pressure at end inspiration is a measure of static lung compliance
  • 39.
    INFLATION PRESSURES Expiration begins (Expiratoryvalve opens) P aw (cm H 2 O) Time (sec) PIP Expiration Inspiratory Pause P Plat Transairway pressure (P ta) Both valves closed
  • 40.
    Begin Inspiration Begin Expiration P aw (cm H 2 O) Time(sec) Distending (Alveolar) Pressure Expiration Inflation Hold (seconds) PIP WHAT DOES EACH SIGNIFY ? P plat P Plat reflects alveolar pressure – measure of elastic work P ta reflects airway resistance – measure of resistive work
  • 41.
    STATIC COMPLIANCE • Staticcompliance (C st) = lung volume at inspiratory hold divided by pressure • C st = Expiratory TV / (P plat – PEEP)
  • 42.
    ABNORMALITIES • Increased airwayresistance • Decreased lung compliance • High or inadequate inspiratory flows
  • 43.
    HIGH PEAK PRESSURES •Can be due to – Decreased lung compliance – Increased airway resistance – High inspiratory flow rates
  • 44.
    INCREASED RESISTANCE Vs DECREASEDCOMPLIANCE INCREASED Raw • Elevated PIP • Normal P plat • Elevated P ta • Often, responds to bronchodilators or clearance of secretions DECREASED Cst • Elevated PIP • Elevated P plat • P ta normal or decreased • Poor response
  • 45.
    PIP Vs Pplat IN VARIOUS STATES Normal High Raw High Flow Low Compliance Time (sec) Paw (cm H 2 O) PIP PPlat PIP PIP PIP PPlat PPlat PPlat
  • 46.
    HIGH FLOW RATES •Elevated PIP • Normal P plat • Elevated P ta • Decreased inspiratory time (Ti) with supranormal PIFR
  • 47.
    PRESSURE VOLUME LOOP •Pressure on the horizontal (X) axis and volume on the vertical (Y) axis • Gives information regarding – Type of breath – mechanical Vs spontaneous – Controlled Vs assisted mode – Components of the PV loop – FRC, TV, PEEP PIP and inflection points – WOB – both elastic and resistive
  • 48.
    COMPONENTS OF P-VLOOP • Tracing begins from the FRC • Application of PEEP – increases the FRC level – shifts tidal breathing to a higher segment of the lung volume – rightward shift of the PV loop occurs • PIP corresponds to the right extreme of the loop • TV corresponds to the uppermost extreme of the loop
  • 49.
    COMPONENTS OF P-VLOOP Volume (mL) PIP VT Paw (cm H2O)
  • 50.
    PEEP IN THEP-V LOOP Volume (mL) VT PIP Paw (cm H2O) PEEP
  • 51.
    INFLECTION POINTS • Theseare points of sudden change in slope of the tracings • Represent alveolar opening and recoil – The lower inflection point indicates the beginning of alveolar opening – The upper inflection point indicates lung recoil and over distention • A higher LIP (shift of curve to right) indicates a stiffer lung
  • 52.
    INFLECTION POINTS Pressure (cmH2O) Volume (mL) Upper Inflection Point Lower Inflection Point
  • 53.
    TYPE OF BREATH •Mechanical breath – Tracing is counter clockwise – entire tracing is to the right of Y axis (pressure remains positive throughout respiratory cycle) • Assisted – Tracing starts clockwise (patient trigger) and then becomes counter clockwise – Small negative deflection in pressure tracing (pt trigger) • Spontaneous – Clockwise tracing – inspiratory tracing on left side of Y axis (negative intrathoracic inspiratory pressure)
  • 54.
    PRESSURE VOLUME LOOP ControlledAssisted Spontaneous Vol (ml) Paw (cm H2O) I: Inspiration E: Expiration I E E E I I
  • 55.
    WORK OF BREATHING A:Resistive Work B: Elastic Work Pressure (cm H2O) Volume (ml) B A
  • 56.
    ABNORMALITIES IN P-VLOOP • Decreased lung compliance • Increased airway resistance • Overdistention • Inadequate sensitivity • Inadequate inspiratory flow • Air leak
  • 57.
    DECREASED COMPLIANCE • Patternslightly different in volume targeted and pressure targeted modes • Volume targeted – Higher PIP needed for delivering same VT – Shift of curve to right with widening • Pressure targeted – Lower VT delivered for same PIP – Curve shifts downwards; slight narrowing
  • 58.
    DECREASED COMPLIANCE (Volume TargetedVentilation) Volume (mL) PIP levels Preset VT Paw (cm H2O) COMPLIANCE Increased Normal Decreased
  • 59.
    DECREASED COMPLIANCE (Pressure TargetedVentilation) Volume (mL) Preset PIP V T levels Paw (cm H2O) COMPLIANCE Increased Normal Decreased
  • 60.
    INCREASED AIRWAY RESISTANCE •Widening of the P-V loop – Lower slope and increased Pta • More evident in the inspiratory limb • Termed increased hysteresis
  • 61.
    INCREASED AIRWAY RESISTANCE Pressure(cm H2O) Higher PTA Vol (mL)
  • 62.
    OVERDISTENTION • Increase inairway pressure without corresponding increase in volume – upper part of P-V loop becomes almost horizontal • Called beak effect or Duckbill • Commonly seen if ARDS or ILD patients ventilated in VC mode with high VT • Tackled by – decreasing the set VT – setting a lower alarm for PIP – changing to PCV
  • 63.
  • 64.
    INADEQUATE SENSITIVITY • Clinicallysignificant as it increases the work to trigger ventilatory assistance – Negates the very purpose of ventilatory support • Significant clockwise deflection occurs to the right of Y axis • Pressure decreases by >= 5 cm below the baseline before ventilator delivers breath
  • 65.
  • 66.
    INADEQUATE INSPIRATORY FLOW •P-V loop has a scooped out pattern • Notching on the inspiratory limb – may be evident if patient makes own inspiratory attempts
  • 67.
    INADEQUATE INSPIRATORY FLOW Paw(cm H2O) Volume (ml) Normal Abnormal Active Inspiration Inappropriate Flow
  • 68.
    AIR LEAK • Expiratorylimb of the P-V loop does not reach the baseline (zero level) • Magnitude of leak can be easily quantified
  • 69.
  • 70.
    FLOW VOLUME LOOP •Flow plotted on the vertical (y) axis and volume on the horizontal (x) axis • Inspiration plotted above the X axis and expiration below it (can be opposite also) • Gives information about – PIFR – PEFR – Tidal volume
  • 71.
    FLOW VOLUME LOOP Volume(ml) PEFR Inspiration Expiration PIFR VT
  • 72.
    ABNORMALITIES • Air leak •Auto PEEP • Increased airway resistance • Airway secretions/condensate
  • 73.
    AIRWAY SECRETIONS • Flowvolume loop tracing assumes a saw tooth appearance – Seen in the expiratory limb first – If not promptly corrected, appears in inspiratory limb also • This feature has – Positive predictive value of 94% – Negative predictive value of 77% if absent
  • 74.
  • 75.
    INCREASED Raw • Decreasedexpiratory flow rates – esp. – PEFR • Expiratory tracing has a scooped out appearance • Tracing becomes slightly convex towards the volume axis in early stages
  • 76.
  • 77.
    MODES OF VENTILATION •Volume control / VC with assist • Pressure control / PC with assist • SIMV – volume and pressure targeted • SIMV with PS • SIMV with PS with CPAP • PSV with and without CPAP • Spontaneous breaths • Dual modes
  • 78.
    VOLUME CONTROL Preset VT VolumeCycling Dependent on CL & Raw Time (sec) Flow (L/m) Pressure (cm H2O) Volume (mL) Preset Peak Flow Time triggered, Flow limited, Volume cycled Ventilation
  • 79.
    ASSISTED VOLUME CONTROL Time(sec) Flow (L/m) Pressure (cm H2O) Volume (mL) Preset VT Volume Cycling Patient triggered, Flow limited, Volume cycled Ventilation
  • 80.
    PRESSURE CONTROL Pressure Flow Volume (L/min) (cm H2O) (ml) Time(sec) Time-Cycled Set PC level Time Triggered, Pressure Limited, Time Cycled Ventilation
  • 81.
    ASSISTED PRESSURE CONTROL Pressure Flow Volume (L/min) (cmH2O) (ml) Set PC level Time (sec) Time-Cycled Patient Triggered, Pressure Limited, Time Cycled Ventilation
  • 82.
    PRESSURE SUPPORT Time (sec) Flow (L/m) Pressure (cmH2O) Volume (mL) Flow Cycling Set PS level Patient Triggered, Flow Cycled, Pressure limited Mode
  • 83.
    PSV WITH CPAP SetPS level CPAP level Time (sec) Flow (L/m) Pressure (cm H2O) Volume (mL) Flow Cycling
  • 84.
  • 85.
    Pressure Flow Volume (L/min) (cm H2O) (ml) Set PClevel Time (sec) SIMV Mode (Pressure-Targeted Ventilation) Spontaneous Breath
  • 86.
  • 87.
    Pressure Flow Volume (L/min) (cm H2O) (ml) SIMV +PS (Pressure-Targeted Ventilation) PS Breath Set PS level Set PC level Time (sec) Time-Cycled Flow-Cycled
  • 88.
    SIMV + PS+ CPAP (Volume-Targeted Ventilation) Flow Pressure Volume (L/min) (cm H2O) (ml) Set PS level CPAP level
  • 89.
    Pressure Flow Volume (L/min) (cm H2O) (ml) Set PClevel Time (sec) SIMV + PS + CPAP (Pressure-Targeted Ventilation) Set PS level CPAP level
  • 90.
  • 91.
    CPAP Time (sec) CPAP level Flow(L/m ) Pressure (cm H2O) Volume (mL)
  • 92.
    ARDS ? Useless ? Too complicated!! How should I proceed ? What is graphics ?