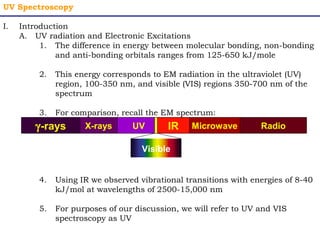
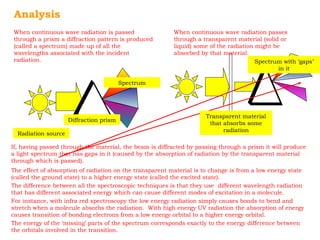
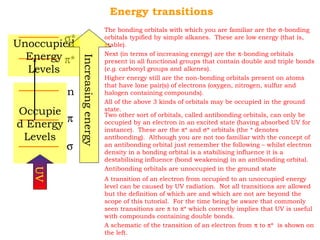
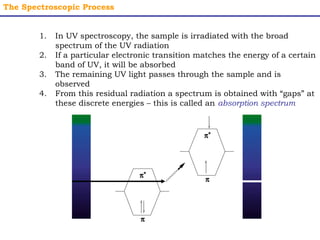
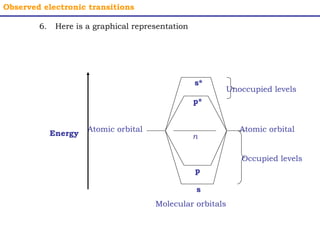
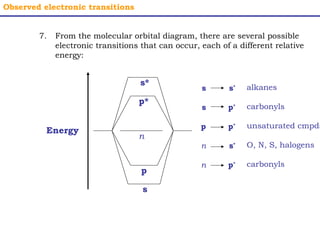
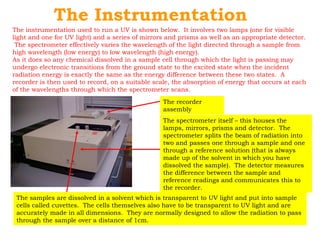
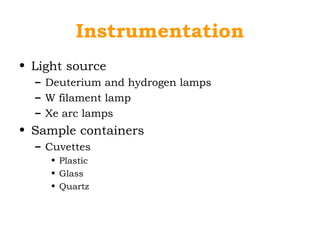
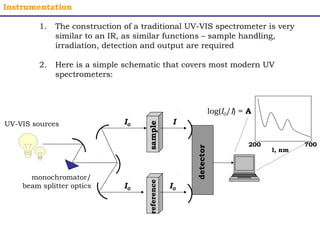
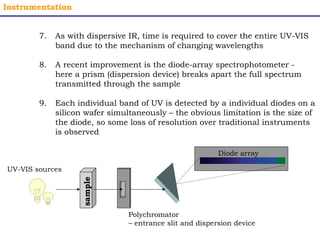
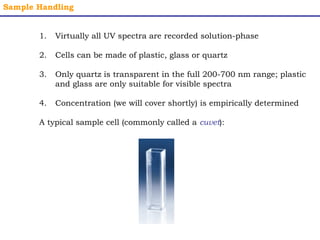
This document provides an overview of UV-Visible spectroscopy. It discusses how UV radiation causes electronic transitions in molecules, which can be observed via absorption spectroscopy. The instrumentation used includes sources of UV and visible light, a monochromator to select wavelengths, and a detector. Samples are dissolved and placed in transparent cuvettes for analysis. Spectra are recorded as absorbances and show absorption bands corresponding to electronic transitions. UV-Vis is useful for structure elucidation and quantitative analysis.
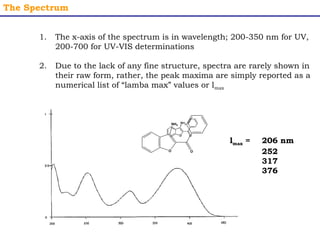


![UV SPECTROSCOPY [ULTRA-VIOLET SPECTROSCOPY]](https://cdn.slidesharecdn.com/ss_thumbnails/40-191218142647-thumbnail.jpg?width=640&height=640&fit=bounds)