
Recommended
Recommended
More Related Content
What's hot
What's hot (20)
Viewers also liked
Viewers also liked (20)
Similar to UV-visible spectroscopy
Similar to UV-visible spectroscopy (20)
Recently uploaded
Recently uploaded (20)
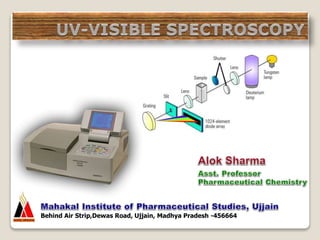
UV-visible spectroscopy
- 1. Behind Air Strip,Dewas Road, Ujjain, Madhya Pradesh -456664
- 2. Spectroscopy is the tool for study of atomic & molecular structure. It deals with interaction of electronic radiation with matter involving the measurement & interpretation of the extension of absorption or emission of electromagnetic radiation by molecule. ALOK SHARMA Asst. Professor, Mahakal Institute of Pharmaceutical Studies, Ujjain (M.P.) UV-Visible Spectroscopy
- 3. Most important consequence of such interaction is the energy is absorbed or emitted by the matter in discrete amount called as quanta. UV radiation starts at blue end of visible light(4000Å) & ends at 2000A. It divided into two spectral region- Near UV region- 2000Å-4000Å. Far or vacuum UV region- below 2000Å. UV-spectroscopy involved with electronic excitation. ALOK SHARMA Asst. Professor, Mahakal Institute of Pharmaceutical Studies, Ujjain (M.P.) UV-Visible Spectroscopy
- 4. Absorption And Emission spectra:- Spectroscopy mainly concerned with interaction of electromagnetic radiation with matter. After interaction they may variation in intensity of EMR with frequency. Instrument which record this variation in intensity known as spectrophotometer Two way in which interaction may observed- Sample itself emits radiation Called as emission spectra Absorbs radiation from continuous source Called as absorption spectra ALOK SHARMA Asst. Professor, Mahakal Institute of Pharmaceutical Studies, Ujjain (M.P.) UV-Visible Spectroscopy
- 5. Wavelength(λ):- distance between two successive maxima of one electromagnetic wave. express in Angstron units or (mu) Frequency(ν):- Number of wavelength passing through a given point. per sec. Unit:- Hertz or cycles per second Wave number:- Number of waves per centimeter in vacuum. Reciprocal of wavelength, express as per (cm). relation between frequency, velocity & wave number ν=(1/λ)c=(c/v)λ=(v/c) ALOK SHARMA Asst. Professor, Mahakal Institute of Pharmaceutical Studies, Ujjain (M.P.) UV-Visible Spectroscopy
- 6. 10910710510310110-110-310-510-710-910-11 gamma X-rays Ultra Violet Infra red microwave Radio waves 500 600 700 Violet, indigo, blue Green, yellow Orange, red Color Wave length (nm) violet 400-435 indigo 435-480 blue 480-500 green 500-560 yellow 560-595 orange 595-610 red 610-750 ALOK SHARMA Asst. Professor, Mahakal Institute of Pharmaceutical Studies, Ujjain (M.P.) UV-Visible Spectroscopy
- 7. Ultra violet absorption spectra arises from transition of electron or electrons within molecule. UV emission spectra arises from reverse type of transition. Electron undergoes transition from lower to higher energy level, this energy difference given by, E=hν erg But actually energy difference between ground & excited states of electrons E1-E0=hν Total energy of the molecule is sum of electronic, vibrational, rotational energy. E=Eele +Evib +Erot ALOK SHARMA Asst. Professor, Mahakal Institute of Pharmaceutical Studies, Ujjain (M.P.) UV-Visible Spectroscopy
- 8. UV-visible spectroscopy is the measurement of absorbance or transmittance of radiation in the ultra-violet &visible region of the spectrum. It arises from transition of electron. Stage -1 M + hν M* Stage -2 M* new species Excitation of species by absorption of photon with the limited life time. Relaxation by converting M* to the new species by photochemical reaction ALOK SHARMA Asst. Professor, Mahakal Institute of Pharmaceutical Studies, Ujjain (M.P.) UV-Visible Spectroscopy
- 9. σ-electrons- Involved in the saturated bonds. Found in the carbon, hydrogen in the paraffin. Energy required to excite σ-produced is electron more than the produced by the UV-light. π- electrons- Involved in unsaturated hydrocarbon. Present in trienes & aromatic compounds. n-electrons- It does not evolved in the bonding of the molecules. ALOK SHARMA Asst. Professor, Mahakal Institute of Pharmaceutical Studies, Ujjain (M.P.) UV-Visible Spectroscopy
- 10. transition σ-σ* n-σ* usually allowed n-π* π-π* forbidden Allowed transition:- having ε max 104 or more.This transition due to π-π* transition. In 1,3-butadiene exhibits absorption at 217 nm & has εmax 21000 represent allowed transition. Forbidden transition:- transition having εmax less than 104 .Occurs due to n-π*transition. ALOK SHARMA Asst. Professor, Mahakal Institute of Pharmaceutical Studies, Ujjain (M.P.) UV-Visible Spectroscopy
- 11. Transition Region Wavelength σ-σ* π-π* Far UV- region <200 nm n-σ* Ultra-violet =200 nm n-π* Near UV & visible 300- 600 nm Energy required for various transitions are in the order σ-σ*> n-σ* > π-π*> n-π* Thus, n-π*transition required less energy than a π-π* or σ-σ* transition. ALOK SHARMA Asst. Professor, Mahakal Institute of Pharmaceutical Studies, Ujjain (M.P.) UV-Visible Spectroscopy
- 12. Components of spectrophotometer Source Monochromator Sample compartment Detector Recorder ALOK SHARMA Asst. Professor, Mahakal Institute of Pharmaceutical Studies, Ujjain (M.P.) UV-Visible Spectroscopy
- 13. RADIANT SOURCE WAVELENGTH SELECTOR SOLVENT PHOTO- DETECTO R READOUT SAMPLE Fig.-block diagram of instrumentation of UV-spectrophotometer ALOK SHARMA Asst. Professor, Mahakal Institute of Pharmaceutical Studies, Ujjain (M.P.) UV-Visible Spectroscopy
- 14. Light source a)D2 Lamp b)WI Lamp Entrance slit monochromator sample Exit slit Read outamplifierdetector Fig.- block diagrammatic representation of UV-spectrophotometer ALOK SHARMA Asst. Professor, Mahakal Institute of Pharmaceutical Studies, Ujjain (M.P.) UV-Visible Spectroscopy
- 15. fig.-Schematic representation of single beam UV-spectrophotometer Fig.-schematic representation of double beam UV- spectrophotometer ALOK SHARMA Asst. Professor, Mahakal Institute of Pharmaceutical Studies, Ujjain (M.P.) UV-Visible Spectroscopy
- 16. Distribution of energy through spectrum is function of temperature. For Visible region- Tungsten filament lamp Use for region 350nm to 2000nm. Problem- Due to evaporation of tungsten life period decreases. It is overcome by using tungsten-halogen lamp. Halogen gas prevents evaporation of tungsten. ALOK SHARMA Asst. Professor, Mahakal Institute of Pharmaceutical Studies, Ujjain (M.P.) UV-Visible Spectroscopy
- 17. For ultra violet region- Hydrogen discharge lamp consist of two electrode contain in deuterium filled silica envelop. gives continuous spectrum in region 185-380nm. above 380nm emission is not continuous. UV-Vis spectrophotometer have both deuterium & tungsten lamps. Selection of lamp is made by moving lamp mounting or mirror to cause the light fall on monochromator. ALOK SHARMA Asst. Professor, Mahakal Institute of Pharmaceutical Studies, Ujjain (M.P.) UV-Visible Spectroscopy
- 18. Deuterium lamps:- Radiation emitted is 3-5 times more than the hydrogen discharge lamps. Xenon discharge lamp:- Xenon stored under pressure in 10-30 atmosphere. It possesses two tungsten electrode separated by 8 cm. Intensity of UV radiation more than hydrogen lamp. Mercury arc:- Mercury vapour filled under the pressure . Excitation of mercury atom by electric discharge ALOK SHARMA Asst. Professor, Mahakal Institute of Pharmaceutical Studies, Ujjain (M.P.) UV-Visible Spectroscopy
- 19. Provides a beam of radiant energy of a given nominal wavelength and spectral bandwidth. Parts of a monochramator 1. An entrance slit 2. A collimator 3. A grating 4. A collimator* 5. An exit slit ALOK SHARMA Asst. Professor, Mahakal Institute of Pharmaceutical Studies, Ujjain (M.P.) UV-Visible Spectroscopy
- 20. Filters – a) Glass filters- Made from pieces of colored glass which transmit limited wavelength range of spectrum. Color produced by incorporation of oxide of vanadium, chromium, iron, nickel, copper. Wide band width 150nm. b) Gelatin filters- Consist of mixture of dyes placed in gelatin & sandwiched between glass plates. Band width 25nm. c) Inter ferometric filters- Band width 15nm. ALOK SHARMA Asst. Professor, Mahakal Institute of Pharmaceutical Studies, Ujjain (M.P.) UV-Visible Spectroscopy
- 21. Prisms- Prism bends the monochromatic light. Amount of deviation depends on wavelength. Quartz prism used in UV-region. Glass prism used in visible region spectrum. Function – They produce non linear dispersion. ALOK SHARMA Asst. Professor, Mahakal Institute of Pharmaceutical Studies, Ujjain (M.P.) UV-Visible Spectroscopy
- 22. Fig.-mechanism of working of prism. ALOK SHARMA Asst. Professor, Mahakal Institute of Pharmaceutical Studies, Ujjain (M.P.) UV-Visible Spectroscopy
- 23. Grating- Large number of equispaced lines on a glass blank coated with aluminum film. Blaze angle Normal surface vector Normal to groove face ALOK SHARMA Asst. Professor, Mahakal Institute of Pharmaceutical Studies, Ujjain (M.P.) UV-Visible Spectroscopy
- 24. Spectroscopy requires all materials in the beam path other than the analyte should be as transparent to the radiation as possible. The geometries of all components in the system should be such as to maximize the signal and minimize the scattered light. The material from which a sample cuvette is fabricated controls the optical window that can be used. ALOK SHARMA Asst. Professor, Mahakal Institute of Pharmaceutical Studies, Ujjain (M.P.) UV-Visible Spectroscopy
- 25. Some typical materials are: Optical Glass - 335 - 2500 nm Special Optical Glass – 320 - 2500 nm Quartz (Infrared) – 220 - 3800 nm Quartz (Far-UV) – 170 - 2700 nm •Keep the cuvette clean. •Don’t clean with paper products. •Store dry. •Don’t get finger prints on them. •Store carefully and gently ALOK SHARMA Asst. Professor, Mahakal Institute of Pharmaceutical Studies, Ujjain (M.P.) UV-Visible Spectroscopy
- 26. Three common types of detectors are used Barrier layer cells Photocell detector Photomultiplier Photo voltaic cells or barrier layer cells :- They are primarily used for measurement of radiation in visible region. Maximum sensitivity-550nm. It consist of flat Cu or Fe electrode on which semiconductor such as selenium is deposited. on the selenium a thin layer of silver or gold is sputtered over the surface. ALOK SHARMA Asst. Professor, Mahakal Institute of Pharmaceutical Studies, Ujjain (M.P.) UV-Visible Spectroscopy
- 27. Barrier layer cells A barrier exist between the selenium & iron which prevents the electron flowing through iron. Therefore electrons are accumulated on the silver surface. These electrons are produced voltage. - terminal Silver surface selenium + terminal fig.-Barrier layer cell ALOK SHARMA Asst. Professor, Mahakal Institute of Pharmaceutical Studies, Ujjain (M.P.) UV-Visible Spectroscopy
- 28. Photocell detector:- It consist of high sensitive cathode in the form of a half cylinder of metal which is evacuated. Anode also present which fixed along the axis of the tube Photocell is more sensitive than photovoltaic cell. + - light Fig.- photocell detector ALOK SHARMA Asst. Professor, Mahakal Institute of Pharmaceutical Studies, Ujjain (M.P.) UV-Visible Spectroscopy
- 29. Photomultiplier tube:- It is generally used as detector in UV-spectrophotometer.It is the combination of photodiode & electron multiplier. It consist of evacuated tube contains photo-cathode. 9-16 electrodes known as dynodes. Fig.-photomultiplier tube ALOK SHARMA Asst. Professor, Mahakal Institute of Pharmaceutical Studies, Ujjain (M.P.) UV-Visible Spectroscopy
- 30. Signal from detector received by the recording system The recording done by recorder pan. ALOK SHARMA Asst. Professor, Mahakal Institute of Pharmaceutical Studies, Ujjain (M.P.) UV-Visible Spectroscopy
- 31. Important to reposition the cuvettes properly To clean the cuvettes, lens paper soaked in spectrograde methanol, which is held by a hemostat is used. When cuvettes are cleaned the methanol film left evaporates quickly leaving cuvette surface free of contaminants For maximum precision syringes are used to change the solution leaving the cuvettes in the same place. ALOK SHARMA Asst. Professor, Mahakal Institute of Pharmaceutical Studies, Ujjain (M.P.) UV-Visible Spectroscopy
- 32. Single beam spectrophotometer:- Double beam spectrophotometer:- Advantage of double beam spectrophotometer:- It is not necessary to continually replace the blank with the sample or to adjust the auto zero. The ratio of the powers of the sample & reference is constantly obtained. It has rapid scanning over the wide wavelength region because of the above two factors. ALOK SHARMA Asst. Professor, Mahakal Institute of Pharmaceutical Studies, Ujjain (M.P.) UV-Visible Spectroscopy
- 33. Lamberts Law:- Intensity of beam of parallel monochromatic radiation decreases exponentially as it passes through medium of homogeneous thickness. Absorption is proportional to the thickness (path length) of solution. I0/It=KC k=“absorption coefficient” defined as reciprocal of the thickness which required to reduced to light to 1/10 of its intensity ALOK SHARMA Asst. Professor, Mahakal Institute of Pharmaceutical Studies, Ujjain (M.P.) UV-Visible Spectroscopy
- 34. Beers law:- Intensity of a beam of parallel monochromatic radiation decreases exponentially with the number of absorbing molecule. Absorption is proportional to concentration. Combination of two law yields beers- lamberts law. A=Io/It=abc Where, A=absorbance Io-intensity of incident light It-transmitted light C-concentration B-thickness ALOK SHARMA Asst. Professor, Mahakal Institute of Pharmaceutical Studies, Ujjain (M.P.) UV-Visible Spectroscopy
- 35. Deviation from beer’s law:- From the beer’s law plot the absorbance against the conc. A straight line passing through origin is obtained. Deviation is due to the following factors:- A foreign substance having colour particle may affect the absorption & extinction coefficient. Deviation also occur if colored solute ionized or dissociates in the solution. for e.g.- benzyl alcohol in chloroform Due to the presence of impurities that fluoresce or absorb at the absorption wave length. If monochromatic light is not used deviation may occurs. If width of the slit is not proper. If the solution species undergoes polymerisation ALOK SHARMA Asst. Professor, Mahakal Institute of Pharmaceutical Studies, Ujjain (M.P.) UV-Visible Spectroscopy
- 36. Transmittance (T)= Io/It % transmittance (%T)= It/Io ˣ 100 Absorbance (A) = log (It/Io) Absorbance also term as, Extinction coefficient(E) Optical density (D) A= log (Io/It) =abc when concentration is in moles/lit. the constant called as molar absorptivity (ε) molar extinction coefficient. Specific absorbance- absorbance of a specific concentration in a cell of specific pathlength. ALOK SHARMA Asst. Professor, Mahakal Institute of Pharmaceutical Studies, Ujjain (M.P.) UV-Visible Spectroscopy
- 37. Most common form in p’ceutical analysis A1cm 1% is absorbance of 1g/100ml (1%w/v) solution in 1cm cell. ε = A 1cm 1% ˣ mole.wt. 10 ALOK SHARMA Asst. Professor, Mahakal Institute of Pharmaceutical Studies, Ujjain (M.P.) UV-Visible Spectroscopy
- 38. It is used for calculating the absorption maxima Woodward (1941) gives certain rule for correlating λmax with the molecular structure These rules are modified by Scott & Feiser. This rule for calculating λmax in conjugated dienes, trienes, polyenes. Homoannular dienes:- cyclic dienes having conjugated double bonds in the same ring. e.g. CH3 CH3 ALOK SHARMA Asst. Professor, Mahakal Institute of Pharmaceutical Studies, Ujjain (M.P.) UV-Visible Spectroscopy
- 39. Hateroannuler dienes:- Cyclic dienes in which double bonds in conjugation are present in the different ring. Endocyclic double bonds:- It is the double bond present in ring as shown. Exocyclic double bonds:- Double bond in which one of the double bonded atom is the part of ring system. CH2 CH2 e.g. Heteroannuler dienes Endocyclic double bond Exocyclic double bond ALOK SHARMA Asst. Professor, Mahakal Institute of Pharmaceutical Studies, Ujjain (M.P.) UV-Visible Spectroscopy
- 40. a)Parent values- 1. acyclic & Heteroannuler conjugated dienes 215 nm 2.Homoannular conjugated dienes 253 nm 3.Acyclic trienes 245 nm b)Increments- 1.Each alkyl substituent or ring residue 05 nm 2.Exocyclic double bond 05 nm 3.Double bond extending conjugation 30 nm 4.auxochromes- -OR 06 nm -SR 30 nm -Cl , Br 05 nm -NR2 60 nm -OCOCH3 0 nm ALOK SHARMA Asst. Professor, Mahakal Institute of Pharmaceutical Studies, Ujjain (M.P.) UV-Visible Spectroscopy
- 41. Problems:-1) 1,4- dimethyl cyclohex-1,3,-diene Parent value for Homoannular diene = 253 nm Two alkyl substituent's 2 ˣ 5 = 10 nm Two ring residues 2ˣ 5 = 10 nm Calculated value = 273 nm Observed value = 265 nm 2) Parent value for Heteroannuler diene = 215 nm Four ring residue 4 ˣ 5 = 20 nm Calculated value = 235 nm Observed value = 236 nm CH3 CH3 ALOK SHARMA Asst. Professor, Mahakal Institute of Pharmaceutical Studies, Ujjain (M.P.) UV-Visible Spectroscopy
- 42. a)Parent values:- 1.α,β-unsaturated acyclic or six membered ring ketone 215 nm 2.α,β-unsaturated five membered ring ketone 202nm 3.α,β-unsaturated aldehyde 207nm b)increments:- 1.Each alkyl substituent or ring residue at α, position 10nm at β,position 12nm at γ,position 18nm 2.Each Exocyclic double bond 5nm 3.Double bond extending conjugation 30nm 4.Homoannular conjugatated dienes 39nm 5.Auxochromes. Positions α β γ -OH 35 30 50 -OR 35 30 17 -SR - 85 - -OCOCH3 6 6 6 ALOK SHARMA Asst. Professor, Mahakal Institute of Pharmaceutical Studies, Ujjain (M.P.) UV-Visible Spectroscopy
- 43. Problems:- O CH3-C-C=CH3 CH3 1) Parent value = 215 nm 2) One alkyl substituent in α position = 10 nm 3) Calculated value = 225 nm 4) Observed value = 220 nm Parent value for α,β- unsaturated 6 membered cyclic ketone=215 nm One ring residue at α position = 10 nm 2 ring residue at β- position 2* 12 =24 nm Double bond Exocyclic to 2 ring 2* 5 =10 nm Calculated value = 259nm Observed value = A α,β- unsaturated acyclic ketone O ALOK SHARMA Asst. Professor, Mahakal Institute of Pharmaceutical Studies, Ujjain (M.P.) UV-Visible Spectroscopy
- 44. R-C6H4-COG λmax (nm) parent chromophore:- G=alkyl/ring residue G=H & R=H G=OH or O alkyl 246 250 230 Add for R: Alkyl or ring residue o,m 3 p 10 -OH, OMe, -O-Alkyl o,m 7 p 25 O- o 11 m 20 p 78 Cl o,m 0 p 10 Br o,m 2 P 15 NH2 o,m 13 p 58 NMe2 o,m 20 p 85 ALOK SHARMA Asst. Professor, Mahakal Institute of Pharmaceutical Studies, Ujjain (M.P.) UV-Visible Spectroscopy
- 45. 1) Para chloroacetophenone Basic value = 246 nm Cl substitution at p- position = 10 nm Calculated value = 256 nm Observed value = 254nm Cl C CH3 O ALOK SHARMA Asst. Professor, Mahakal Institute of Pharmaceutical Studies, Ujjain (M.P.) UV-Visible Spectroscopy
- 46. Extent of conjugation Distinction between conjugated and non conjugated compound Detection of chromophore in an unknown compound Identification of a chromophore (functional group) Study of strain Study of geometric isomerism Study of tautomerism Study of structural features in different solvents As an analytical tool ALOK SHARMA Asst. Professor, Mahakal Institute of Pharmaceutical Studies, Ujjain (M.P.) UV-Visible Spectroscopy
- 47. Willard H. et.al.; Instrumental Methods Of Analysis. Gurdeep R. chatwal; Sham K. Anand; Instrumental Methods Of Chemical Analysis. Y. Anjaneyulu; K. Chandrasekhar; Valli Manickam; Text book of analytical chemistry. Y. R.Sharma; Elementary organic spectroscopy. P.S.Kalsi; Spectroscopy of organic compound. B.K.Sharma; Instrumental methods of chemical analysis. ALOK SHARMA Asst. Professor, Mahakal Institute of Pharmaceutical Studies, Ujjain (M.P.) UV-Visible Spectroscopy
- 48. Queries ALOK SHARMA Asst. Professor, Mahakal Institute of Pharmaceutical Studies, Ujjain (M.P.) UV-Visible Spectroscopy
- 49. Thanks