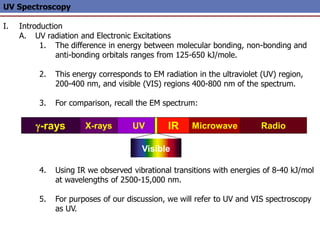
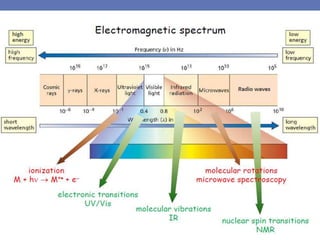
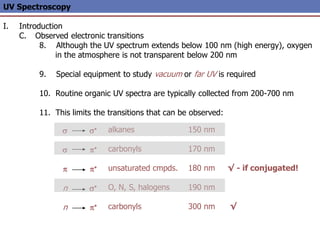
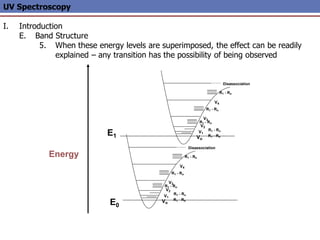
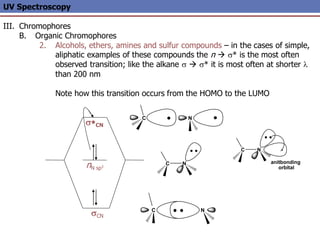
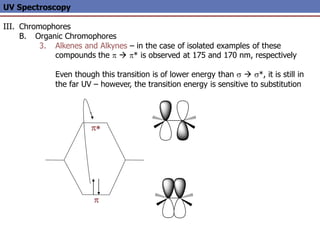
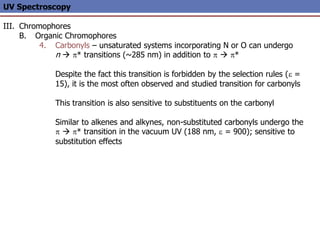
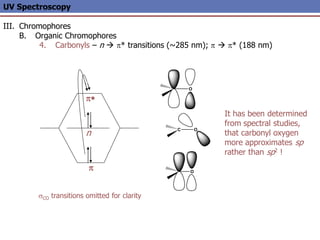
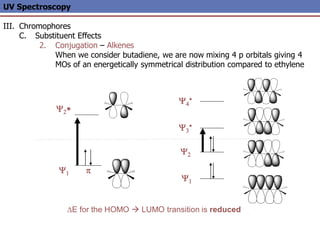
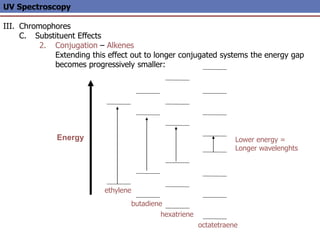
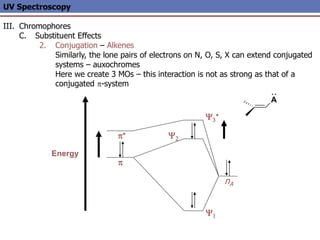
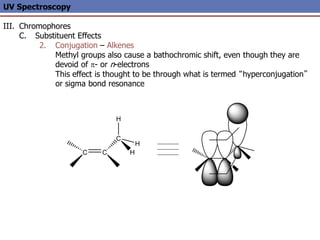
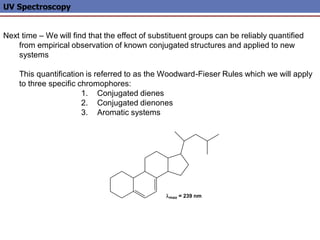
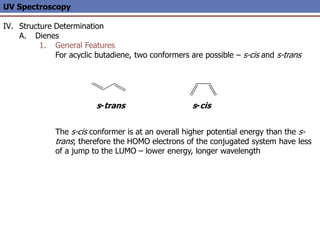
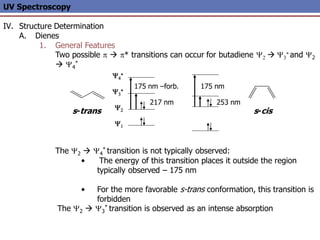
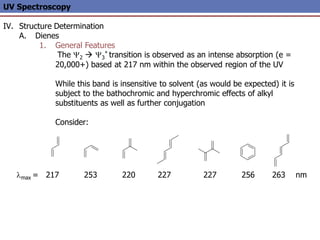
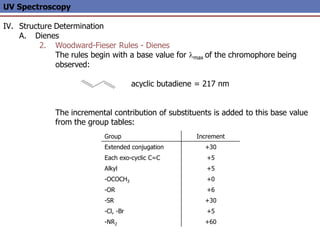
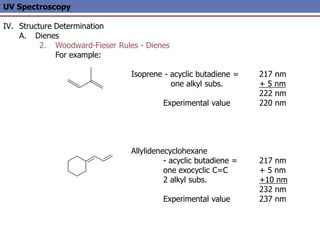
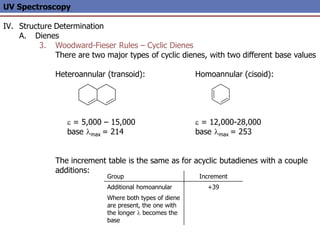
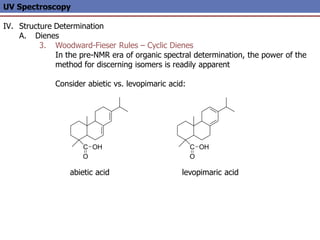
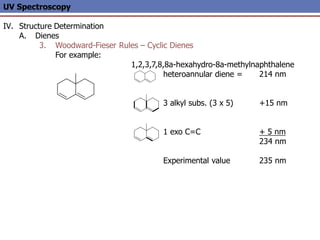
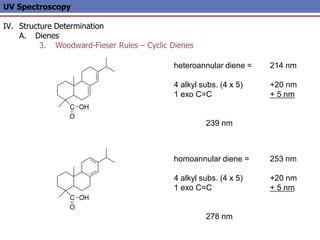
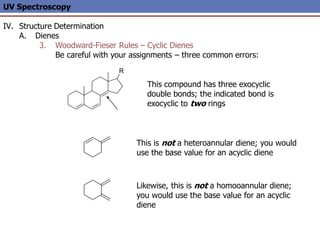
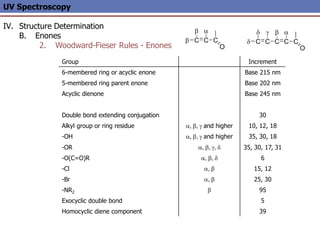
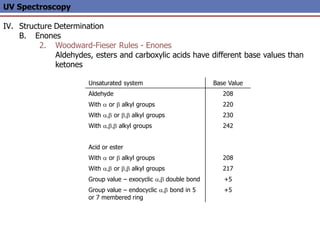
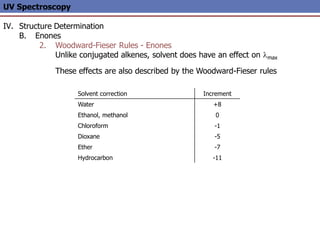
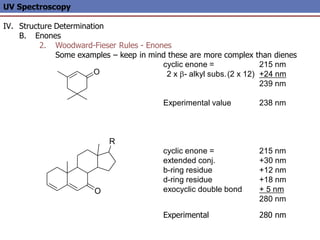
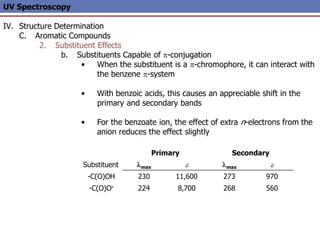
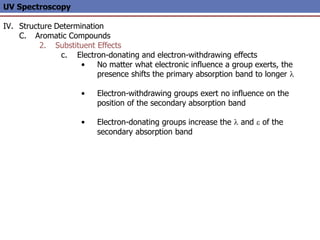
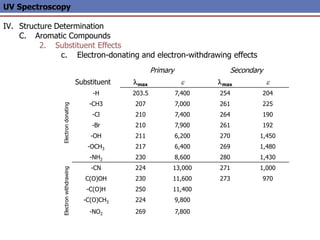
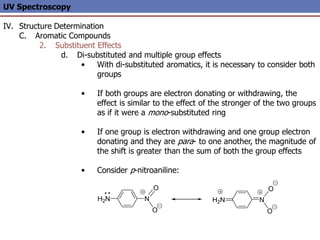
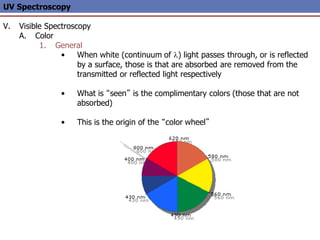
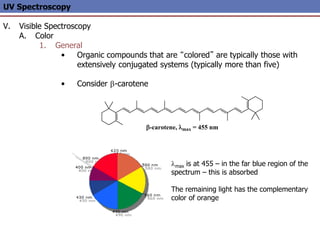
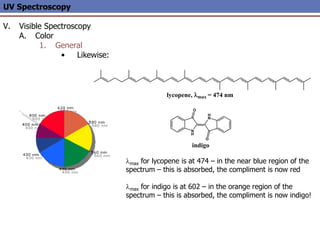
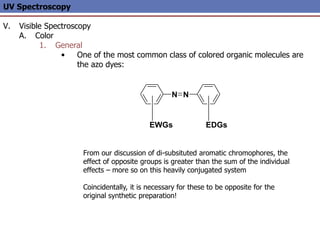
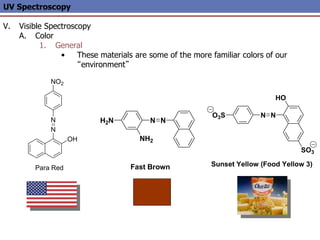
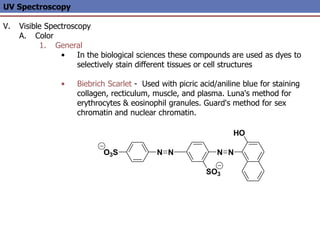
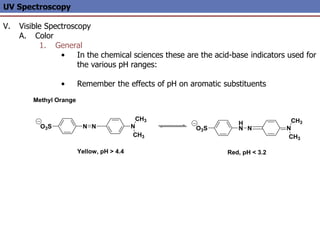
SlideShare a Scribd company logo
Y2*
p
Y1
Y1
Y2
Y3
*
Y4
*
UV Spectroscopy
I. Introduction
A. UV radiation and Electronic Excitations
1. The difference in energy between molecular bonding, non-bonding and
anti-bonding orbitals ranges from 125-650 kJ/mole.
2. This energy corresponds to EM radiation in the ultraviolet (UV) region,
200-400 nm, and visible (VIS) regions 400-800 nm of the spectrum.
3. For comparison, recall the EM spectrum:
4. Using IR we observed vibrational transitions with energies of 8-40 kJ/mol
at wavelengths of 2500-15,000 nm.
5. For purposes of our discussion, we will refer to UV and VIS spectroscopy
as UV.
UV
X-rays IR
g-rays Radio
Microwave
Visible
UV Spectroscopy
I. Introduction
B. The Spectroscopic Process
1. In UV spectroscopy, the sample is irradiated with the broad spectrum of
the UV radiation
2. If a particular electronic transition matches the energy of a certain band
of UV, it will be absorbed
3. The remaining UV light passes through the sample and is observed
4. From this residual radiation a spectrum is obtained with “gaps” at these
discrete energies – this is called an absorption spectrum
p
p*
p
p*
UV Spectroscopy
I. Introduction
C. Observed electronic transitions
1. The lowest energy transition (and most often obs. by UV) is typically that
of an electron in the Highest Occupied Molecular Orbital (HOMO) to the
Lowest Unoccupied Molecular Orbital (LUMO)
2. For any bond (pair of electrons) in a molecule, the molecular orbitals are
a mixture of the two contributing atomic orbitals; for every bonding
orbital “created” from this mixing (s, p), there is a corresponding anti-
bonding orbital of symmetrically higher energy (s*, p*)
3. The lowest energy occupied orbitals are typically the s; likewise, the
corresponding anti-bonding s* orbital is of the highest energy
4. p-orbitals are of somewhat higher energy, and their complementary anti-
bonding orbital somewhat lower in energy than s*.
5. Unshared pairs lie at the energy of the original atomic orbital, most often
this energy is higher than p or s (since no bond is formed, there is no
benefit in energy)
UV Spectroscopy
I. Introduction
C. Observed electronic transitions
6. Here is a graphical representation
Energy
s*
p
s
p*
n
Atomic orbital
Atomic orbital
Molecular orbitals
Occupied levels
Unoccupied levels
UV Spectroscopy
I. Introduction
C. Observed electronic transitions
7. From the molecular orbital diagram, there are several possible electronic
transitions that can occur, each of a different relative energy:
Energy
s*
p
s
p*
n
s
s
p
n
n
s*
p*
p*
s*
p*
alkanes
carbonyls
unsaturated cmpds.
O, N, S, halogens
carbonyls
UV Spectroscopy
I. Introduction
C. Observed electronic transitions
8. Although the UV spectrum extends below 100 nm (high energy), oxygen
in the atmosphere is not transparent below 200 nm
9. Special equipment to study vacuum or far UV is required
10. Routine organic UV spectra are typically collected from 200-700 nm
11. This limits the transitions that can be observed:
s
s
p
n
n
s*
p*
p*
s*
p*
alkanes
carbonyls
unsaturated cmpds.
O, N, S, halogens
carbonyls
150 nm
170 nm
180 nm √ - if conjugated!
190 nm
300 nm √
UV Spectroscopy
I. Introduction
D. Selection Rules
1. Not all transitions that are possible are observed
2. For an electron to transition, certain quantum mechanical constraints
apply – these are called “selection rules”
3. For example, an electron cannot change its spin quantum number during
a transition – these are “forbidden”
Other examples include:
• the number of electrons that can be excited at one time
• symmetry properties of the molecule
• symmetry of the electronic states
4. To further complicate matters, “forbidden” transitions are sometimes
observed (albeit at low intensity) due to other factors
UV Spectroscopy
I. Introduction
E. Band Structure
1. Unlike IR (or later NMR), where there may be upwards of 5 or more
resolvable peaks from which to elucidate structural information, UV tends
to give wide, overlapping bands
2. It would seem that since the electronic energy levels of a pure sample of
molecules would be quantized, fine, discrete bands would be observed –
for atomic spectra, this is the case
3. In molecules, when a bulk sample of molecules is observed, not all bonds
(read – pairs of electrons) are in the same vibrational or rotational energy
states
4. This effect will impact the wavelength at which a transition is observed –
very similar to the effect of H-bonding on the O-H vibrational energy
levels in neat samples
UV Spectroscopy
I. Introduction
E. Band Structure
5. When these energy levels are superimposed, the effect can be readily
explained – any transition has the possibility of being observed
Energy
Vo
V4
V3
V2
V1
Disassociation
R1 - Rn
R1 - Rn
R1 - Rn
R1 - Rn
R1 - Rn
E0
E1 Vo
V4
V3
V2
V1
Disassociation
R1 - Rn
R1 - Rn
R1 - Rn
R1 - Rn
R1 - Rn
UV Spectroscopy
II. Instrumentation and Spectra
A. Instrumentation
1. The construction of a traditional UV-VIS spectrometer is very similar to an
IR, as similar functions – sample handling, irradiation, detection and
output are required
2. Here is a simple schematic that covers most modern UV spectrometers:
sample
reference
detector
I0
I0 I0
I
log(I0/I) = A
200 700
l, nm
monochromator/
beam splitter optics
UV-VIS sources
UV Spectroscopy
II. Instrumentation and Spectra
A. Instrumentation
3. Two sources are required to scan the entire UV-VIS band:
• Deuterium lamp – covers the UV – 200-330
• Tungsten lamp – covers 330-700
4. As with the dispersive IR, the lamps illuminate the entire band of UV or
visible light; the monochromator (grating or prism) gradually changes the
small bands of radiation sent to the beam splitter
5. The beam splitter sends a separate band to a cell containing the sample
solution and a reference solution
6. The detector measures the difference between the transmitted light
through the sample (I) vs. the incident light (I0) and sends this
information to the recorder
UV Spectroscopy
II. Instrumentation and Spectra
A. Instrumentation
7. As with dispersive IR, time is required to cover the entire UV-VIS band
due to the mechanism of changing wavelengths
8. A recent improvement is the diode-array spectrophotometer - here a
prism (dispersion device) breaks apart the full spectrum transmitted
through the sample
9. Each individual band of UV is detected by a individual diodes on a silicon
wafer simultaneously – the obvious limitation is the size of the diode, so
some loss of resolution over traditional instruments is observed
sample
Polychromator
– entrance slit and dispersion device
UV-VIS sources
Diode array
UV Spectroscopy
II. Instrumentation and Spectra
B. Instrumentation – Sample Handling
1. Virtually all UV spectra are recorded solution-phase
2. Cells can be made of plastic, glass or quartz
3. Only quartz is transparent in the full 200-700 nm range; plastic and glass
are only suitable for visible spectra
4. Concentration (we will cover shortly) is empirically determined
A typical sample cell (commonly called a cuvet):
UV Spectroscopy
II. Instrumentation and Spectra
B. Instrumentation – Sample Handling
5. Solvents must be transparent in the region to be observed; the
wavelength where a solvent is no longer transparent is referred to as the
cutoff
6. Since spectra are only obtained up to 200 nm, solvents typically only
need to lack conjugated p systems or carbonyls
Common solvents and cutoffs:
acetonitrile 190
chloroform 240
cyclohexane 195
1,4-dioxane 215
95% ethanol 205
n-hexane 201
methanol 205
isooctane 195
water 190
UV Spectroscopy
II. Instrumentation and Spectra
B. Instrumentation – Sample Handling
7. Additionally solvents must preserve the fine structure (where it is actually
observed in UV!) where possible
8. H-bonding further complicates the effect of vibrational and rotational
energy levels on electronic transitions, dipole-dipole interacts less so
9. The more non-polar the solvent, the better (this is not always possible)
UV Spectroscopy
II. Instrumentation and Spectra
C. The Spectrum
1. The x-axis of the spectrum is in wavelength; 200-350 nm for UV, 200-700
for UV-VIS determinations
2. Due to the lack of any fine structure, spectra are rarely shown in their
raw form, rather, the peak maxima are simply reported as a numerical list
of “lamba max” values or lmax
lmax = 206 nm
252
317
376
O
NH2
O
UV Spectroscopy
II. Instrumentation and Spectra
C. The Spectrum
3. The y-axis of the spectrum is in absorbance, A
4. From the spectrometers point of view, absorbance is the inverse of
transmittance: A = log10 (I0/I)
5. From an experimental point of view, three other considerations must be
made:
i. a longer path length, l through the sample will cause more
UV light to be absorbed – linear effect
ii. the greater the concentration, c of the sample, the more UV
light will be absorbed – linear effect
iii. some electronic transitions are more effective at the
absorption of photon than others – molar absorptivity, e
this may vary by orders of magnitude…
UV Spectroscopy
II. Instrumentation and Spectra
C. The Spectrum
6. These effects are combined into the Beer-Lambert Law: A = e c l
i. for most UV spectrometers, l would remain constant (standard cells
are typically 1 cm in path length)
ii. concentration is typically varied depending on the strength of
absorption observed or expected – typically dilute – sub .001 M
iii. molar absorptivities vary by orders of magnitude:
• values of 104-106 are termed high intensity absorptions
• values of 103-104 are termed low intensity absorptions
• values of 0 to 103 are the absorptions of forbidden transitions
A is unitless, so the units for e are cm-1 · M-1 and are rarely expressed
7. Since path length and concentration effects can be easily factored out,
absorbance simply becomes proportional to e, and the y-axis is expressed
as e directly or as the logarithm of e
UV Spectroscopy
II. Instrumentation and Spectra
D. Practical application of UV spectroscopy
1. UV was the first organic spectral method, however, it is rarely used as a
primary method for structure determination
2. It is most useful in combination with NMR and IR data to elucidate unique
electronic features that may be ambiguous in those methods
3. It can be used to assay (via lmax and molar absorptivity) the proper
irradiation wavelengths for photochemical experiments, or the design of
UV resistant paints and coatings
4. The most ubiquitous use of UV is as a detection device for HPLC; since
UV is utilized for solution phase samples vs. a reference solvent this is
easily incorporated into LC design
UV is to HPLC what mass spectrometry (MS) will be to GC
UV Spectroscopy
III. Chromophores
A. Definition
1. Remember the electrons present in organic molecules are involved in
covalent bonds or lone pairs of electrons on atoms such as O or N
2. Since similar functional groups will have electrons capable of discrete
classes of transitions, the characteristic energy of these energies is more
representative of the functional group than the electrons themselves
3. A functional group capable of having characteristic electronic transitions is
called a chromophore (color loving)
4. Structural or electronic changes in the chromophore can be quantified
and used to predict shifts in the observed electronic transitions
UV Spectroscopy
III. Chromophores
B. Organic Chromophores
1. Alkanes – only posses s-bonds and no lone pairs of electrons, so only the
high energy s  s* transition is observed in the far UV
This transition is destructive to the molecule, causing cleavage of the s-
bond
s*
s C C
C C
UV Spectroscopy
III. Chromophores
B. Organic Chromophores
2. Alcohols, ethers, amines and sulfur compounds – in the cases of simple,
aliphatic examples of these compounds the n  s* is the most often
observed transition; like the alkane s  s* it is most often at shorter l
than 200 nm
Note how this transition occurs from the HOMO to the LUMO
s*CN
sCN
nN sp3
C N
C N
C N
C N
anitbonding
orbital
UV Spectroscopy
III. Chromophores
B. Organic Chromophores
3. Alkenes and Alkynes – in the case of isolated examples of these
compounds the p  p* is observed at 175 and 170 nm, respectively
Even though this transition is of lower energy than s  s*, it is still in
the far UV – however, the transition energy is sensitive to substitution
p*
p
UV Spectroscopy
III. Chromophores
B. Organic Chromophores
4. Carbonyls – unsaturated systems incorporating N or O can undergo
n  p* transitions (~285 nm) in addition to p  p*
Despite the fact this transition is forbidden by the selection rules (e =
15), it is the most often observed and studied transition for carbonyls
This transition is also sensitive to substituents on the carbonyl
Similar to alkenes and alkynes, non-substituted carbonyls undergo the
p  p* transition in the vacuum UV (188 nm, e = 900); sensitive to
substitution effects
UV Spectroscopy
III. Chromophores
B. Organic Chromophores
4. Carbonyls – n  p* transitions (~285 nm); p  p* (188 nm)
p
p*
n
sCO transitions omitted for clarity
O
O
C O
It has been determined
from spectral studies,
that carbonyl oxygen
more approximates sp
rather than sp2 !
UV Spectroscopy
III. Chromophores
C. Substituent Effects
General – from our brief study of these general chromophores, only the weak
n  p* transition occurs in the routinely observed UV
The attachment of substituent groups (other than H) can shift the energy
of the transition
Substituents that increase the intensity and often wavelength of an
absorption are called auxochromes
Common auxochromes include alkyl, hydroxyl, alkoxy and amino groups
and the halogens
UV Spectroscopy
III. Chromophores
C. Substituent Effects
General – Substituents may have any of four effects on a chromophore
i. Bathochromic shift (red shift) – a shift to longer l; lower energy
ii. Hypsochromic shift (blue shift) – shift to shorter l; higher energy
iii. Hyperchromic effect – an increase in intensity
iv. Hypochromic effect – a decrease in intensity
200 nm 700 nm
e
Hypochromic
Hypsochromic
Hyperchromic
Bathochromic
UV Spectroscopy
III. Chromophores
C. Substituent Effects
1. Conjugation – most efficient means of bringing about a bathochromic and
hyperchromic shift of an unsaturated chromophore:
H2C
CH2
-carotene
O
O
lmax nm e
175 15,000
217 21,000
258 35,000
n  p* 280 27
p  p* 213 7,100
465 125,000
n  p* 280 12
p  p* 189 900
UV Spectroscopy
III. Chromophores
C. Substituent Effects
1. Conjugation – Alkenes
The observed shifts from conjugation imply that an increase in
conjugation decreases the energy required for electronic excitation
From molecular orbital (MO) theory two atomic p orbitals, f1 and f2 from
two sp2 hybrid carbons combine to form two MOs Y1 and Y2* in ethylene
Y2*
p
Y1
f1 f2
UV Spectroscopy
III. Chromophores
C. Substituent Effects
2. Conjugation – Alkenes
When we consider butadiene, we are now mixing 4 p orbitals giving 4
MOs of an energetically symmetrical distribution compared to ethylene
Y2*
p
Y1
Y1
Y2
Y3
*
Y4
*
DE for the HOMO  LUMO transition is reduced
UV Spectroscopy
III. Chromophores
C. Substituent Effects
2. Conjugation – Alkenes
Extending this effect out to longer conjugated systems the energy gap
becomes progressively smaller:
Energy
ethylene
butadiene
hexatriene
octatetraene
Lower energy =
Longer wavelenghts
UV Spectroscopy
III. Chromophores
C. Substituent Effects
2. Conjugation – Alkenes
Similarly, the lone pairs of electrons on N, O, S, X can extend conjugated
systems – auxochromes
Here we create 3 MOs – this interaction is not as strong as that of a
conjugated p-system
Y2
p
Y1
A
p*
nA
Y3
*
Energy
UV Spectroscopy
III. Chromophores
C. Substituent Effects
2. Conjugation – Alkenes
Methyl groups also cause a bathochromic shift, even though they are
devoid of p- or n-electrons
This effect is thought to be through what is termed “hyperconjugation”
or sigma bond resonance
C C
C
H
H
H
UV Spectroscopy
Next time – We will find that the effect of substituent groups can be reliably quantified
from empirical observation of known conjugated structures and applied to new
systems
This quantification is referred to as the Woodward-Fieser Rules which we will apply
to three specific chromophores:
1. Conjugated dienes
2. Conjugated dienones
3. Aromatic systems
lmax = 239 nm
UV Spectroscopy
IV. Structure Determination
A. Dienes
1. General Features
For acyclic butadiene, two conformers are possible – s-cis and s-trans
The s-cis conformer is at an overall higher potential energy than the s-
trans; therefore the HOMO electrons of the conjugated system have less
of a jump to the LUMO – lower energy, longer wavelength
s-trans s-cis
UV Spectroscopy
IV. Structure Determination
A. Dienes
1. General Features
Two possible p  p* transitions can occur for butadiene Y2  Y3
* and Y2
 Y4
*
The Y2  Y4
* transition is not typically observed:
• The energy of this transition places it outside the region
typically observed – 175 nm
• For the more favorable s-trans conformation, this transition is
forbidden
The Y2  Y3
* transition is observed as an intense absorption
s-trans s-cis
175 nm –forb.
217 nm 253 nm
175 nm
Y4
*
Y2
Y1
Y3
*
UV Spectroscopy
IV. Structure Determination
A. Dienes
1. General Features
The Y2  Y3
* transition is observed as an intense absorption (e =
20,000+) based at 217 nm within the observed region of the UV
While this band is insensitive to solvent (as would be expected) it is
subject to the bathochromic and hyperchromic effects of alkyl
substituents as well as further conjugation
Consider:
lmax = 217 253 220 227 227 256 263 nm
UV Spectroscopy
IV. Structure Determination
A. Dienes
2. Woodward-Fieser Rules
Woodward and the Fiesers performed extensive studies of terpene and
steroidal alkenes and noted similar substituents and structural features
would predictably lead to an empirical prediction of the wavelength for
the lowest energy p  p* electronic transition
This work was distilled by Scott in 1964 into an extensive treatise on the
Woodward-Fieser rules in combination with comprehensive tables and
examples – (A.I. Scott, Interpretation of the Ultraviolet Spectra of Natural
Products, Pergamon, NY, 1964)
A more modern interpretation was compiled by Rao in 1975 – (C.N.R.
Rao, Ultraviolet and Visible Spectroscopy, 3rd Ed., Butterworths, London,
1975)
UV Spectroscopy
IV. Structure Determination
A. Dienes
2. Woodward-Fieser Rules - Dienes
The rules begin with a base value for lmax of the chromophore being
observed:
acyclic butadiene = 217 nm
The incremental contribution of substituents is added to this base value
from the group tables:
Group Increment
Extended conjugation +30
Each exo-cyclic C=C +5
Alkyl +5
-OCOCH3 +0
-OR +6
-SR +30
-Cl, -Br +5
-NR2 +60
UV Spectroscopy
IV. Structure Determination
A. Dienes
2. Woodward-Fieser Rules - Dienes
For example:
Isoprene - acyclic butadiene = 217 nm
one alkyl subs. + 5 nm
222 nm
Experimental value 220 nm
Allylidenecyclohexane
- acyclic butadiene = 217 nm
one exocyclic C=C + 5 nm
2 alkyl subs. +10 nm
232 nm
Experimental value 237 nm
UV Spectroscopy
IV. Structure Determination
A. Dienes
3. Woodward-Fieser Rules – Cyclic Dienes
There are two major types of cyclic dienes, with two different base values
Heteroannular (transoid): Homoannular (cisoid):
e = 5,000 – 15,000 e = 12,000-28,000
base lmax = 214 base lmax = 253
The increment table is the same as for acyclic butadienes with a couple
additions:
Group Increment
Additional homoannular +39
Where both types of diene
are present, the one with
the longer l becomes the
base
UV Spectroscopy
IV. Structure Determination
A. Dienes
3. Woodward-Fieser Rules – Cyclic Dienes
In the pre-NMR era of organic spectral determination, the power of the
method for discerning isomers is readily apparent
Consider abietic vs. levopimaric acid:
C
O
OH
C
O
OH
levopimaric acid
abietic acid
UV Spectroscopy
IV. Structure Determination
A. Dienes
3. Woodward-Fieser Rules – Cyclic Dienes
For example:
1,2,3,7,8,8a-hexahydro-8a-methylnaphthalene
heteroannular diene = 214 nm
3 alkyl subs. (3 x 5) +15 nm
1 exo C=C + 5 nm
234 nm
Experimental value 235 nm
UV Spectroscopy
IV. Structure Determination
A. Dienes
3. Woodward-Fieser Rules – Cyclic Dienes
C
O
OH
heteroannular diene = 214 nm
4 alkyl subs. (4 x 5) +20 nm
1 exo C=C + 5 nm
239 nm
homoannular diene = 253 nm
4 alkyl subs. (4 x 5) +20 nm
1 exo C=C + 5 nm
278 nm
C
O
OH
UV Spectroscopy
IV. Structure Determination
A. Dienes
3. Woodward-Fieser Rules – Cyclic Dienes
Be careful with your assignments – three common errors:
R
This compound has three exocyclic
double bonds; the indicated bond is
exocyclic to two rings
This is not a heteroannular diene; you would
use the base value for an acyclic diene
Likewise, this is not a homooannular diene;
you would use the base value for an acyclic
diene
UV Spectroscopy
IV. Structure Determination
B. Enones
1. General Features
Carbonyls, as we have discussed have two primary electronic transitions:
p
p*
n
Remember, the p  p* transition is
allowed and gives a high e, but lies
outside the routine range of UV
observation
The n  p* transition is forbidden and
gives a very low e, but can routinely be
observed
UV Spectroscopy
IV. Structure Determination
B. Enones
1. General Features
For auxochromic substitution on the carbonyl, pronounced hypsochromic
shifts are observed for the n  p* transition (lmax):
This is explained by the inductive withdrawal
of electrons by O, N or halogen from the
carbonyl carbon – this causes the n-electrons
on the carbonyl oxygen to be held more
firmly
It is important to note this is different from
the auxochromic effect on p  p* which
extends conjugation and causes a
bathochromic shift
In most cases, this bathochromic shift is not
enough to bring the p  p* transition into
the observed range
H
O
CH3
O
Cl
O
NH2
O
O
O
OH
O
293 nm
279
235
214
204
204
UV Spectroscopy
IV. Structure Determination
B. Enones
1. General Features
Conversely, if the C=O system is conjugated both the n  p* and p  p*
bands are bathochromically shifted
Here, several effects must be noted:
i. the effect is more pronounced for p  p*
ii. if the conjugated chain is long enough, the much higher
intensity p  p* band will overlap and drown out the n  p*
band
iii. the shift of the n  p* transition is not as predictable
For these reasons, empirical Woodward-Fieser rules for conjugated
enones are for the higher intensity, allowed p  p* transition
UV Spectroscopy
IV. Structure Determination
B. Enones
1. General Features
These effects are apparent from the MO diagram for a conjugated enone:
p
Y1
Y2
Y3
*
Y4
*
p*
n
p
p*
n
O
O
UV Spectroscopy
IV. Structure Determination
B. Enones
2. Woodward-Fieser Rules - Enones
Group Increment
6-membered ring or acyclic enone Base 215 nm
5-membered ring parent enone Base 202 nm
Acyclic dienone Base 245 nm
Double bond extending conjugation 30
Alkyl group or ring residue a, , g and higher 10, 12, 18
-OH a, , g and higher 35, 30, 18
-OR a, , g, d 35, 30, 17, 31
-O(C=O)R a, , d 6
-Cl a,  15, 12
-Br a,  25, 30
-NR2  95
Exocyclic double bond 5
Homocyclic diene component 39
C C C

 a
C C C
C
 a
C
g
d
d
O O
UV Spectroscopy
IV. Structure Determination
B. Enones
2. Woodward-Fieser Rules - Enones
Aldehydes, esters and carboxylic acids have different base values than
ketones
Unsaturated system Base Value
Aldehyde 208
With a or  alkyl groups 220
With a, or , alkyl groups 230
With a,, alkyl groups 242
Acid or ester
With a or  alkyl groups 208
With a, or , alkyl groups 217
Group value – exocyclic a, double bond +5
Group value – endocyclic a, bond in 5
or 7 membered ring
+5
UV Spectroscopy
IV. Structure Determination
B. Enones
2. Woodward-Fieser Rules - Enones
Unlike conjugated alkenes, solvent does have an effect on lmax
These effects are also described by the Woodward-Fieser rules
Solvent correction Increment
Water +8
Ethanol, methanol 0
Chloroform -1
Dioxane -5
Ether -7
Hydrocarbon -11
UV Spectroscopy
IV. Structure Determination
B. Enones
2. Woodward-Fieser Rules - Enones
Some examples – keep in mind these are more complex than dienes
cyclic enone = 215 nm
2 x - alkyl subs.(2 x 12) +24 nm
239 nm
Experimental value 238 nm
cyclic enone = 215 nm
extended conj. +30 nm
b-ring residue +12 nm
d-ring residue +18 nm
exocyclic double bond + 5 nm
280 nm
Experimental 280 nm
O
R
O
UV Spectroscopy
IV. Structure Determination
B. Enones
2. Woodward-Fieser Rules - Enones
Take home problem – can these two isomers be discerned by UV-spec
O
O
Eremophilone allo-Eremophilone
Problem Set 1: (text) – 1,2,3a,b,c,d,e,f,j, 4, 5, 6 (1st, 2nd and 5th pairs),
8a, b, c
Problem Set 2: outside problems/key -Tuesday
UV Spectroscopy
IV. Structure Determination
C. Aromatic Compounds
1. General Features
Although aromatic rings are among the most widely studied and observed
chromophores, the absorptions that arise from the various electronic
transitions are complex
On first inspection, benzene has six p-MOs, 3 filled p, 3 unfilled p*
p4* p5*
p6*
p2
p1
p3
UV Spectroscopy
IV. Structure Determination
C. Aromatic Compounds
1. General Features
One would expect there to be four possible HOMO-LUMO p  p*
transitions at observable wavelengths (conjugation)
Due to symmetry concerns and selection rules, the actual transition
energy states of benzene are illustrated at the right:
p4* p5*
p6*
p2
p1
p3
A1g
B2u
B1u
E1u
260 nm
(forbidden)
200 nm
(forbidden)
180 nm
(allowed)
UV Spectroscopy
IV. Structure Determination
C. Aromatic Compounds
1. General Features
The allowed transition (e = 47,000) is not in the routine range of UV obs.
at 180 nm, and is referred to as the primary band
The forbidden transition (e = 7400) is observed if substituent effects shift
it into the obs. region; this is referred to as the second primary band
At 260 nm is another forbidden
transition (e = 230), referred to
as the secondary band.
This transition is fleetingly allowed
due to the disruption of symmetry
by the vibrational energy states,
the overlap of which is observed
in what is called fine structure
UV Spectroscopy
IV. Structure Determination
C. Aromatic Compounds
1. General Features
Substitution, auxochromic, conjugation and solvent effects can cause
shifts in wavelength and intensity of aromatic systems similar to dienes
and enones
However, these shifts are difficult to predict – the formulation of empirical
rules is for the most part is not efficient (there are more exceptions than
rules)
There are some general qualitative observations that can be made by
classifying substituent groups --
UV Spectroscopy
IV. Structure Determination
C. Aromatic Compounds
2. Substituent Effects
a. Substituents with Unshared Electrons
• If the group attached to the ring bears n electrons, they can
induce a shift in the primary and secondary absorption bands
• Non-bonding electrons extend the p-system through
resonance – lowering the energy of transition p  p*
• More available n-pairs of electrons give greater shifts
G
G G G
UV Spectroscopy
IV. Structure Determination
C. Aromatic Compounds
2. Substituent Effects
a. Substituents with Unshared Electrons
• The presence of n-electrons gives the possibility of n  p*
transitions
• If this occurs, the electron now removed from G, becomes an
extra electron in the anti-bonding p* orbital of the ring
• This state is referred to as a charge-transfer excited state
G
G G G
*
-
*
*
*
UV Spectroscopy
IV. Structure Determination
C. Aromatic Compounds
2. Substituent Effects
a. Substituents with Unshared Electrons
• pH can change the nature of the substituent group
• deprotonation of oxygen gives more available n-pairs,
lowering transition energy
• protonation of nitrogen eliminates the n-pair,
raising transition energy
Primary Secondary
Substituent lmax e lmax e
-H 203.5 7,400 254 204
-OH 211 6,200 270 1,450
-O- 235 9,400 287 2,600
-NH2 230 8,600 280 1,430
-NH3
+ 203 7,500 254 169
-C(O)OH 230 11,600 273 970
-C(O)O- 224 8,700 268 560
UV Spectroscopy
IV. Structure Determination
C. Aromatic Compounds
2. Substituent Effects
b. Substituents Capable of p-conjugation
• When the substituent is a p-chromophore, it can interact with
the benzene p-system
• With benzoic acids, this causes an appreciable shift in the
primary and secondary bands
• For the benzoate ion, the effect of extra n-electrons from the
anion reduces the effect slightly
Primary Secondary
Substituent lmax e lmax e
-C(O)OH 230 11,600 273 970
-C(O)O- 224 8,700 268 560
UV Spectroscopy
IV. Structure Determination
C. Aromatic Compounds
2. Substituent Effects
c. Electron-donating and electron-withdrawing effects
• No matter what electronic influence a group exerts, the
presence shifts the primary absorption band to longer l
• Electron-withdrawing groups exert no influence on the
position of the secondary absorption band
• Electron-donating groups increase the l and e of the
secondary absorption band
UV Spectroscopy
IV. Structure Determination
C. Aromatic Compounds
2. Substituent Effects
c. Electron-donating and electron-withdrawing effects
Primary Secondary
Substituent lmax e lmax e
-H 203.5 7,400 254 204
-CH3 207 7,000 261 225
-Cl 210 7,400 264 190
-Br 210 7,900 261 192
-OH 211 6,200 270 1,450
-OCH3 217 6,400 269 1,480
-NH2 230 8,600 280 1,430
-CN 224 13,000 271 1,000
C(O)OH 230 11,600 273 970
-C(O)H 250 11,400
-C(O)CH3 224 9,800
-NO2 269 7,800
Electron
donating
Electron
withdrawing
UV Spectroscopy
IV. Structure Determination
C. Aromatic Compounds
2. Substituent Effects
d. Di-substituted and multiple group effects
• With di-substituted aromatics, it is necessary to consider both
groups
• If both groups are electron donating or withdrawing, the
effect is similar to the effect of the stronger of the two groups
as if it were a mono-substituted ring
• If one group is electron withdrawing and one group electron
donating and they are para- to one another, the magnitude of
the shift is greater than the sum of both the group effects
• Consider p-nitroaniline:
H2N N
O
O
H2N N
O
O
UV Spectroscopy
IV. Structure Determination
C. Aromatic Compounds
2. Substituent Effects
d. Di-substituted and multiple group effects
• If the two electonically dissimilar groups are ortho- or meta-
to one another, the effect is usually the sum of the two
individual effects (meta- no resonance; ortho-steric hind.)
• For the case of substituted benzoyl derivatives, an empirical
correlation of structure with observed lmax has been
developed
• This is slightly less accurate than the Woodward-Fieser rules,
but can usually predict within an error of 5 nm
R
O
G
UV Spectroscopy
IV. Structure Determination
C. Aromatic Compounds
2. Substituent Effects
d. Di-substituted and multiple group effects
R
O
G
Substituent increment
G o m p
Alkyl or ring residue 3 3 10
-O-Alkyl, -OH, -O-Ring 7 7 25
-O- 11 20 78
-Cl 0 0 10
-Br 2 2 15
-NH2 13 13 58
-NHC(O)CH3 20 20 45
-NHCH3 73
-N(CH3)2 20 20 85
Parent Chromophore lmax
R = alkyl or ring residue 246
R = H 250
R = OH or O-Alkyl 230
UV Spectroscopy
IV. Structure Determination
C. Aromatic Compounds
2. Substituent Effects
d. Polynuclear aromatics
• When the number of fused aromatic rings increases, the l for
the primary and secondary bands also increase
• For heteroaromatic systems spectra become complex with the
addition of the n  p* transition and ring size effects and are
unique to each case
UV Spectroscopy
V. Visible Spectroscopy
A. Color
1. General
• The portion of the EM spectrum from 400-800 is observable to
humans- we (and some other mammals) have the adaptation of
seeing color at the expense of greater detail
400 500 600 800
700
l, nm
Violet 400-420
Indigo 420-440
Blue 440-490
Green 490-570
Yellow 570-585
Orange 585-620
Red 620-780
UV Spectroscopy
V. Visible Spectroscopy
A. Color
1. General
• When white (continuum of l) light passes through, or is reflected
by a surface, those is that are absorbed are removed from the
transmitted or reflected light respectively
• What is “seen” is the complimentary colors (those that are not
absorbed)
• This is the origin of the “color wheel”
UV Spectroscopy
V. Visible Spectroscopy
A. Color
1. General
• Organic compounds that are “colored” are typically those with
extensively conjugated systems (typically more than five)
• Consider -carotene
-carotene, lmax = 455 nm
lmax is at 455 – in the far blue region of the
spectrum – this is absorbed
The remaining light has the complementary
color of orange
UV Spectroscopy
V. Visible Spectroscopy
A. Color
1. General
• Likewise:
lmax for lycopene is at 474 – in the near blue region of the
spectrum – this is absorbed, the compliment is now red
lmax for indigo is at 602 – in the orange region of the
spectrum – this is absorbed, the compliment is now indigo!
lycopene, lmax = 474 nm
N
H
H
N
O
O
indigo
UV Spectroscopy
V. Visible Spectroscopy
A. Color
1. General
• One of the most common class of colored organic molecules are
the azo dyes:
From our discussion of di-subsituted aromatic chromophores, the
effect of opposite groups is greater than the sum of the individual
effects – more so on this heavily conjugated system
Coincidentally, it is necessary for these to be opposite for the
original synthetic preparation!
N N
EDGs
EWGs
OH
N
N
NO2
Para Red
N
N
NH2
H2N
Fast Brown
N
N
O3S
HO
SO3
Sunset Yellow (Food Yellow 3)
UV Spectroscopy
V. Visible Spectroscopy
A. Color
1. General
• These materials are some of the more familiar colors of our
“environment”
The colors of M&M’s
Bright Blue
Common Food Uses
Beverages, dairy products, powders, jellies, confections,
condiments, icing.
Royal Blue
Common Food Uses
Baked goods, cereals, snack foods, ice-cream, confections,
cherries.
Orange-red
Common Food Uses
Gelatins, puddings, dairy products, confections, beverages,
condiments.
Lemon-yellow
Common Food Uses
Custards, beverages, ice-cream, confections, preserves,
cereals.
Orange
Common Food Uses
Cereals, baked goods, snack foods, ice-cream, beverages,
dessert powders, confections
N
N
O3S
SO3
N N
HO
UV Spectroscopy
V. Visible Spectroscopy
A. Color
1. General
• In the biological sciences these compounds are used as dyes to
selectively stain different tissues or cell structures
• Biebrich Scarlet - Used with picric acid/aniline blue for staining
collagen, recticulum, muscle, and plasma. Luna's method for
erythrocytes & eosinophil granules. Guard's method for sex
chromatin and nuclear chromatin.
N
N
O3S N
CH3
CH3
N
H
N
O3S N
CH3
CH3
Yellow, pH > 4.4 Red, pH < 3.2
Methyl Orange
UV Spectroscopy
V. Visible Spectroscopy
A. Color
1. General
• In the chemical sciences these are the acid-base indicators used for
the various pH ranges:
• Remember the effects of pH on aromatic substituents
Dr. Ashwani Dhingra
Associate Professor
GGSCOP, Yamunanagar
Thank you

More Related Content

What's hot

Types of atomic fluorescence transitions.
Types of atomic fluorescence transitions.Types of atomic fluorescence transitions.
Types of atomic fluorescence transitions.
MaryamAfzal19
 
Dept nmr
Dept nmrDept nmr
Dept nmr
SidruAkhtar
 
FT- NMR
FT- NMRFT- NMR
FT- NMR
aishuanju
 
Uv visible spectroscopy ppt
Uv visible spectroscopy pptUv visible spectroscopy ppt
Uv visible spectroscopy ppt
Alexa Jacob
 
Woodward__fieser Rule
Woodward__fieser Rule Woodward__fieser Rule
Woodward__fieser Rule
Faizan Ahmed Mohammed Israeel
 
UV visible spectroscopy ( electronic spectroscopy)
UV visible spectroscopy ( electronic spectroscopy)UV visible spectroscopy ( electronic spectroscopy)
UV visible spectroscopy ( electronic spectroscopy)
ushaSanmugaraj
 
NMR SPECTROSCOPY
NMR SPECTROSCOPYNMR SPECTROSCOPY
NMR SPECTROSCOPY
sharmeenkhan15
 
Various factor affecting vibrational frequency in IR spectroscopy.
Various factor affecting vibrational frequency in IR spectroscopy.Various factor affecting vibrational frequency in IR spectroscopy.
Various factor affecting vibrational frequency in IR spectroscopy.
vishvajitsinh Bhati
 
NMR- Diamagnetic Anisotropy and its effect on chemical shift
NMR- Diamagnetic Anisotropy and its effect on chemical shiftNMR- Diamagnetic Anisotropy and its effect on chemical shift
NMR- Diamagnetic Anisotropy and its effect on chemical shift
D.R. Chandravanshi
 
Ir spectroscopy ppt
Ir spectroscopy pptIr spectroscopy ppt
Ir spectroscopy ppt
Parimi Anuradha
 
Coupling constant
Coupling constantCoupling constant
Coupling constant
LOKANATH MOHAPATRA
 
Uv visible-spectroscopy
Uv visible-spectroscopy Uv visible-spectroscopy
Uv visible-spectroscopy
Protik Biswas
 
INTERPRETATION OF IR SPECTROSCOPY
INTERPRETATION OF IR SPECTROSCOPYINTERPRETATION OF IR SPECTROSCOPY
INTERPRETATION OF IR SPECTROSCOPY
OORATHI SASIVARDHAN
 
UV-Visible Spectroscopy
UV-Visible SpectroscopyUV-Visible Spectroscopy
UV-Visible Spectroscopy
Ashish Roge
 
Fragmentation Pattern in Mass Spectra
Fragmentation Pattern in Mass SpectraFragmentation Pattern in Mass Spectra
Fragmentation Pattern in Mass Spectra
SPCGC AJMER
 
woodward fieser rule
 woodward fieser rule woodward fieser rule
woodward fieser rule
Kavitha Bitra
 
Fragmentation of different functional groups
Fragmentation of different functional groupsFragmentation of different functional groups
Fragmentation of different functional groups
Ashwin Shetty
 
Electron Spin Resonance Spectroscopy
Electron Spin Resonance Spectroscopy Electron Spin Resonance Spectroscopy
Electron Spin Resonance Spectroscopy
Saiva Bhanu Kshatriya College, Aruppukottai.
 

What's hot (20)

Types of atomic fluorescence transitions.
Types of atomic fluorescence transitions.Types of atomic fluorescence transitions.
Types of atomic fluorescence transitions.
 
Dept nmr
Dept nmrDept nmr
Dept nmr
 
FT- NMR
FT- NMRFT- NMR
FT- NMR
 
2d NMR
2d NMR2d NMR
2d NMR
 
Uv visible spectroscopy ppt
Uv visible spectroscopy pptUv visible spectroscopy ppt
Uv visible spectroscopy ppt
 
Woodward__fieser Rule
Woodward__fieser Rule Woodward__fieser Rule
Woodward__fieser Rule
 
UV visible spectroscopy ( electronic spectroscopy)
UV visible spectroscopy ( electronic spectroscopy)UV visible spectroscopy ( electronic spectroscopy)
UV visible spectroscopy ( electronic spectroscopy)
 
Ir spectroscopy
Ir spectroscopyIr spectroscopy
Ir spectroscopy
 
NMR SPECTROSCOPY
NMR SPECTROSCOPYNMR SPECTROSCOPY
NMR SPECTROSCOPY
 
Various factor affecting vibrational frequency in IR spectroscopy.
Various factor affecting vibrational frequency in IR spectroscopy.Various factor affecting vibrational frequency in IR spectroscopy.
Various factor affecting vibrational frequency in IR spectroscopy.
 
NMR- Diamagnetic Anisotropy and its effect on chemical shift
NMR- Diamagnetic Anisotropy and its effect on chemical shiftNMR- Diamagnetic Anisotropy and its effect on chemical shift
NMR- Diamagnetic Anisotropy and its effect on chemical shift
 
Ir spectroscopy ppt
Ir spectroscopy pptIr spectroscopy ppt
Ir spectroscopy ppt
 
Coupling constant
Coupling constantCoupling constant
Coupling constant
 
Uv visible-spectroscopy
Uv visible-spectroscopy Uv visible-spectroscopy
Uv visible-spectroscopy
 
INTERPRETATION OF IR SPECTROSCOPY
INTERPRETATION OF IR SPECTROSCOPYINTERPRETATION OF IR SPECTROSCOPY
INTERPRETATION OF IR SPECTROSCOPY
 
UV-Visible Spectroscopy
UV-Visible SpectroscopyUV-Visible Spectroscopy
UV-Visible Spectroscopy
 
Fragmentation Pattern in Mass Spectra
Fragmentation Pattern in Mass SpectraFragmentation Pattern in Mass Spectra
Fragmentation Pattern in Mass Spectra
 
woodward fieser rule
 woodward fieser rule woodward fieser rule
woodward fieser rule
 
Fragmentation of different functional groups
Fragmentation of different functional groupsFragmentation of different functional groups
Fragmentation of different functional groups
 
Electron Spin Resonance Spectroscopy
Electron Spin Resonance Spectroscopy Electron Spin Resonance Spectroscopy
Electron Spin Resonance Spectroscopy
 

Similar to UV Spectroscopy

Uv spectroscopy
Uv spectroscopyUv spectroscopy
Uv spectroscopy
Zainab&Sons
 
Uv spectroscopy (Collected)
Uv spectroscopy (Collected)Uv spectroscopy (Collected)
Uv spectroscopy (Collected)
Istiqur Rahman
 
Uv-vis Spectroscopy
Uv-vis SpectroscopyUv-vis Spectroscopy
Uv-vis Spectroscopy
subramanian Subramanian
 
UV Spectroscopy
UV Spectroscopy UV Spectroscopy
UV Spectroscopy
Adnan Sohail Akhtar
 
Chapter 1 ultraviolet Spectroscopy 1.pdf
Chapter 1 ultraviolet Spectroscopy 1.pdfChapter 1 ultraviolet Spectroscopy 1.pdf
Chapter 1 ultraviolet Spectroscopy 1.pdf
hend49
 
Uv visible spectroscopy
Uv visible spectroscopyUv visible spectroscopy
Uv visible spectroscopy
Narjis Shahid
 
UV Spectroscopy- Pharmaceutical Analysis
UV Spectroscopy- Pharmaceutical AnalysisUV Spectroscopy- Pharmaceutical Analysis
UV Spectroscopy- Pharmaceutical Analysis
PHARMACAD
 
UV-Vis spectroscopy description note.ppt
UV-Vis spectroscopy description note.pptUV-Vis spectroscopy description note.ppt
UV-Vis spectroscopy description note.ppt
itelitel
 
Uv visible spectroscopy
Uv visible spectroscopyUv visible spectroscopy
Uv visible spectroscopy
gracepaulraj
 
Ultra violet (UV) spectroscopy, introduction,principle instrumentation,differ...
Ultra violet (UV) spectroscopy, introduction,principle instrumentation,differ...Ultra violet (UV) spectroscopy, introduction,principle instrumentation,differ...
Ultra violet (UV) spectroscopy, introduction,principle instrumentation,differ...
mariomS7
 
Uvspectroscopyup
UvspectroscopyupUvspectroscopyup
Uvspectroscopyup
Naveed Ahmed
 
12 02-09-12-24-23-1390-sampathkumar
12 02-09-12-24-23-1390-sampathkumar12 02-09-12-24-23-1390-sampathkumar
12 02-09-12-24-23-1390-sampathkumar
DONIKAMARKANDE
 
Uvspectroscopyup 140119003106-phpapp01
Uvspectroscopyup 140119003106-phpapp01Uvspectroscopyup 140119003106-phpapp01
Uvspectroscopyup 140119003106-phpapp01
Shaik Imran
 
UV spectrometery; woodward fischer rule
UV spectrometery; woodward fischer ruleUV spectrometery; woodward fischer rule
UV spectrometery; woodward fischer rule
AJAYKUMAR4872
 
Ultraviolet and visible spectrophotometer and Its application in pharmaceutic...
Ultraviolet and visible spectrophotometer and Its application in pharmaceutic...Ultraviolet and visible spectrophotometer and Its application in pharmaceutic...
Ultraviolet and visible spectrophotometer and Its application in pharmaceutic...
nikhil kadam
 
Elementary organic spectroscopy
Elementary organic spectroscopyElementary organic spectroscopy
Elementary organic spectroscopy
lsk1976
 
Md Rashed Hassan
Md Rashed HassanMd Rashed Hassan
Md Rashed Hassan
Md Rashed Hassan
 
Lec.2 woodward fishers rule 13.02.17
Lec.2   woodward fishers rule 13.02.17Lec.2   woodward fishers rule 13.02.17
Lec.2 woodward fishers rule 13.02.17
IBRAHIM Aminu Shehu
 
UV-Vis 0422034001_Md. Ershad Khan.pptx
UV-Vis 0422034001_Md. Ershad Khan.pptxUV-Vis 0422034001_Md. Ershad Khan.pptx
UV-Vis 0422034001_Md. Ershad Khan.pptx
MdErshadKhan
 
Unit 5 Spectroscopic Techniques-converted (1) (1).pdf
Unit 5 Spectroscopic Techniques-converted (1) (1).pdfUnit 5 Spectroscopic Techniques-converted (1) (1).pdf
Unit 5 Spectroscopic Techniques-converted (1) (1).pdf
SurajShinde558909
 

Similar to UV Spectroscopy (20)

Uv spectroscopy
Uv spectroscopyUv spectroscopy
Uv spectroscopy
 
Uv spectroscopy (Collected)
Uv spectroscopy (Collected)Uv spectroscopy (Collected)
Uv spectroscopy (Collected)
 
Uv-vis Spectroscopy
Uv-vis SpectroscopyUv-vis Spectroscopy
Uv-vis Spectroscopy
 
UV Spectroscopy
UV Spectroscopy UV Spectroscopy
UV Spectroscopy
 
Chapter 1 ultraviolet Spectroscopy 1.pdf
Chapter 1 ultraviolet Spectroscopy 1.pdfChapter 1 ultraviolet Spectroscopy 1.pdf
Chapter 1 ultraviolet Spectroscopy 1.pdf
 
Uv visible spectroscopy
Uv visible spectroscopyUv visible spectroscopy
Uv visible spectroscopy
 
UV Spectroscopy- Pharmaceutical Analysis
UV Spectroscopy- Pharmaceutical AnalysisUV Spectroscopy- Pharmaceutical Analysis
UV Spectroscopy- Pharmaceutical Analysis
 
UV-Vis spectroscopy description note.ppt
UV-Vis spectroscopy description note.pptUV-Vis spectroscopy description note.ppt
UV-Vis spectroscopy description note.ppt
 
Uv visible spectroscopy
Uv visible spectroscopyUv visible spectroscopy
Uv visible spectroscopy
 
Ultra violet (UV) spectroscopy, introduction,principle instrumentation,differ...
Ultra violet (UV) spectroscopy, introduction,principle instrumentation,differ...Ultra violet (UV) spectroscopy, introduction,principle instrumentation,differ...
Ultra violet (UV) spectroscopy, introduction,principle instrumentation,differ...
 
Uvspectroscopyup
UvspectroscopyupUvspectroscopyup
Uvspectroscopyup
 
12 02-09-12-24-23-1390-sampathkumar
12 02-09-12-24-23-1390-sampathkumar12 02-09-12-24-23-1390-sampathkumar
12 02-09-12-24-23-1390-sampathkumar
 
Uvspectroscopyup 140119003106-phpapp01
Uvspectroscopyup 140119003106-phpapp01Uvspectroscopyup 140119003106-phpapp01
Uvspectroscopyup 140119003106-phpapp01
 
UV spectrometery; woodward fischer rule
UV spectrometery; woodward fischer ruleUV spectrometery; woodward fischer rule
UV spectrometery; woodward fischer rule
 
Ultraviolet and visible spectrophotometer and Its application in pharmaceutic...
Ultraviolet and visible spectrophotometer and Its application in pharmaceutic...Ultraviolet and visible spectrophotometer and Its application in pharmaceutic...
Ultraviolet and visible spectrophotometer and Its application in pharmaceutic...
 
Elementary organic spectroscopy
Elementary organic spectroscopyElementary organic spectroscopy
Elementary organic spectroscopy
 
Md Rashed Hassan
Md Rashed HassanMd Rashed Hassan
Md Rashed Hassan
 
Lec.2 woodward fishers rule 13.02.17
Lec.2   woodward fishers rule 13.02.17Lec.2   woodward fishers rule 13.02.17
Lec.2 woodward fishers rule 13.02.17
 
UV-Vis 0422034001_Md. Ershad Khan.pptx
UV-Vis 0422034001_Md. Ershad Khan.pptxUV-Vis 0422034001_Md. Ershad Khan.pptx
UV-Vis 0422034001_Md. Ershad Khan.pptx
 
Unit 5 Spectroscopic Techniques-converted (1) (1).pdf
Unit 5 Spectroscopic Techniques-converted (1) (1).pdfUnit 5 Spectroscopic Techniques-converted (1) (1).pdf
Unit 5 Spectroscopic Techniques-converted (1) (1).pdf
 

More from Ashwani Dhingra

Innovative Teaching Learning Methodologies
Innovative Teaching Learning MethodologiesInnovative Teaching Learning Methodologies
Innovative Teaching Learning Methodologies
Ashwani Dhingra
 
Factorial Design.pptx
Factorial Design.pptxFactorial Design.pptx
Factorial Design.pptx
Ashwani Dhingra
 
DRUG DISCOVERY & COMPUTER-AIDED DRUG DESIGN
DRUG DISCOVERY & COMPUTER-AIDED DRUG DESIGNDRUG DISCOVERY & COMPUTER-AIDED DRUG DESIGN
DRUG DISCOVERY & COMPUTER-AIDED DRUG DESIGN
Ashwani Dhingra
 
Medicinal and Aromatic Plants.pptx
Medicinal and Aromatic Plants.pptxMedicinal and Aromatic Plants.pptx
Medicinal and Aromatic Plants.pptx
Ashwani Dhingra
 
Immunological Assay.pptx
Immunological Assay.pptxImmunological Assay.pptx
Immunological Assay.pptx
Ashwani Dhingra
 
HPTLC.pptx
HPTLC.pptxHPTLC.pptx
HPTLC.pptx
Ashwani Dhingra
 
Alternative to Animal Experimentation.pptx
Alternative to Animal Experimentation.pptxAlternative to Animal Experimentation.pptx
Alternative to Animal Experimentation.pptx
Ashwani Dhingra
 
Freedom to Operate
Freedom to OperateFreedom to Operate
Freedom to Operate
Ashwani Dhingra
 
Strategies in Drug Design
Strategies in Drug DesignStrategies in Drug Design
Strategies in Drug Design
Ashwani Dhingra
 
Drug Regulatory Affairs
Drug Regulatory AffairsDrug Regulatory Affairs
Drug Regulatory Affairs
Ashwani Dhingra
 
Patent Process: Filing to Grant
Patent Process: Filing to GrantPatent Process: Filing to Grant
Patent Process: Filing to Grant
Ashwani Dhingra
 
The Statisticians Role in Pharmaceutical Development
The Statisticians Role in Pharmaceutical DevelopmentThe Statisticians Role in Pharmaceutical Development
The Statisticians Role in Pharmaceutical Development
Ashwani Dhingra
 
Searching for Patents
Searching for PatentsSearching for Patents
Searching for Patents
Ashwani Dhingra
 
Electrophoresis
ElectrophoresisElectrophoresis
Electrophoresis
Ashwani Dhingra
 
High Performance Liquid Chromatography
High Performance Liquid ChromatographyHigh Performance Liquid Chromatography
High Performance Liquid Chromatography
Ashwani Dhingra
 
Ion Exchange Chromatography
Ion Exchange ChromatographyIon Exchange Chromatography
Ion Exchange Chromatography
Ashwani Dhingra
 
Fragmentation Pattern of Mass Spectrometry
Fragmentation Pattern of Mass SpectrometryFragmentation Pattern of Mass Spectrometry
Fragmentation Pattern of Mass Spectrometry
Ashwani Dhingra
 
Mass Spectrometry
Mass SpectrometryMass Spectrometry
Mass Spectrometry
Ashwani Dhingra
 
Antihyperlipidemic drug
Antihyperlipidemic drugAntihyperlipidemic drug
Antihyperlipidemic drug
Ashwani Dhingra
 
Infrared (IR) Spectroscopy
Infrared (IR) SpectroscopyInfrared (IR) Spectroscopy
Infrared (IR) Spectroscopy
Ashwani Dhingra
 

More from Ashwani Dhingra (20)

Innovative Teaching Learning Methodologies
Innovative Teaching Learning MethodologiesInnovative Teaching Learning Methodologies
Innovative Teaching Learning Methodologies
 
Factorial Design.pptx
Factorial Design.pptxFactorial Design.pptx
Factorial Design.pptx
 
DRUG DISCOVERY & COMPUTER-AIDED DRUG DESIGN
DRUG DISCOVERY & COMPUTER-AIDED DRUG DESIGNDRUG DISCOVERY & COMPUTER-AIDED DRUG DESIGN
DRUG DISCOVERY & COMPUTER-AIDED DRUG DESIGN
 
Medicinal and Aromatic Plants.pptx
Medicinal and Aromatic Plants.pptxMedicinal and Aromatic Plants.pptx
Medicinal and Aromatic Plants.pptx
 
Immunological Assay.pptx
Immunological Assay.pptxImmunological Assay.pptx
Immunological Assay.pptx
 
HPTLC.pptx
HPTLC.pptxHPTLC.pptx
HPTLC.pptx
 
Alternative to Animal Experimentation.pptx
Alternative to Animal Experimentation.pptxAlternative to Animal Experimentation.pptx
Alternative to Animal Experimentation.pptx
 
Freedom to Operate
Freedom to OperateFreedom to Operate
Freedom to Operate
 
Strategies in Drug Design
Strategies in Drug DesignStrategies in Drug Design
Strategies in Drug Design
 
Drug Regulatory Affairs
Drug Regulatory AffairsDrug Regulatory Affairs
Drug Regulatory Affairs
 
Patent Process: Filing to Grant
Patent Process: Filing to GrantPatent Process: Filing to Grant
Patent Process: Filing to Grant
 
The Statisticians Role in Pharmaceutical Development
The Statisticians Role in Pharmaceutical DevelopmentThe Statisticians Role in Pharmaceutical Development
The Statisticians Role in Pharmaceutical Development
 
Searching for Patents
Searching for PatentsSearching for Patents
Searching for Patents
 
Electrophoresis
ElectrophoresisElectrophoresis
Electrophoresis
 
High Performance Liquid Chromatography
High Performance Liquid ChromatographyHigh Performance Liquid Chromatography
High Performance Liquid Chromatography
 
Ion Exchange Chromatography
Ion Exchange ChromatographyIon Exchange Chromatography
Ion Exchange Chromatography
 
Fragmentation Pattern of Mass Spectrometry
Fragmentation Pattern of Mass SpectrometryFragmentation Pattern of Mass Spectrometry
Fragmentation Pattern of Mass Spectrometry
 
Mass Spectrometry
Mass SpectrometryMass Spectrometry
Mass Spectrometry
 
Antihyperlipidemic drug
Antihyperlipidemic drugAntihyperlipidemic drug
Antihyperlipidemic drug
 
Infrared (IR) Spectroscopy
Infrared (IR) SpectroscopyInfrared (IR) Spectroscopy
Infrared (IR) Spectroscopy
 

Recently uploaded

Polish students' mobility in the Czech Republic
Polish students' mobility in the Czech RepublicPolish students' mobility in the Czech Republic
Polish students' mobility in the Czech Republic
Anna Sz.
 
Instructions for Submissions thorugh G- Classroom.pptx
Instructions for Submissions thorugh G- Classroom.pptxInstructions for Submissions thorugh G- Classroom.pptx
Instructions for Submissions thorugh G- Classroom.pptx
Jheel Barad
 
The Roman Empire A Historical Colossus.pdf
The Roman Empire A Historical Colossus.pdfThe Roman Empire A Historical Colossus.pdf
The Roman Empire A Historical Colossus.pdf
kaushalkr1407
 
Synthetic Fiber Construction in lab .pptx
Synthetic Fiber Construction in lab .pptxSynthetic Fiber Construction in lab .pptx
Synthetic Fiber Construction in lab .pptx
Pavel ( NSTU)
 
The basics of sentences session 5pptx.pptx
The basics of sentences session 5pptx.pptxThe basics of sentences session 5pptx.pptx
The basics of sentences session 5pptx.pptx
heathfieldcps1
 
Palestine last event orientationfvgnh .pptx
Palestine last event orientationfvgnh .pptxPalestine last event orientationfvgnh .pptx
Palestine last event orientationfvgnh .pptx
RaedMohamed3
 
CACJapan - GROUP Presentation 1- Wk 4.pdf
CACJapan - GROUP Presentation 1- Wk 4.pdfCACJapan - GROUP Presentation 1- Wk 4.pdf
CACJapan - GROUP Presentation 1- Wk 4.pdf
camakaiclarkmusic
 
Additional Benefits for Employee Website.pdf
Additional Benefits for Employee Website.pdfAdditional Benefits for Employee Website.pdf
Additional Benefits for Employee Website.pdf
joachimlavalley1
 
Honest Reviews of Tim Han LMA Course Program.pptx
Honest Reviews of Tim Han LMA Course Program.pptxHonest Reviews of Tim Han LMA Course Program.pptx
Honest Reviews of Tim Han LMA Course Program.pptx
timhan337
 
Acetabularia Information For Class 9 .docx
Acetabularia Information For Class 9  .docxAcetabularia Information For Class 9  .docx
Acetabularia Information For Class 9 .docx
vaibhavrinwa19
 
Overview on Edible Vaccine: Pros & Cons with Mechanism
Overview on Edible Vaccine: Pros & Cons with MechanismOverview on Edible Vaccine: Pros & Cons with Mechanism
Overview on Edible Vaccine: Pros & Cons with Mechanism
DeeptiGupta154
 
June 3, 2024 Anti-Semitism Letter Sent to MIT President Kornbluth and MIT Cor...
June 3, 2024 Anti-Semitism Letter Sent to MIT President Kornbluth and MIT Cor...June 3, 2024 Anti-Semitism Letter Sent to MIT President Kornbluth and MIT Cor...
June 3, 2024 Anti-Semitism Letter Sent to MIT President Kornbluth and MIT Cor...
Levi Shapiro
 
Operation Blue Star - Saka Neela Tara
Operation Blue Star   -  Saka Neela TaraOperation Blue Star   -  Saka Neela Tara
Operation Blue Star - Saka Neela Tara
Balvir Singh
 
Adversarial Attention Modeling for Multi-dimensional Emotion Regression.pdf
Adversarial Attention Modeling for Multi-dimensional Emotion Regression.pdfAdversarial Attention Modeling for Multi-dimensional Emotion Regression.pdf
Adversarial Attention Modeling for Multi-dimensional Emotion Regression.pdf
Po-Chuan Chen
 
Embracing GenAI - A Strategic Imperative
Embracing GenAI - A Strategic ImperativeEmbracing GenAI - A Strategic Imperative
Embracing GenAI - A Strategic Imperative
Peter Windle
 
Introduction to AI for Nonprofits with Tapp Network
Introduction to AI for Nonprofits with Tapp NetworkIntroduction to AI for Nonprofits with Tapp Network
Introduction to AI for Nonprofits with Tapp Network
TechSoup
 
Mule 4.6 & Java 17 Upgrade | MuleSoft Mysore Meetup #46
Mule 4.6 & Java 17 Upgrade | MuleSoft Mysore Meetup #46Mule 4.6 & Java 17 Upgrade | MuleSoft Mysore Meetup #46
Mule 4.6 & Java 17 Upgrade | MuleSoft Mysore Meetup #46
MysoreMuleSoftMeetup
 
1.4 modern child centered education - mahatma gandhi-2.pptx
1.4 modern child centered education - mahatma gandhi-2.pptx1.4 modern child centered education - mahatma gandhi-2.pptx
1.4 modern child centered education - mahatma gandhi-2.pptx
JosvitaDsouza2
 
A Strategic Approach: GenAI in Education
A Strategic Approach: GenAI in EducationA Strategic Approach: GenAI in Education
A Strategic Approach: GenAI in Education
Peter Windle
 
The French Revolution Class 9 Study Material pdf free download
The French Revolution Class 9 Study Material pdf free downloadThe French Revolution Class 9 Study Material pdf free download
The French Revolution Class 9 Study Material pdf free download
Vivekanand Anglo Vedic Academy
 

Recently uploaded (20)

Polish students' mobility in the Czech Republic
Polish students' mobility in the Czech RepublicPolish students' mobility in the Czech Republic
Polish students' mobility in the Czech Republic
 
Instructions for Submissions thorugh G- Classroom.pptx
Instructions for Submissions thorugh G- Classroom.pptxInstructions for Submissions thorugh G- Classroom.pptx
Instructions for Submissions thorugh G- Classroom.pptx
 
The Roman Empire A Historical Colossus.pdf
The Roman Empire A Historical Colossus.pdfThe Roman Empire A Historical Colossus.pdf
The Roman Empire A Historical Colossus.pdf
 
Synthetic Fiber Construction in lab .pptx
Synthetic Fiber Construction in lab .pptxSynthetic Fiber Construction in lab .pptx
Synthetic Fiber Construction in lab .pptx
 
The basics of sentences session 5pptx.pptx
The basics of sentences session 5pptx.pptxThe basics of sentences session 5pptx.pptx
The basics of sentences session 5pptx.pptx
 
Palestine last event orientationfvgnh .pptx
Palestine last event orientationfvgnh .pptxPalestine last event orientationfvgnh .pptx
Palestine last event orientationfvgnh .pptx
 
CACJapan - GROUP Presentation 1- Wk 4.pdf
CACJapan - GROUP Presentation 1- Wk 4.pdfCACJapan - GROUP Presentation 1- Wk 4.pdf
CACJapan - GROUP Presentation 1- Wk 4.pdf
 
Additional Benefits for Employee Website.pdf
Additional Benefits for Employee Website.pdfAdditional Benefits for Employee Website.pdf
Additional Benefits for Employee Website.pdf
 
Honest Reviews of Tim Han LMA Course Program.pptx
Honest Reviews of Tim Han LMA Course Program.pptxHonest Reviews of Tim Han LMA Course Program.pptx
Honest Reviews of Tim Han LMA Course Program.pptx
 
Acetabularia Information For Class 9 .docx
Acetabularia Information For Class 9  .docxAcetabularia Information For Class 9  .docx
Acetabularia Information For Class 9 .docx
 
Overview on Edible Vaccine: Pros & Cons with Mechanism
Overview on Edible Vaccine: Pros & Cons with MechanismOverview on Edible Vaccine: Pros & Cons with Mechanism
Overview on Edible Vaccine: Pros & Cons with Mechanism
 
June 3, 2024 Anti-Semitism Letter Sent to MIT President Kornbluth and MIT Cor...
June 3, 2024 Anti-Semitism Letter Sent to MIT President Kornbluth and MIT Cor...June 3, 2024 Anti-Semitism Letter Sent to MIT President Kornbluth and MIT Cor...
June 3, 2024 Anti-Semitism Letter Sent to MIT President Kornbluth and MIT Cor...
 
Operation Blue Star - Saka Neela Tara
Operation Blue Star   -  Saka Neela TaraOperation Blue Star   -  Saka Neela Tara
Operation Blue Star - Saka Neela Tara
 
Adversarial Attention Modeling for Multi-dimensional Emotion Regression.pdf
Adversarial Attention Modeling for Multi-dimensional Emotion Regression.pdfAdversarial Attention Modeling for Multi-dimensional Emotion Regression.pdf
Adversarial Attention Modeling for Multi-dimensional Emotion Regression.pdf
 
Embracing GenAI - A Strategic Imperative
Embracing GenAI - A Strategic ImperativeEmbracing GenAI - A Strategic Imperative
Embracing GenAI - A Strategic Imperative
 
Introduction to AI for Nonprofits with Tapp Network
Introduction to AI for Nonprofits with Tapp NetworkIntroduction to AI for Nonprofits with Tapp Network
Introduction to AI for Nonprofits with Tapp Network
 
Mule 4.6 & Java 17 Upgrade | MuleSoft Mysore Meetup #46
Mule 4.6 & Java 17 Upgrade | MuleSoft Mysore Meetup #46Mule 4.6 & Java 17 Upgrade | MuleSoft Mysore Meetup #46
Mule 4.6 & Java 17 Upgrade | MuleSoft Mysore Meetup #46
 
1.4 modern child centered education - mahatma gandhi-2.pptx
1.4 modern child centered education - mahatma gandhi-2.pptx1.4 modern child centered education - mahatma gandhi-2.pptx
1.4 modern child centered education - mahatma gandhi-2.pptx
 
A Strategic Approach: GenAI in Education
A Strategic Approach: GenAI in EducationA Strategic Approach: GenAI in Education
A Strategic Approach: GenAI in Education
 
The French Revolution Class 9 Study Material pdf free download
The French Revolution Class 9 Study Material pdf free downloadThe French Revolution Class 9 Study Material pdf free download
The French Revolution Class 9 Study Material pdf free download
 

UV Spectroscopy

  • 2. UV Spectroscopy I. Introduction A. UV radiation and Electronic Excitations 1. The difference in energy between molecular bonding, non-bonding and anti-bonding orbitals ranges from 125-650 kJ/mole. 2. This energy corresponds to EM radiation in the ultraviolet (UV) region, 200-400 nm, and visible (VIS) regions 400-800 nm of the spectrum. 3. For comparison, recall the EM spectrum: 4. Using IR we observed vibrational transitions with energies of 8-40 kJ/mol at wavelengths of 2500-15,000 nm. 5. For purposes of our discussion, we will refer to UV and VIS spectroscopy as UV. UV X-rays IR g-rays Radio Microwave Visible
  • 3.
  • 4. UV Spectroscopy I. Introduction B. The Spectroscopic Process 1. In UV spectroscopy, the sample is irradiated with the broad spectrum of the UV radiation 2. If a particular electronic transition matches the energy of a certain band of UV, it will be absorbed 3. The remaining UV light passes through the sample and is observed 4. From this residual radiation a spectrum is obtained with “gaps” at these discrete energies – this is called an absorption spectrum p p* p p*
  • 5. UV Spectroscopy I. Introduction C. Observed electronic transitions 1. The lowest energy transition (and most often obs. by UV) is typically that of an electron in the Highest Occupied Molecular Orbital (HOMO) to the Lowest Unoccupied Molecular Orbital (LUMO) 2. For any bond (pair of electrons) in a molecule, the molecular orbitals are a mixture of the two contributing atomic orbitals; for every bonding orbital “created” from this mixing (s, p), there is a corresponding anti- bonding orbital of symmetrically higher energy (s*, p*) 3. The lowest energy occupied orbitals are typically the s; likewise, the corresponding anti-bonding s* orbital is of the highest energy 4. p-orbitals are of somewhat higher energy, and their complementary anti- bonding orbital somewhat lower in energy than s*. 5. Unshared pairs lie at the energy of the original atomic orbital, most often this energy is higher than p or s (since no bond is formed, there is no benefit in energy)
  • 6. UV Spectroscopy I. Introduction C. Observed electronic transitions 6. Here is a graphical representation Energy s* p s p* n Atomic orbital Atomic orbital Molecular orbitals Occupied levels Unoccupied levels
  • 7. UV Spectroscopy I. Introduction C. Observed electronic transitions 7. From the molecular orbital diagram, there are several possible electronic transitions that can occur, each of a different relative energy: Energy s* p s p* n s s p n n s* p* p* s* p* alkanes carbonyls unsaturated cmpds. O, N, S, halogens carbonyls
  • 8. UV Spectroscopy I. Introduction C. Observed electronic transitions 8. Although the UV spectrum extends below 100 nm (high energy), oxygen in the atmosphere is not transparent below 200 nm 9. Special equipment to study vacuum or far UV is required 10. Routine organic UV spectra are typically collected from 200-700 nm 11. This limits the transitions that can be observed: s s p n n s* p* p* s* p* alkanes carbonyls unsaturated cmpds. O, N, S, halogens carbonyls 150 nm 170 nm 180 nm √ - if conjugated! 190 nm 300 nm √
  • 9. UV Spectroscopy I. Introduction D. Selection Rules 1. Not all transitions that are possible are observed 2. For an electron to transition, certain quantum mechanical constraints apply – these are called “selection rules” 3. For example, an electron cannot change its spin quantum number during a transition – these are “forbidden” Other examples include: • the number of electrons that can be excited at one time • symmetry properties of the molecule • symmetry of the electronic states 4. To further complicate matters, “forbidden” transitions are sometimes observed (albeit at low intensity) due to other factors
  • 10. UV Spectroscopy I. Introduction E. Band Structure 1. Unlike IR (or later NMR), where there may be upwards of 5 or more resolvable peaks from which to elucidate structural information, UV tends to give wide, overlapping bands 2. It would seem that since the electronic energy levels of a pure sample of molecules would be quantized, fine, discrete bands would be observed – for atomic spectra, this is the case 3. In molecules, when a bulk sample of molecules is observed, not all bonds (read – pairs of electrons) are in the same vibrational or rotational energy states 4. This effect will impact the wavelength at which a transition is observed – very similar to the effect of H-bonding on the O-H vibrational energy levels in neat samples
  • 11. UV Spectroscopy I. Introduction E. Band Structure 5. When these energy levels are superimposed, the effect can be readily explained – any transition has the possibility of being observed Energy Vo V4 V3 V2 V1 Disassociation R1 - Rn R1 - Rn R1 - Rn R1 - Rn R1 - Rn E0 E1 Vo V4 V3 V2 V1 Disassociation R1 - Rn R1 - Rn R1 - Rn R1 - Rn R1 - Rn
  • 12. UV Spectroscopy II. Instrumentation and Spectra A. Instrumentation 1. The construction of a traditional UV-VIS spectrometer is very similar to an IR, as similar functions – sample handling, irradiation, detection and output are required 2. Here is a simple schematic that covers most modern UV spectrometers: sample reference detector I0 I0 I0 I log(I0/I) = A 200 700 l, nm monochromator/ beam splitter optics UV-VIS sources
  • 13. UV Spectroscopy II. Instrumentation and Spectra A. Instrumentation 3. Two sources are required to scan the entire UV-VIS band: • Deuterium lamp – covers the UV – 200-330 • Tungsten lamp – covers 330-700 4. As with the dispersive IR, the lamps illuminate the entire band of UV or visible light; the monochromator (grating or prism) gradually changes the small bands of radiation sent to the beam splitter 5. The beam splitter sends a separate band to a cell containing the sample solution and a reference solution 6. The detector measures the difference between the transmitted light through the sample (I) vs. the incident light (I0) and sends this information to the recorder
  • 14. UV Spectroscopy II. Instrumentation and Spectra A. Instrumentation 7. As with dispersive IR, time is required to cover the entire UV-VIS band due to the mechanism of changing wavelengths 8. A recent improvement is the diode-array spectrophotometer - here a prism (dispersion device) breaks apart the full spectrum transmitted through the sample 9. Each individual band of UV is detected by a individual diodes on a silicon wafer simultaneously – the obvious limitation is the size of the diode, so some loss of resolution over traditional instruments is observed sample Polychromator – entrance slit and dispersion device UV-VIS sources Diode array
  • 15. UV Spectroscopy II. Instrumentation and Spectra B. Instrumentation – Sample Handling 1. Virtually all UV spectra are recorded solution-phase 2. Cells can be made of plastic, glass or quartz 3. Only quartz is transparent in the full 200-700 nm range; plastic and glass are only suitable for visible spectra 4. Concentration (we will cover shortly) is empirically determined A typical sample cell (commonly called a cuvet):
  • 16. UV Spectroscopy II. Instrumentation and Spectra B. Instrumentation – Sample Handling 5. Solvents must be transparent in the region to be observed; the wavelength where a solvent is no longer transparent is referred to as the cutoff 6. Since spectra are only obtained up to 200 nm, solvents typically only need to lack conjugated p systems or carbonyls Common solvents and cutoffs: acetonitrile 190 chloroform 240 cyclohexane 195 1,4-dioxane 215 95% ethanol 205 n-hexane 201 methanol 205 isooctane 195 water 190
  • 17. UV Spectroscopy II. Instrumentation and Spectra B. Instrumentation – Sample Handling 7. Additionally solvents must preserve the fine structure (where it is actually observed in UV!) where possible 8. H-bonding further complicates the effect of vibrational and rotational energy levels on electronic transitions, dipole-dipole interacts less so 9. The more non-polar the solvent, the better (this is not always possible)
  • 18. UV Spectroscopy II. Instrumentation and Spectra C. The Spectrum 1. The x-axis of the spectrum is in wavelength; 200-350 nm for UV, 200-700 for UV-VIS determinations 2. Due to the lack of any fine structure, spectra are rarely shown in their raw form, rather, the peak maxima are simply reported as a numerical list of “lamba max” values or lmax lmax = 206 nm 252 317 376 O NH2 O
  • 19. UV Spectroscopy II. Instrumentation and Spectra C. The Spectrum 3. The y-axis of the spectrum is in absorbance, A 4. From the spectrometers point of view, absorbance is the inverse of transmittance: A = log10 (I0/I) 5. From an experimental point of view, three other considerations must be made: i. a longer path length, l through the sample will cause more UV light to be absorbed – linear effect ii. the greater the concentration, c of the sample, the more UV light will be absorbed – linear effect iii. some electronic transitions are more effective at the absorption of photon than others – molar absorptivity, e this may vary by orders of magnitude…
  • 20. UV Spectroscopy II. Instrumentation and Spectra C. The Spectrum 6. These effects are combined into the Beer-Lambert Law: A = e c l i. for most UV spectrometers, l would remain constant (standard cells are typically 1 cm in path length) ii. concentration is typically varied depending on the strength of absorption observed or expected – typically dilute – sub .001 M iii. molar absorptivities vary by orders of magnitude: • values of 104-106 are termed high intensity absorptions • values of 103-104 are termed low intensity absorptions • values of 0 to 103 are the absorptions of forbidden transitions A is unitless, so the units for e are cm-1 · M-1 and are rarely expressed 7. Since path length and concentration effects can be easily factored out, absorbance simply becomes proportional to e, and the y-axis is expressed as e directly or as the logarithm of e
  • 21. UV Spectroscopy II. Instrumentation and Spectra D. Practical application of UV spectroscopy 1. UV was the first organic spectral method, however, it is rarely used as a primary method for structure determination 2. It is most useful in combination with NMR and IR data to elucidate unique electronic features that may be ambiguous in those methods 3. It can be used to assay (via lmax and molar absorptivity) the proper irradiation wavelengths for photochemical experiments, or the design of UV resistant paints and coatings 4. The most ubiquitous use of UV is as a detection device for HPLC; since UV is utilized for solution phase samples vs. a reference solvent this is easily incorporated into LC design UV is to HPLC what mass spectrometry (MS) will be to GC
  • 22. UV Spectroscopy III. Chromophores A. Definition 1. Remember the electrons present in organic molecules are involved in covalent bonds or lone pairs of electrons on atoms such as O or N 2. Since similar functional groups will have electrons capable of discrete classes of transitions, the characteristic energy of these energies is more representative of the functional group than the electrons themselves 3. A functional group capable of having characteristic electronic transitions is called a chromophore (color loving) 4. Structural or electronic changes in the chromophore can be quantified and used to predict shifts in the observed electronic transitions
  • 23. UV Spectroscopy III. Chromophores B. Organic Chromophores 1. Alkanes – only posses s-bonds and no lone pairs of electrons, so only the high energy s  s* transition is observed in the far UV This transition is destructive to the molecule, causing cleavage of the s- bond s* s C C C C
  • 24. UV Spectroscopy III. Chromophores B. Organic Chromophores 2. Alcohols, ethers, amines and sulfur compounds – in the cases of simple, aliphatic examples of these compounds the n  s* is the most often observed transition; like the alkane s  s* it is most often at shorter l than 200 nm Note how this transition occurs from the HOMO to the LUMO s*CN sCN nN sp3 C N C N C N C N anitbonding orbital
  • 25. UV Spectroscopy III. Chromophores B. Organic Chromophores 3. Alkenes and Alkynes – in the case of isolated examples of these compounds the p  p* is observed at 175 and 170 nm, respectively Even though this transition is of lower energy than s  s*, it is still in the far UV – however, the transition energy is sensitive to substitution p* p
  • 26. UV Spectroscopy III. Chromophores B. Organic Chromophores 4. Carbonyls – unsaturated systems incorporating N or O can undergo n  p* transitions (~285 nm) in addition to p  p* Despite the fact this transition is forbidden by the selection rules (e = 15), it is the most often observed and studied transition for carbonyls This transition is also sensitive to substituents on the carbonyl Similar to alkenes and alkynes, non-substituted carbonyls undergo the p  p* transition in the vacuum UV (188 nm, e = 900); sensitive to substitution effects
  • 27. UV Spectroscopy III. Chromophores B. Organic Chromophores 4. Carbonyls – n  p* transitions (~285 nm); p  p* (188 nm) p p* n sCO transitions omitted for clarity O O C O It has been determined from spectral studies, that carbonyl oxygen more approximates sp rather than sp2 !
  • 28. UV Spectroscopy III. Chromophores C. Substituent Effects General – from our brief study of these general chromophores, only the weak n  p* transition occurs in the routinely observed UV The attachment of substituent groups (other than H) can shift the energy of the transition Substituents that increase the intensity and often wavelength of an absorption are called auxochromes Common auxochromes include alkyl, hydroxyl, alkoxy and amino groups and the halogens
  • 29. UV Spectroscopy III. Chromophores C. Substituent Effects General – Substituents may have any of four effects on a chromophore i. Bathochromic shift (red shift) – a shift to longer l; lower energy ii. Hypsochromic shift (blue shift) – shift to shorter l; higher energy iii. Hyperchromic effect – an increase in intensity iv. Hypochromic effect – a decrease in intensity 200 nm 700 nm e Hypochromic Hypsochromic Hyperchromic Bathochromic
  • 30. UV Spectroscopy III. Chromophores C. Substituent Effects 1. Conjugation – most efficient means of bringing about a bathochromic and hyperchromic shift of an unsaturated chromophore: H2C CH2 -carotene O O lmax nm e 175 15,000 217 21,000 258 35,000 n  p* 280 27 p  p* 213 7,100 465 125,000 n  p* 280 12 p  p* 189 900
  • 31. UV Spectroscopy III. Chromophores C. Substituent Effects 1. Conjugation – Alkenes The observed shifts from conjugation imply that an increase in conjugation decreases the energy required for electronic excitation From molecular orbital (MO) theory two atomic p orbitals, f1 and f2 from two sp2 hybrid carbons combine to form two MOs Y1 and Y2* in ethylene Y2* p Y1 f1 f2
  • 32. UV Spectroscopy III. Chromophores C. Substituent Effects 2. Conjugation – Alkenes When we consider butadiene, we are now mixing 4 p orbitals giving 4 MOs of an energetically symmetrical distribution compared to ethylene Y2* p Y1 Y1 Y2 Y3 * Y4 * DE for the HOMO  LUMO transition is reduced
  • 33. UV Spectroscopy III. Chromophores C. Substituent Effects 2. Conjugation – Alkenes Extending this effect out to longer conjugated systems the energy gap becomes progressively smaller: Energy ethylene butadiene hexatriene octatetraene Lower energy = Longer wavelenghts
  • 34. UV Spectroscopy III. Chromophores C. Substituent Effects 2. Conjugation – Alkenes Similarly, the lone pairs of electrons on N, O, S, X can extend conjugated systems – auxochromes Here we create 3 MOs – this interaction is not as strong as that of a conjugated p-system Y2 p Y1 A p* nA Y3 * Energy
  • 35. UV Spectroscopy III. Chromophores C. Substituent Effects 2. Conjugation – Alkenes Methyl groups also cause a bathochromic shift, even though they are devoid of p- or n-electrons This effect is thought to be through what is termed “hyperconjugation” or sigma bond resonance C C C H H H
  • 36. UV Spectroscopy Next time – We will find that the effect of substituent groups can be reliably quantified from empirical observation of known conjugated structures and applied to new systems This quantification is referred to as the Woodward-Fieser Rules which we will apply to three specific chromophores: 1. Conjugated dienes 2. Conjugated dienones 3. Aromatic systems lmax = 239 nm
  • 37. UV Spectroscopy IV. Structure Determination A. Dienes 1. General Features For acyclic butadiene, two conformers are possible – s-cis and s-trans The s-cis conformer is at an overall higher potential energy than the s- trans; therefore the HOMO electrons of the conjugated system have less of a jump to the LUMO – lower energy, longer wavelength s-trans s-cis
  • 38. UV Spectroscopy IV. Structure Determination A. Dienes 1. General Features Two possible p  p* transitions can occur for butadiene Y2  Y3 * and Y2  Y4 * The Y2  Y4 * transition is not typically observed: • The energy of this transition places it outside the region typically observed – 175 nm • For the more favorable s-trans conformation, this transition is forbidden The Y2  Y3 * transition is observed as an intense absorption s-trans s-cis 175 nm –forb. 217 nm 253 nm 175 nm Y4 * Y2 Y1 Y3 *
  • 39. UV Spectroscopy IV. Structure Determination A. Dienes 1. General Features The Y2  Y3 * transition is observed as an intense absorption (e = 20,000+) based at 217 nm within the observed region of the UV While this band is insensitive to solvent (as would be expected) it is subject to the bathochromic and hyperchromic effects of alkyl substituents as well as further conjugation Consider: lmax = 217 253 220 227 227 256 263 nm
  • 40. UV Spectroscopy IV. Structure Determination A. Dienes 2. Woodward-Fieser Rules Woodward and the Fiesers performed extensive studies of terpene and steroidal alkenes and noted similar substituents and structural features would predictably lead to an empirical prediction of the wavelength for the lowest energy p  p* electronic transition This work was distilled by Scott in 1964 into an extensive treatise on the Woodward-Fieser rules in combination with comprehensive tables and examples – (A.I. Scott, Interpretation of the Ultraviolet Spectra of Natural Products, Pergamon, NY, 1964) A more modern interpretation was compiled by Rao in 1975 – (C.N.R. Rao, Ultraviolet and Visible Spectroscopy, 3rd Ed., Butterworths, London, 1975)
  • 41. UV Spectroscopy IV. Structure Determination A. Dienes 2. Woodward-Fieser Rules - Dienes The rules begin with a base value for lmax of the chromophore being observed: acyclic butadiene = 217 nm The incremental contribution of substituents is added to this base value from the group tables: Group Increment Extended conjugation +30 Each exo-cyclic C=C +5 Alkyl +5 -OCOCH3 +0 -OR +6 -SR +30 -Cl, -Br +5 -NR2 +60
  • 42. UV Spectroscopy IV. Structure Determination A. Dienes 2. Woodward-Fieser Rules - Dienes For example: Isoprene - acyclic butadiene = 217 nm one alkyl subs. + 5 nm 222 nm Experimental value 220 nm Allylidenecyclohexane - acyclic butadiene = 217 nm one exocyclic C=C + 5 nm 2 alkyl subs. +10 nm 232 nm Experimental value 237 nm
  • 43. UV Spectroscopy IV. Structure Determination A. Dienes 3. Woodward-Fieser Rules – Cyclic Dienes There are two major types of cyclic dienes, with two different base values Heteroannular (transoid): Homoannular (cisoid): e = 5,000 – 15,000 e = 12,000-28,000 base lmax = 214 base lmax = 253 The increment table is the same as for acyclic butadienes with a couple additions: Group Increment Additional homoannular +39 Where both types of diene are present, the one with the longer l becomes the base
  • 44. UV Spectroscopy IV. Structure Determination A. Dienes 3. Woodward-Fieser Rules – Cyclic Dienes In the pre-NMR era of organic spectral determination, the power of the method for discerning isomers is readily apparent Consider abietic vs. levopimaric acid: C O OH C O OH levopimaric acid abietic acid
  • 45. UV Spectroscopy IV. Structure Determination A. Dienes 3. Woodward-Fieser Rules – Cyclic Dienes For example: 1,2,3,7,8,8a-hexahydro-8a-methylnaphthalene heteroannular diene = 214 nm 3 alkyl subs. (3 x 5) +15 nm 1 exo C=C + 5 nm 234 nm Experimental value 235 nm
  • 46. UV Spectroscopy IV. Structure Determination A. Dienes 3. Woodward-Fieser Rules – Cyclic Dienes C O OH heteroannular diene = 214 nm 4 alkyl subs. (4 x 5) +20 nm 1 exo C=C + 5 nm 239 nm homoannular diene = 253 nm 4 alkyl subs. (4 x 5) +20 nm 1 exo C=C + 5 nm 278 nm C O OH
  • 47. UV Spectroscopy IV. Structure Determination A. Dienes 3. Woodward-Fieser Rules – Cyclic Dienes Be careful with your assignments – three common errors: R This compound has three exocyclic double bonds; the indicated bond is exocyclic to two rings This is not a heteroannular diene; you would use the base value for an acyclic diene Likewise, this is not a homooannular diene; you would use the base value for an acyclic diene
  • 48. UV Spectroscopy IV. Structure Determination B. Enones 1. General Features Carbonyls, as we have discussed have two primary electronic transitions: p p* n Remember, the p  p* transition is allowed and gives a high e, but lies outside the routine range of UV observation The n  p* transition is forbidden and gives a very low e, but can routinely be observed
  • 49. UV Spectroscopy IV. Structure Determination B. Enones 1. General Features For auxochromic substitution on the carbonyl, pronounced hypsochromic shifts are observed for the n  p* transition (lmax): This is explained by the inductive withdrawal of electrons by O, N or halogen from the carbonyl carbon – this causes the n-electrons on the carbonyl oxygen to be held more firmly It is important to note this is different from the auxochromic effect on p  p* which extends conjugation and causes a bathochromic shift In most cases, this bathochromic shift is not enough to bring the p  p* transition into the observed range H O CH3 O Cl O NH2 O O O OH O 293 nm 279 235 214 204 204
  • 50. UV Spectroscopy IV. Structure Determination B. Enones 1. General Features Conversely, if the C=O system is conjugated both the n  p* and p  p* bands are bathochromically shifted Here, several effects must be noted: i. the effect is more pronounced for p  p* ii. if the conjugated chain is long enough, the much higher intensity p  p* band will overlap and drown out the n  p* band iii. the shift of the n  p* transition is not as predictable For these reasons, empirical Woodward-Fieser rules for conjugated enones are for the higher intensity, allowed p  p* transition
  • 51. UV Spectroscopy IV. Structure Determination B. Enones 1. General Features These effects are apparent from the MO diagram for a conjugated enone: p Y1 Y2 Y3 * Y4 * p* n p p* n O O
  • 52. UV Spectroscopy IV. Structure Determination B. Enones 2. Woodward-Fieser Rules - Enones Group Increment 6-membered ring or acyclic enone Base 215 nm 5-membered ring parent enone Base 202 nm Acyclic dienone Base 245 nm Double bond extending conjugation 30 Alkyl group or ring residue a, , g and higher 10, 12, 18 -OH a, , g and higher 35, 30, 18 -OR a, , g, d 35, 30, 17, 31 -O(C=O)R a, , d 6 -Cl a,  15, 12 -Br a,  25, 30 -NR2  95 Exocyclic double bond 5 Homocyclic diene component 39 C C C   a C C C C  a C g d d O O
  • 53. UV Spectroscopy IV. Structure Determination B. Enones 2. Woodward-Fieser Rules - Enones Aldehydes, esters and carboxylic acids have different base values than ketones Unsaturated system Base Value Aldehyde 208 With a or  alkyl groups 220 With a, or , alkyl groups 230 With a,, alkyl groups 242 Acid or ester With a or  alkyl groups 208 With a, or , alkyl groups 217 Group value – exocyclic a, double bond +5 Group value – endocyclic a, bond in 5 or 7 membered ring +5
  • 54. UV Spectroscopy IV. Structure Determination B. Enones 2. Woodward-Fieser Rules - Enones Unlike conjugated alkenes, solvent does have an effect on lmax These effects are also described by the Woodward-Fieser rules Solvent correction Increment Water +8 Ethanol, methanol 0 Chloroform -1 Dioxane -5 Ether -7 Hydrocarbon -11
  • 55. UV Spectroscopy IV. Structure Determination B. Enones 2. Woodward-Fieser Rules - Enones Some examples – keep in mind these are more complex than dienes cyclic enone = 215 nm 2 x - alkyl subs.(2 x 12) +24 nm 239 nm Experimental value 238 nm cyclic enone = 215 nm extended conj. +30 nm b-ring residue +12 nm d-ring residue +18 nm exocyclic double bond + 5 nm 280 nm Experimental 280 nm O R O
  • 56. UV Spectroscopy IV. Structure Determination B. Enones 2. Woodward-Fieser Rules - Enones Take home problem – can these two isomers be discerned by UV-spec O O Eremophilone allo-Eremophilone Problem Set 1: (text) – 1,2,3a,b,c,d,e,f,j, 4, 5, 6 (1st, 2nd and 5th pairs), 8a, b, c Problem Set 2: outside problems/key -Tuesday
  • 57. UV Spectroscopy IV. Structure Determination C. Aromatic Compounds 1. General Features Although aromatic rings are among the most widely studied and observed chromophores, the absorptions that arise from the various electronic transitions are complex On first inspection, benzene has six p-MOs, 3 filled p, 3 unfilled p* p4* p5* p6* p2 p1 p3
  • 58. UV Spectroscopy IV. Structure Determination C. Aromatic Compounds 1. General Features One would expect there to be four possible HOMO-LUMO p  p* transitions at observable wavelengths (conjugation) Due to symmetry concerns and selection rules, the actual transition energy states of benzene are illustrated at the right: p4* p5* p6* p2 p1 p3 A1g B2u B1u E1u 260 nm (forbidden) 200 nm (forbidden) 180 nm (allowed)
  • 59. UV Spectroscopy IV. Structure Determination C. Aromatic Compounds 1. General Features The allowed transition (e = 47,000) is not in the routine range of UV obs. at 180 nm, and is referred to as the primary band The forbidden transition (e = 7400) is observed if substituent effects shift it into the obs. region; this is referred to as the second primary band At 260 nm is another forbidden transition (e = 230), referred to as the secondary band. This transition is fleetingly allowed due to the disruption of symmetry by the vibrational energy states, the overlap of which is observed in what is called fine structure
  • 60. UV Spectroscopy IV. Structure Determination C. Aromatic Compounds 1. General Features Substitution, auxochromic, conjugation and solvent effects can cause shifts in wavelength and intensity of aromatic systems similar to dienes and enones However, these shifts are difficult to predict – the formulation of empirical rules is for the most part is not efficient (there are more exceptions than rules) There are some general qualitative observations that can be made by classifying substituent groups --
  • 61. UV Spectroscopy IV. Structure Determination C. Aromatic Compounds 2. Substituent Effects a. Substituents with Unshared Electrons • If the group attached to the ring bears n electrons, they can induce a shift in the primary and secondary absorption bands • Non-bonding electrons extend the p-system through resonance – lowering the energy of transition p  p* • More available n-pairs of electrons give greater shifts G G G G
  • 62. UV Spectroscopy IV. Structure Determination C. Aromatic Compounds 2. Substituent Effects a. Substituents with Unshared Electrons • The presence of n-electrons gives the possibility of n  p* transitions • If this occurs, the electron now removed from G, becomes an extra electron in the anti-bonding p* orbital of the ring • This state is referred to as a charge-transfer excited state G G G G * - * * *
  • 63. UV Spectroscopy IV. Structure Determination C. Aromatic Compounds 2. Substituent Effects a. Substituents with Unshared Electrons • pH can change the nature of the substituent group • deprotonation of oxygen gives more available n-pairs, lowering transition energy • protonation of nitrogen eliminates the n-pair, raising transition energy Primary Secondary Substituent lmax e lmax e -H 203.5 7,400 254 204 -OH 211 6,200 270 1,450 -O- 235 9,400 287 2,600 -NH2 230 8,600 280 1,430 -NH3 + 203 7,500 254 169 -C(O)OH 230 11,600 273 970 -C(O)O- 224 8,700 268 560
  • 64. UV Spectroscopy IV. Structure Determination C. Aromatic Compounds 2. Substituent Effects b. Substituents Capable of p-conjugation • When the substituent is a p-chromophore, it can interact with the benzene p-system • With benzoic acids, this causes an appreciable shift in the primary and secondary bands • For the benzoate ion, the effect of extra n-electrons from the anion reduces the effect slightly Primary Secondary Substituent lmax e lmax e -C(O)OH 230 11,600 273 970 -C(O)O- 224 8,700 268 560
  • 65. UV Spectroscopy IV. Structure Determination C. Aromatic Compounds 2. Substituent Effects c. Electron-donating and electron-withdrawing effects • No matter what electronic influence a group exerts, the presence shifts the primary absorption band to longer l • Electron-withdrawing groups exert no influence on the position of the secondary absorption band • Electron-donating groups increase the l and e of the secondary absorption band
  • 66. UV Spectroscopy IV. Structure Determination C. Aromatic Compounds 2. Substituent Effects c. Electron-donating and electron-withdrawing effects Primary Secondary Substituent lmax e lmax e -H 203.5 7,400 254 204 -CH3 207 7,000 261 225 -Cl 210 7,400 264 190 -Br 210 7,900 261 192 -OH 211 6,200 270 1,450 -OCH3 217 6,400 269 1,480 -NH2 230 8,600 280 1,430 -CN 224 13,000 271 1,000 C(O)OH 230 11,600 273 970 -C(O)H 250 11,400 -C(O)CH3 224 9,800 -NO2 269 7,800 Electron donating Electron withdrawing
  • 67. UV Spectroscopy IV. Structure Determination C. Aromatic Compounds 2. Substituent Effects d. Di-substituted and multiple group effects • With di-substituted aromatics, it is necessary to consider both groups • If both groups are electron donating or withdrawing, the effect is similar to the effect of the stronger of the two groups as if it were a mono-substituted ring • If one group is electron withdrawing and one group electron donating and they are para- to one another, the magnitude of the shift is greater than the sum of both the group effects • Consider p-nitroaniline: H2N N O O H2N N O O
  • 68. UV Spectroscopy IV. Structure Determination C. Aromatic Compounds 2. Substituent Effects d. Di-substituted and multiple group effects • If the two electonically dissimilar groups are ortho- or meta- to one another, the effect is usually the sum of the two individual effects (meta- no resonance; ortho-steric hind.) • For the case of substituted benzoyl derivatives, an empirical correlation of structure with observed lmax has been developed • This is slightly less accurate than the Woodward-Fieser rules, but can usually predict within an error of 5 nm R O G
  • 69. UV Spectroscopy IV. Structure Determination C. Aromatic Compounds 2. Substituent Effects d. Di-substituted and multiple group effects R O G Substituent increment G o m p Alkyl or ring residue 3 3 10 -O-Alkyl, -OH, -O-Ring 7 7 25 -O- 11 20 78 -Cl 0 0 10 -Br 2 2 15 -NH2 13 13 58 -NHC(O)CH3 20 20 45 -NHCH3 73 -N(CH3)2 20 20 85 Parent Chromophore lmax R = alkyl or ring residue 246 R = H 250 R = OH or O-Alkyl 230
  • 70. UV Spectroscopy IV. Structure Determination C. Aromatic Compounds 2. Substituent Effects d. Polynuclear aromatics • When the number of fused aromatic rings increases, the l for the primary and secondary bands also increase • For heteroaromatic systems spectra become complex with the addition of the n  p* transition and ring size effects and are unique to each case
  • 71. UV Spectroscopy V. Visible Spectroscopy A. Color 1. General • The portion of the EM spectrum from 400-800 is observable to humans- we (and some other mammals) have the adaptation of seeing color at the expense of greater detail 400 500 600 800 700 l, nm Violet 400-420 Indigo 420-440 Blue 440-490 Green 490-570 Yellow 570-585 Orange 585-620 Red 620-780
  • 72. UV Spectroscopy V. Visible Spectroscopy A. Color 1. General • When white (continuum of l) light passes through, or is reflected by a surface, those is that are absorbed are removed from the transmitted or reflected light respectively • What is “seen” is the complimentary colors (those that are not absorbed) • This is the origin of the “color wheel”
  • 73. UV Spectroscopy V. Visible Spectroscopy A. Color 1. General • Organic compounds that are “colored” are typically those with extensively conjugated systems (typically more than five) • Consider -carotene -carotene, lmax = 455 nm lmax is at 455 – in the far blue region of the spectrum – this is absorbed The remaining light has the complementary color of orange
  • 74. UV Spectroscopy V. Visible Spectroscopy A. Color 1. General • Likewise: lmax for lycopene is at 474 – in the near blue region of the spectrum – this is absorbed, the compliment is now red lmax for indigo is at 602 – in the orange region of the spectrum – this is absorbed, the compliment is now indigo! lycopene, lmax = 474 nm N H H N O O indigo
  • 75. UV Spectroscopy V. Visible Spectroscopy A. Color 1. General • One of the most common class of colored organic molecules are the azo dyes: From our discussion of di-subsituted aromatic chromophores, the effect of opposite groups is greater than the sum of the individual effects – more so on this heavily conjugated system Coincidentally, it is necessary for these to be opposite for the original synthetic preparation! N N EDGs EWGs
  • 76. OH N N NO2 Para Red N N NH2 H2N Fast Brown N N O3S HO SO3 Sunset Yellow (Food Yellow 3) UV Spectroscopy V. Visible Spectroscopy A. Color 1. General • These materials are some of the more familiar colors of our “environment”
  • 77. The colors of M&M’s Bright Blue Common Food Uses Beverages, dairy products, powders, jellies, confections, condiments, icing. Royal Blue Common Food Uses Baked goods, cereals, snack foods, ice-cream, confections, cherries. Orange-red Common Food Uses Gelatins, puddings, dairy products, confections, beverages, condiments. Lemon-yellow Common Food Uses Custards, beverages, ice-cream, confections, preserves, cereals. Orange Common Food Uses Cereals, baked goods, snack foods, ice-cream, beverages, dessert powders, confections
  • 78. N N O3S SO3 N N HO UV Spectroscopy V. Visible Spectroscopy A. Color 1. General • In the biological sciences these compounds are used as dyes to selectively stain different tissues or cell structures • Biebrich Scarlet - Used with picric acid/aniline blue for staining collagen, recticulum, muscle, and plasma. Luna's method for erythrocytes & eosinophil granules. Guard's method for sex chromatin and nuclear chromatin.
  • 79. N N O3S N CH3 CH3 N H N O3S N CH3 CH3 Yellow, pH > 4.4 Red, pH < 3.2 Methyl Orange UV Spectroscopy V. Visible Spectroscopy A. Color 1. General • In the chemical sciences these are the acid-base indicators used for the various pH ranges: • Remember the effects of pH on aromatic substituents
  • 80. Dr. Ashwani Dhingra Associate Professor GGSCOP, Yamunanagar Thank you