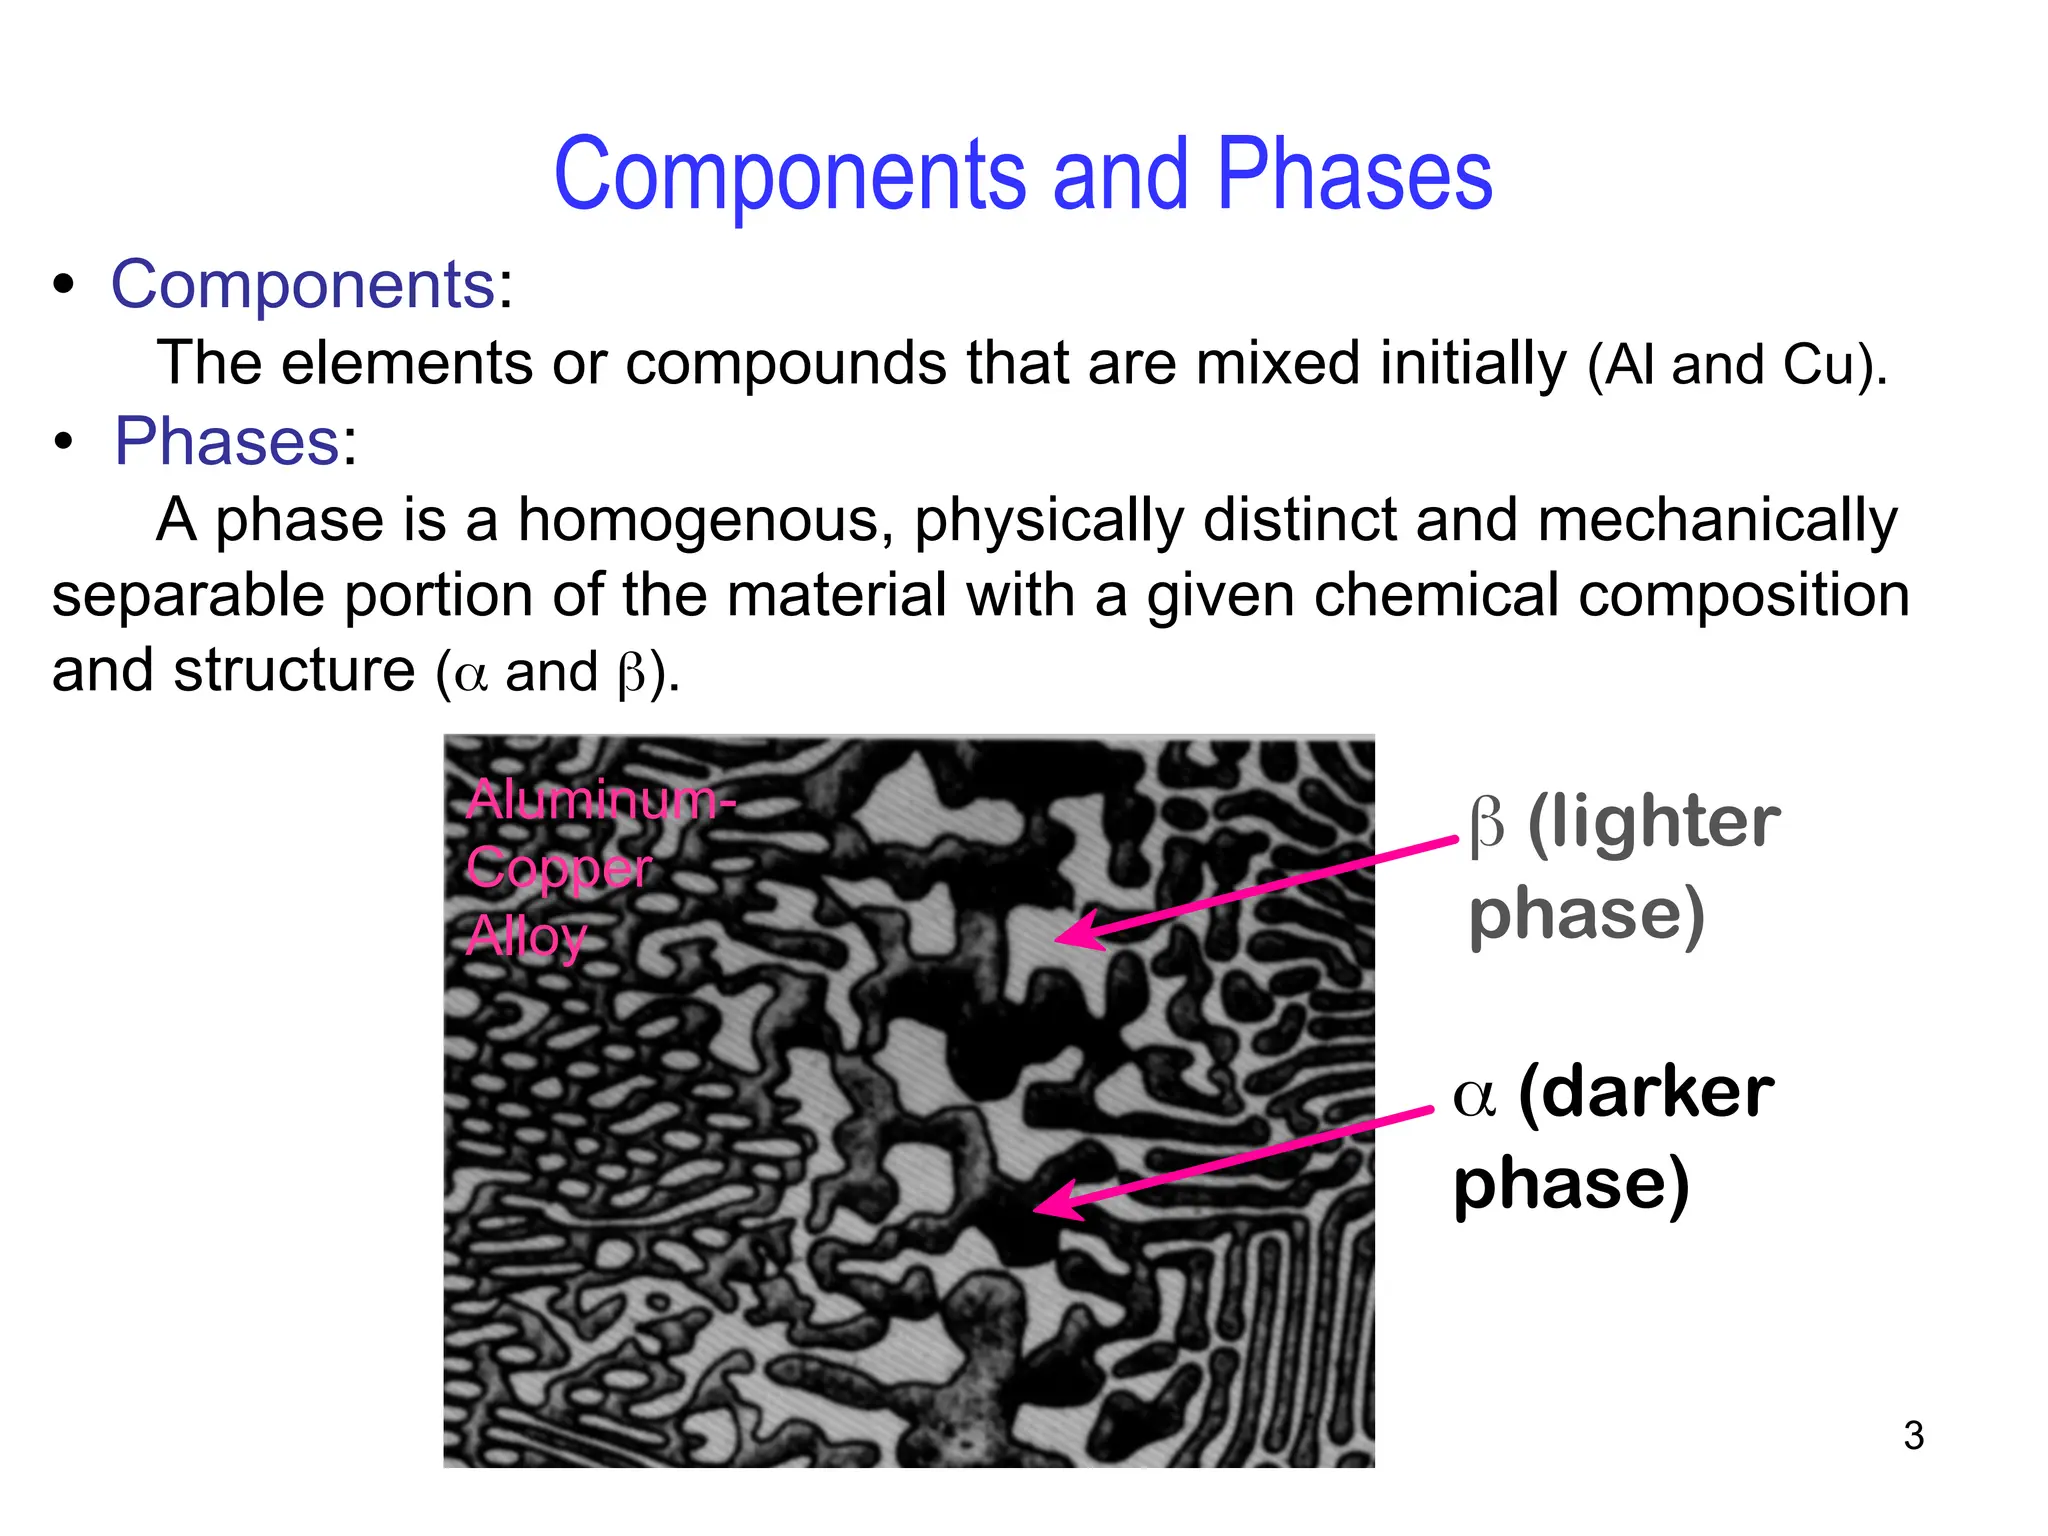
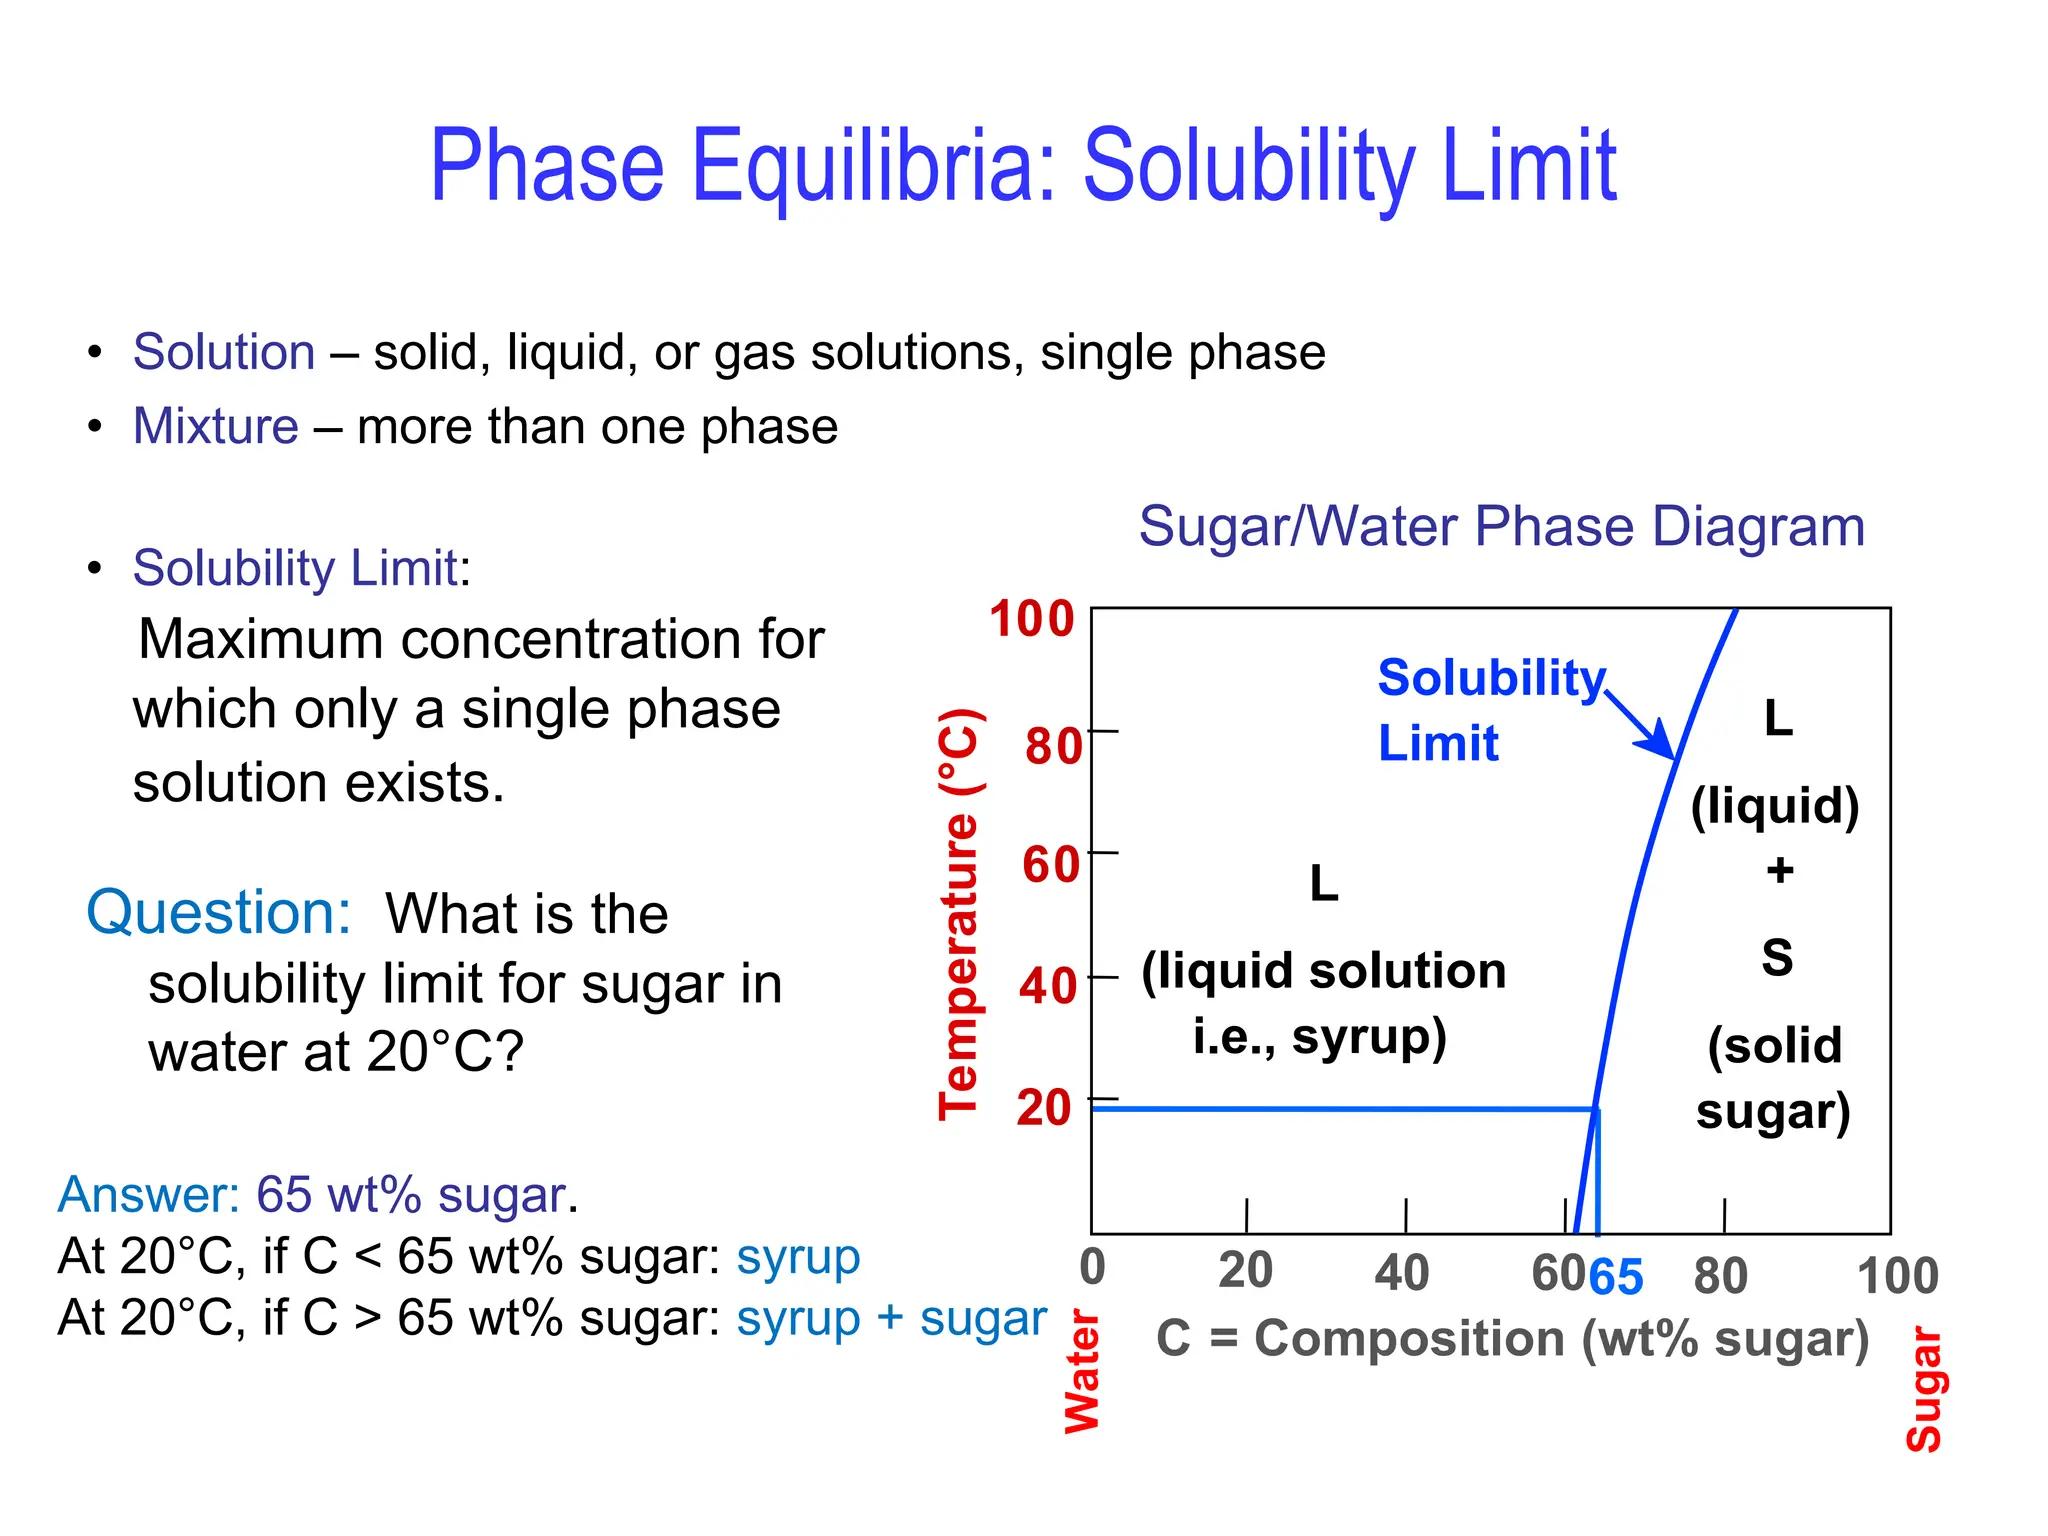
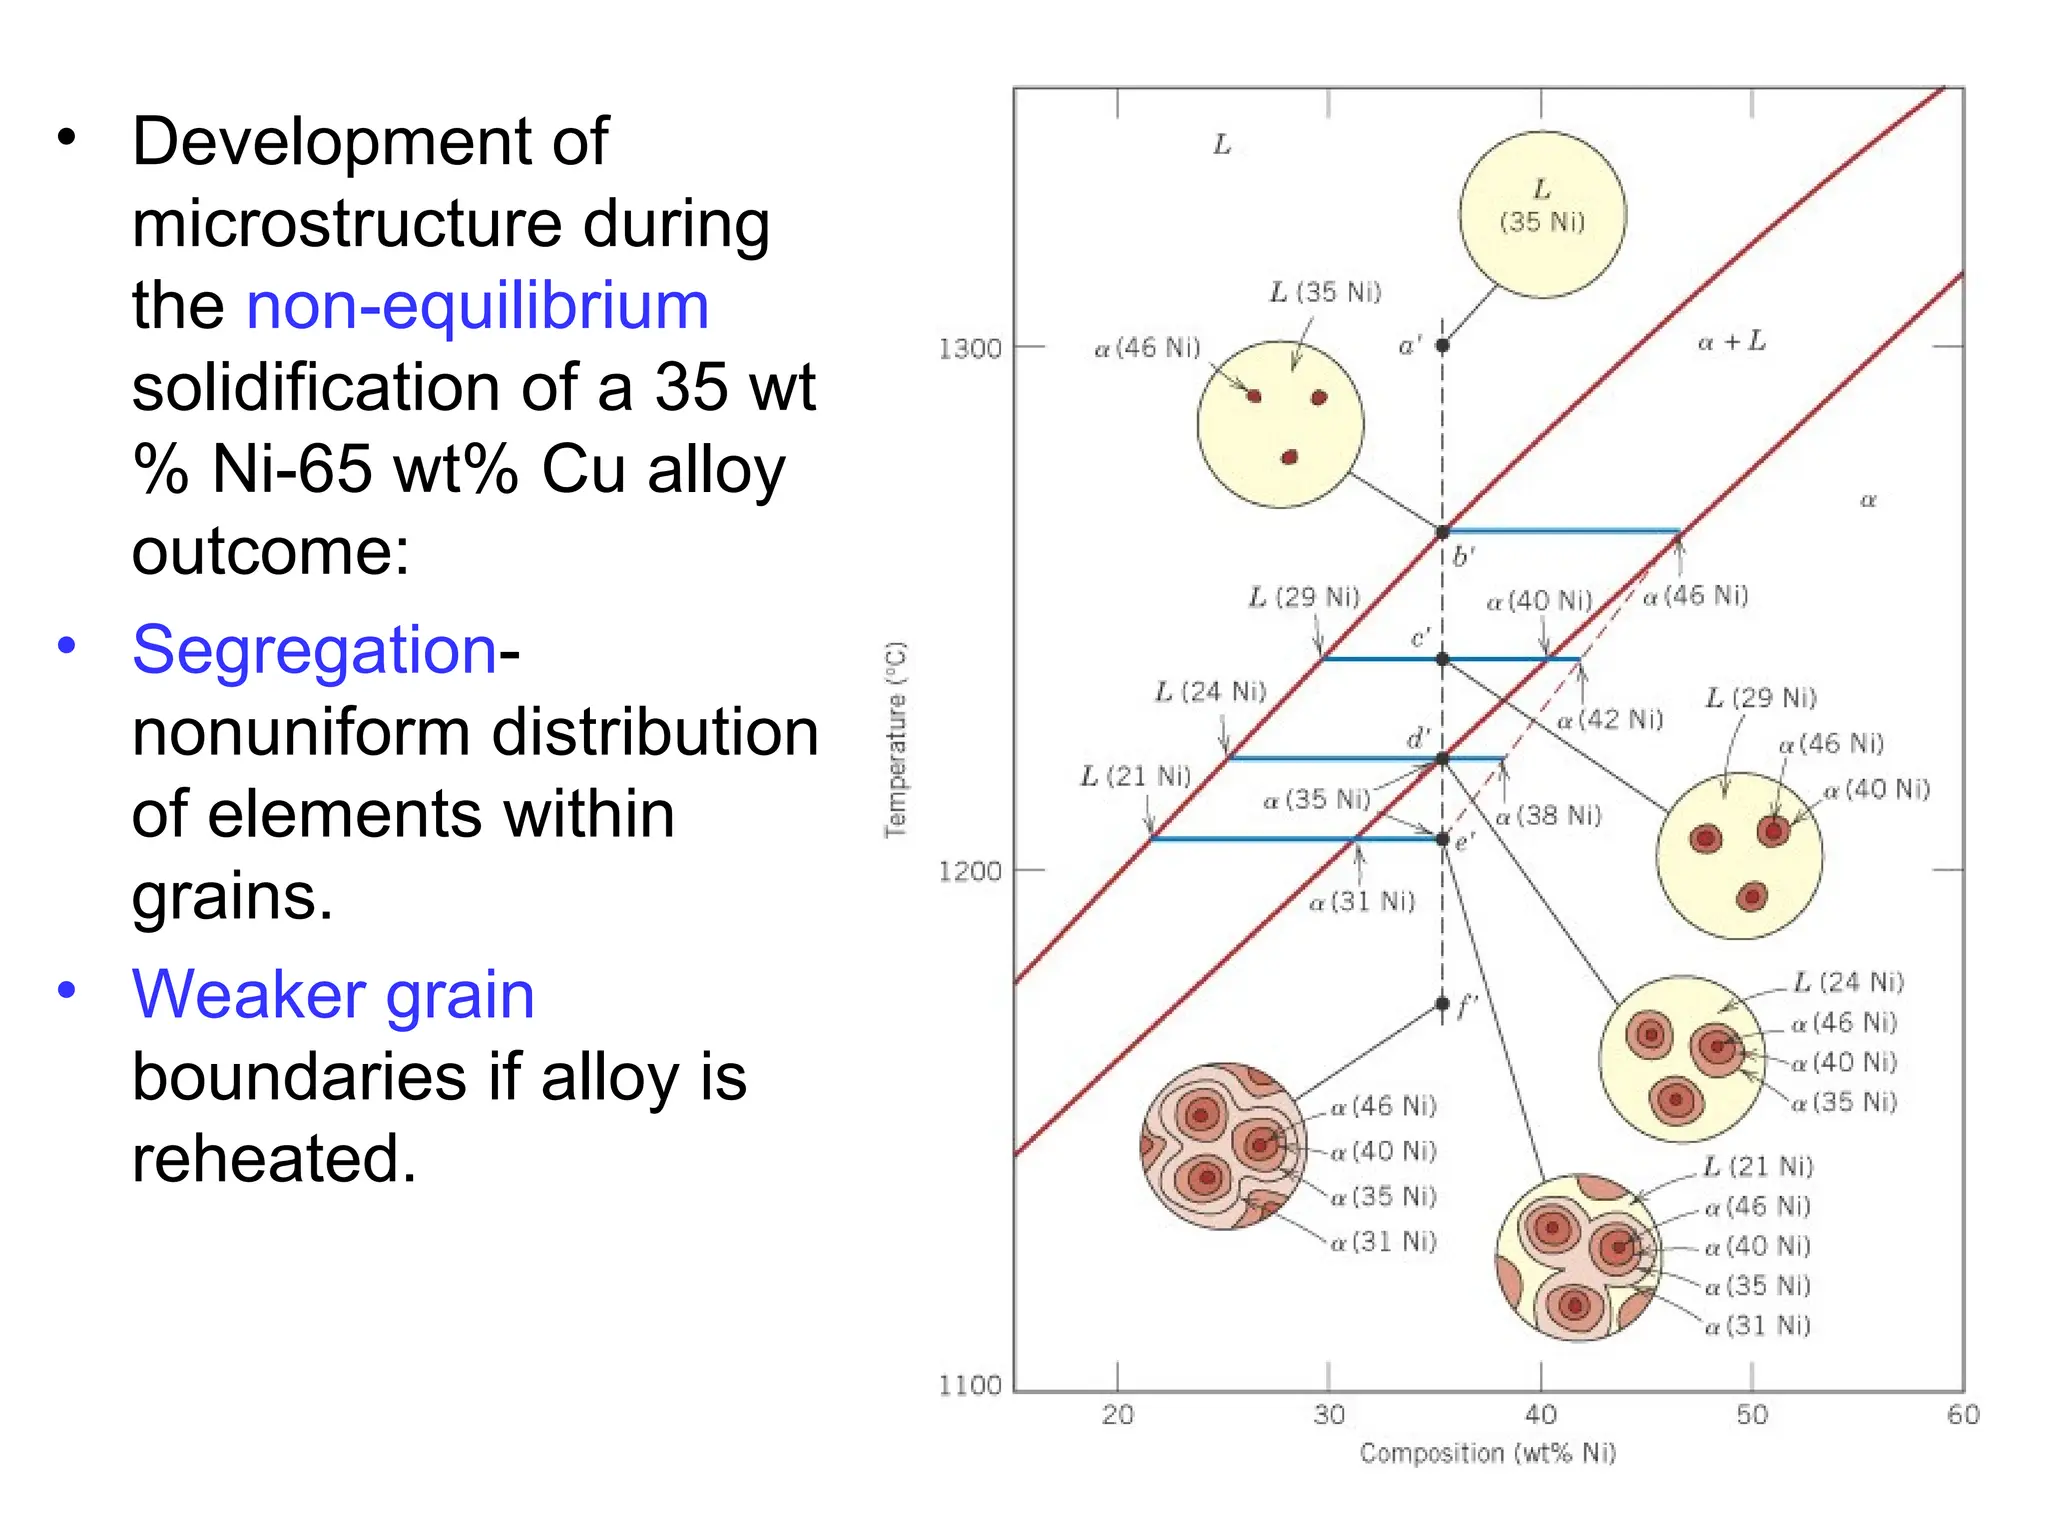
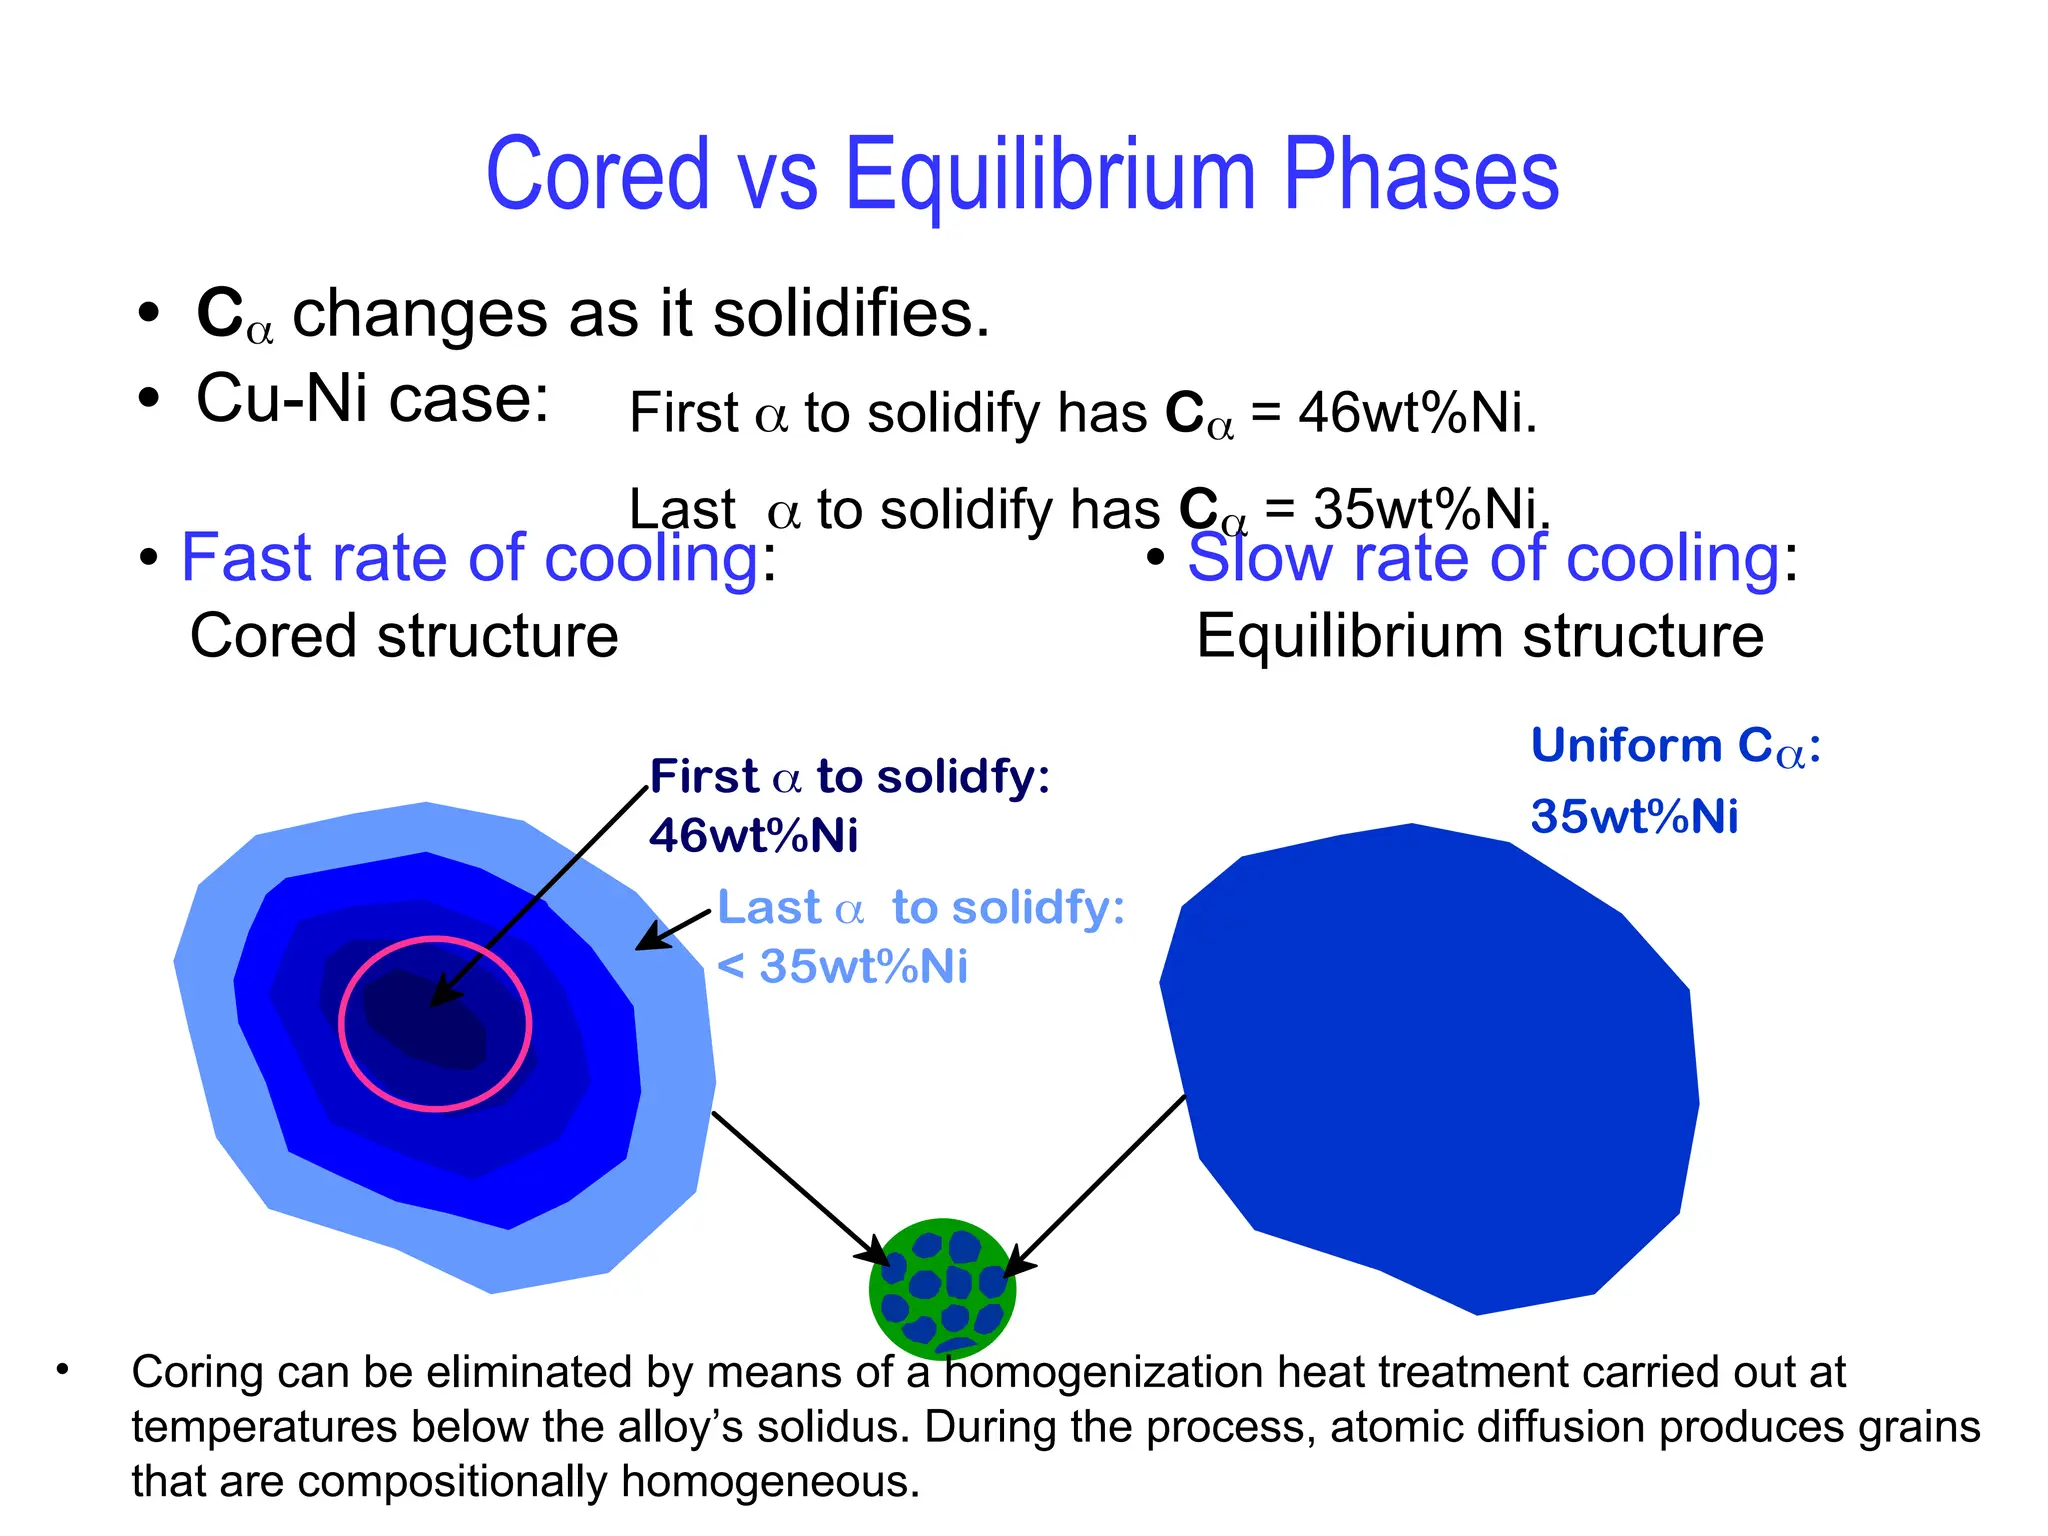
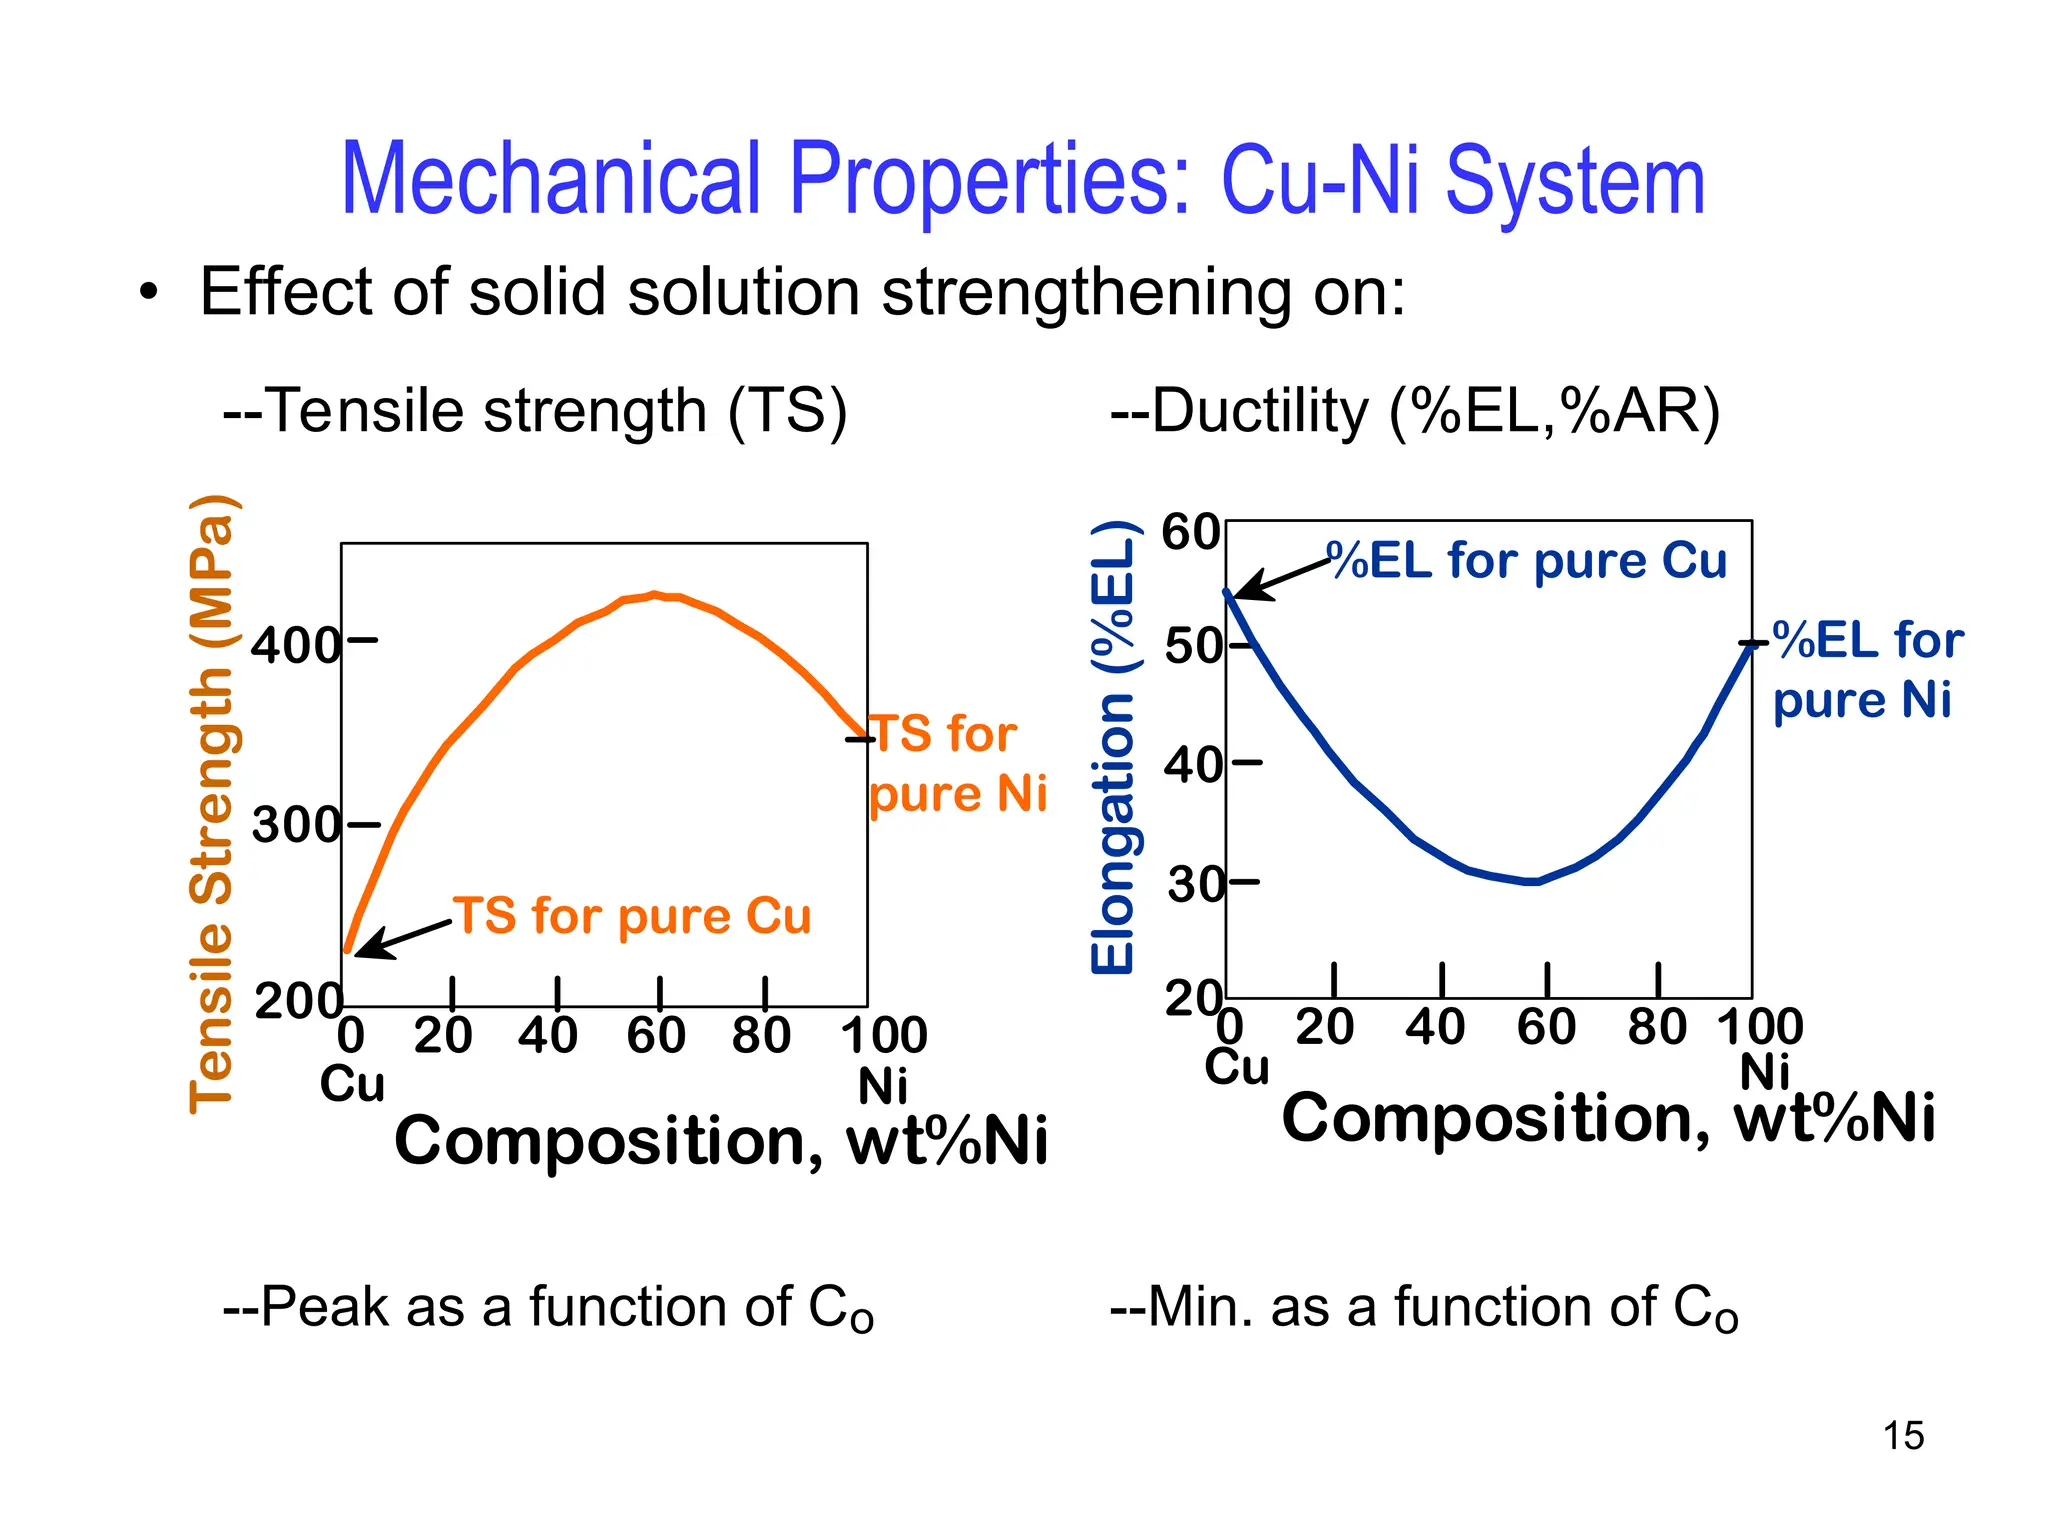
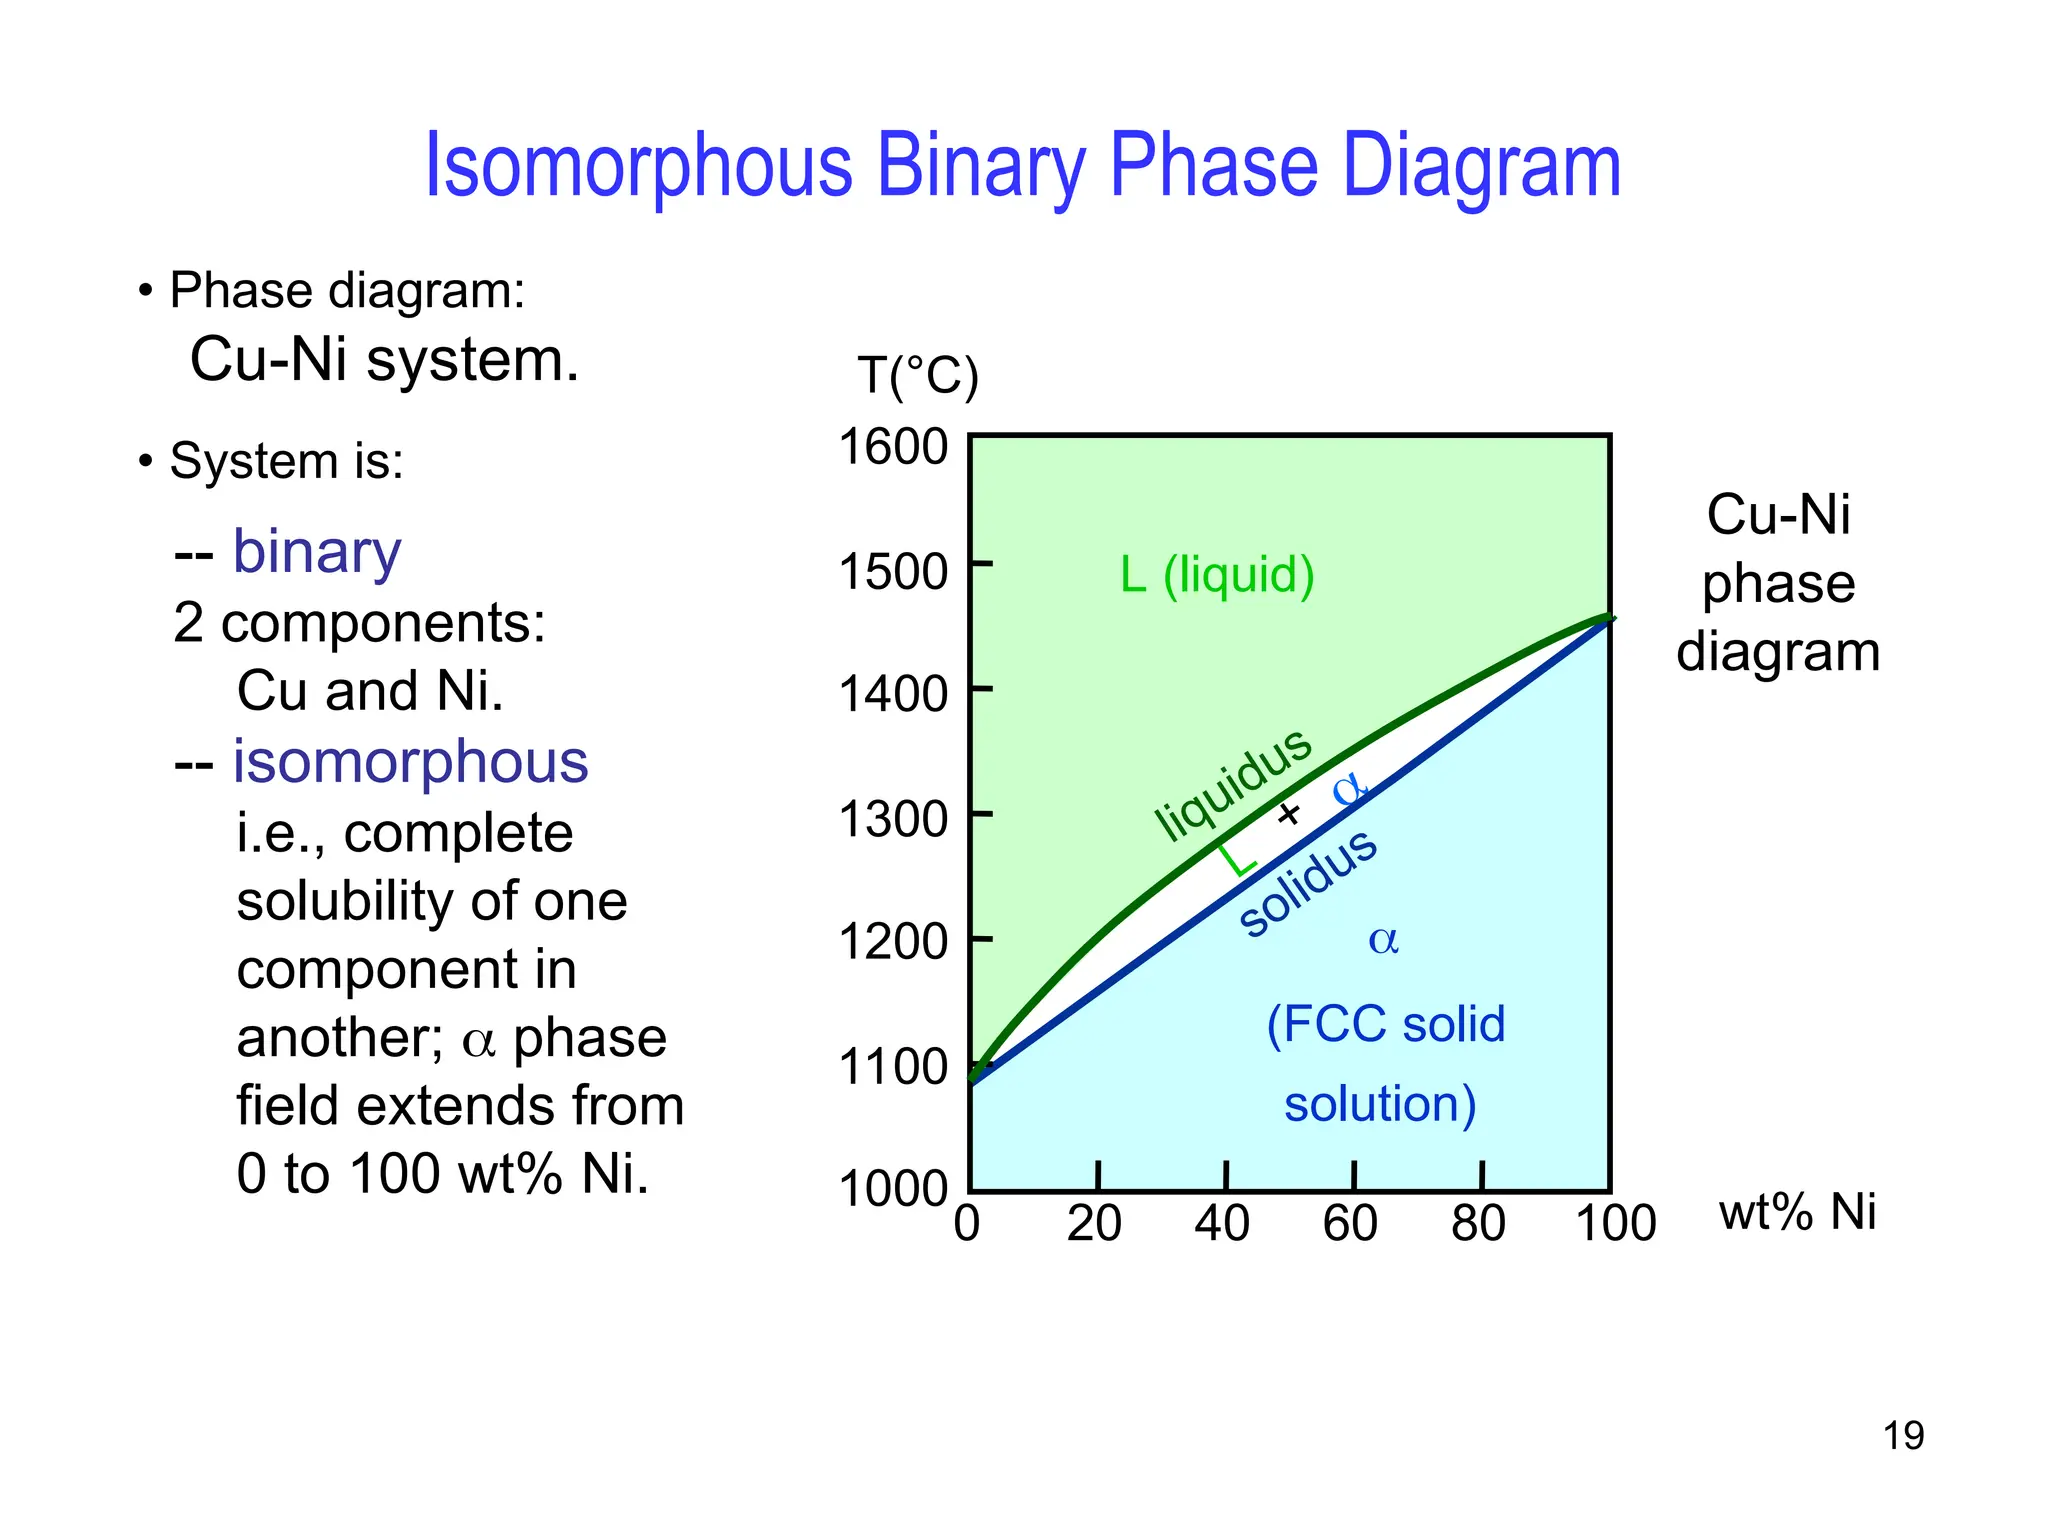
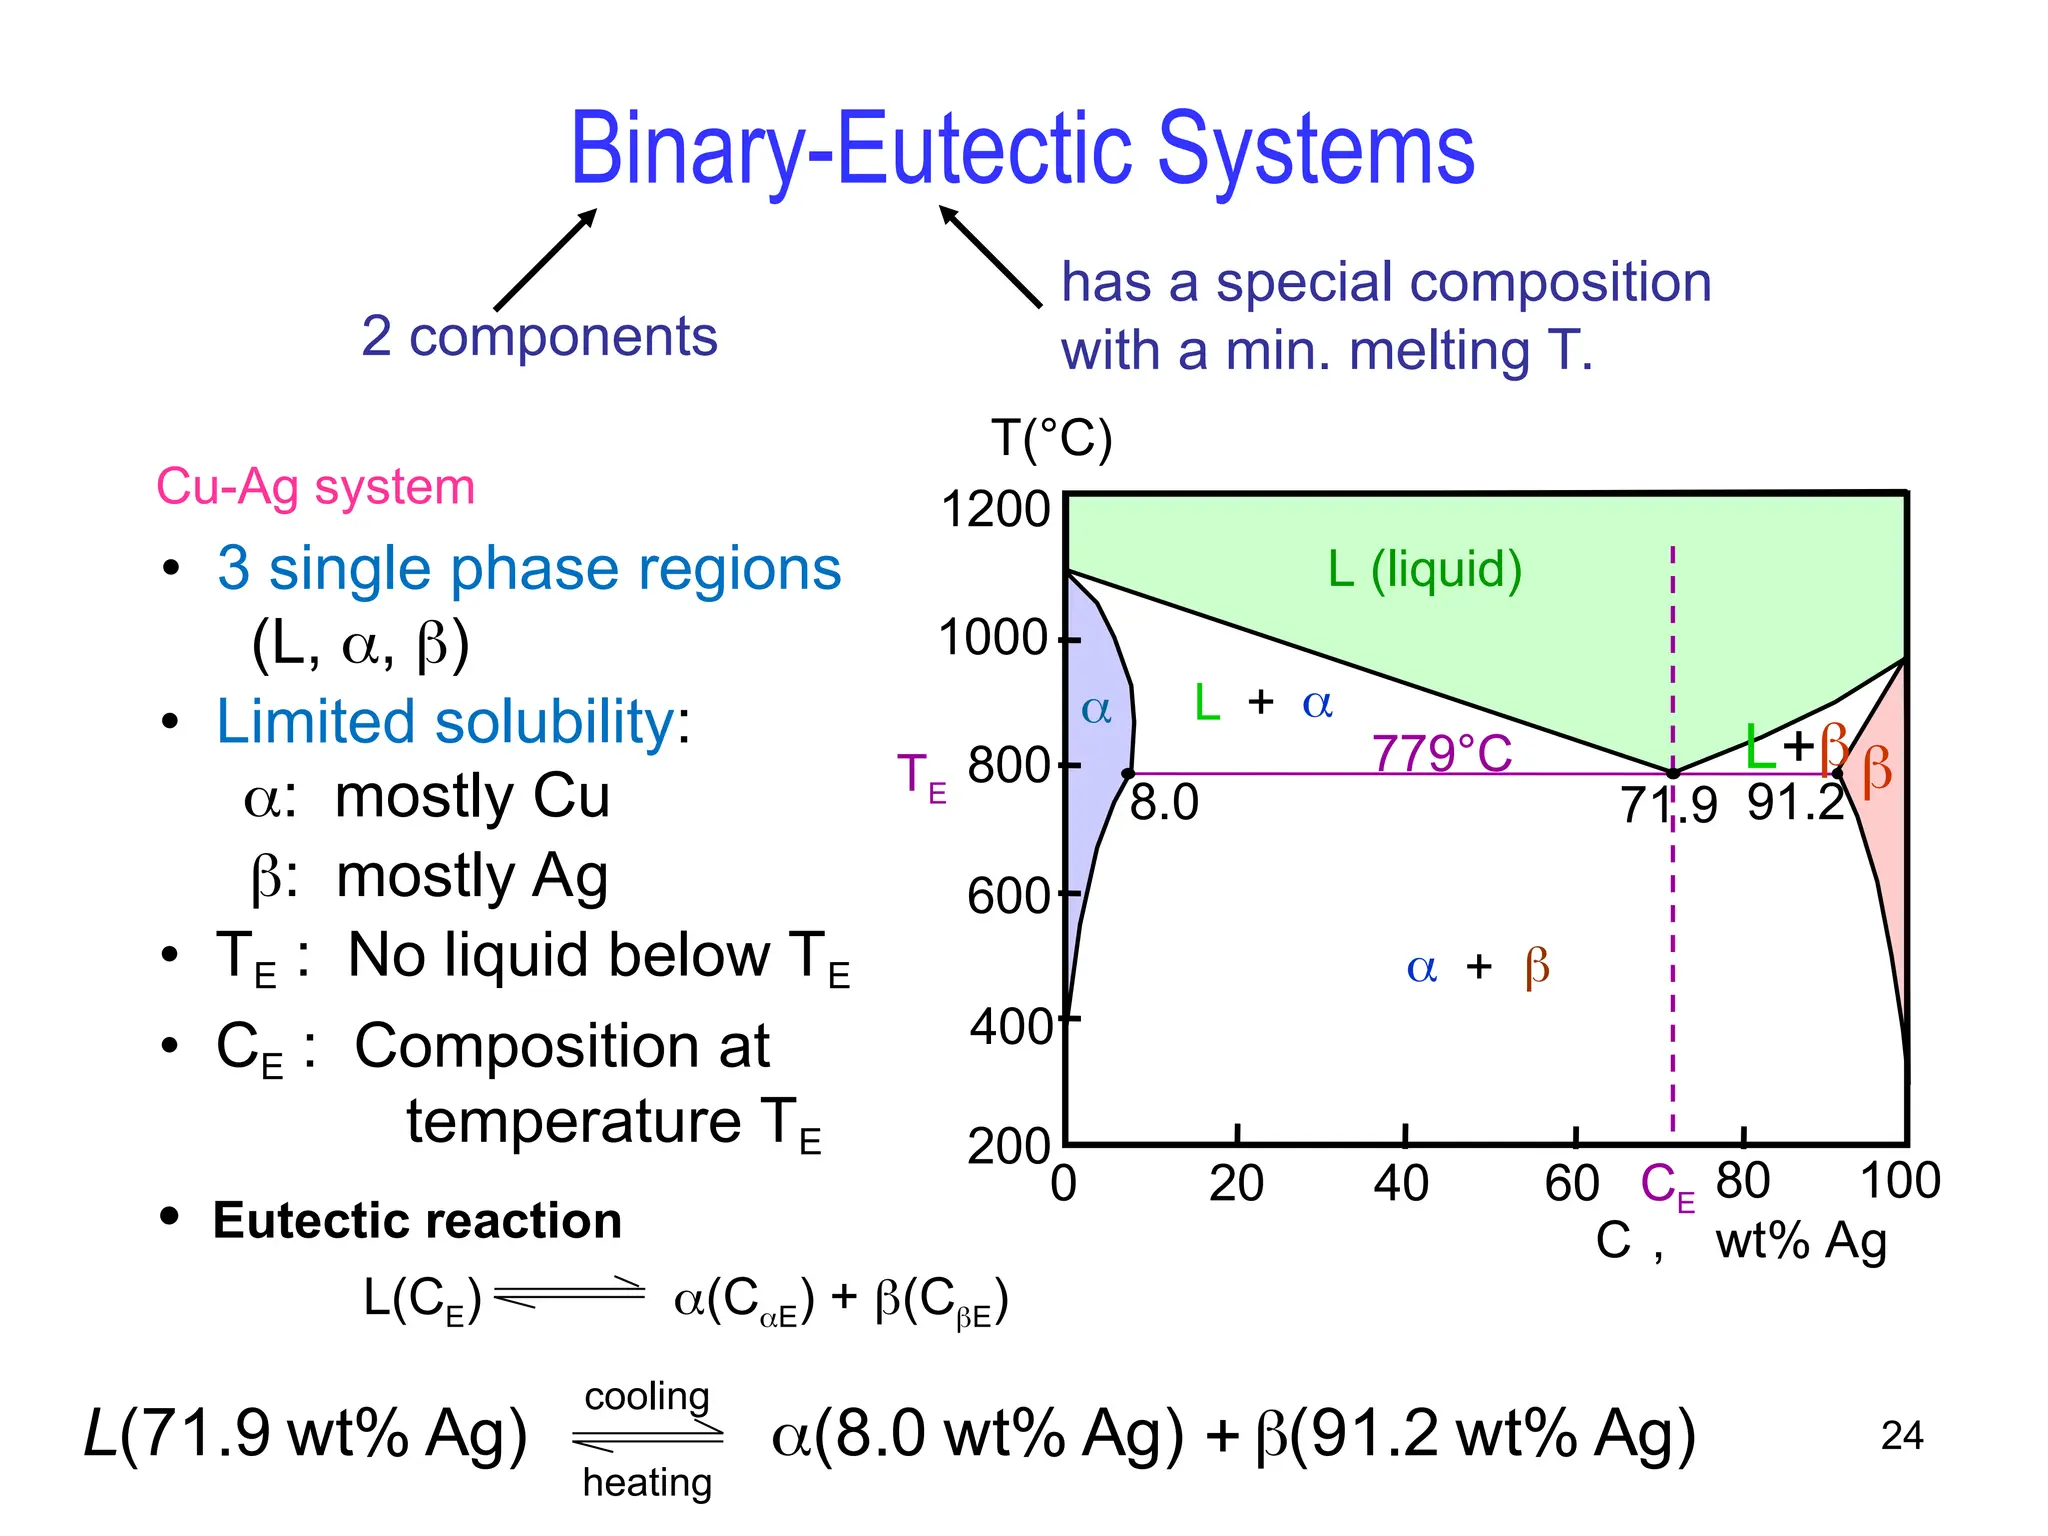
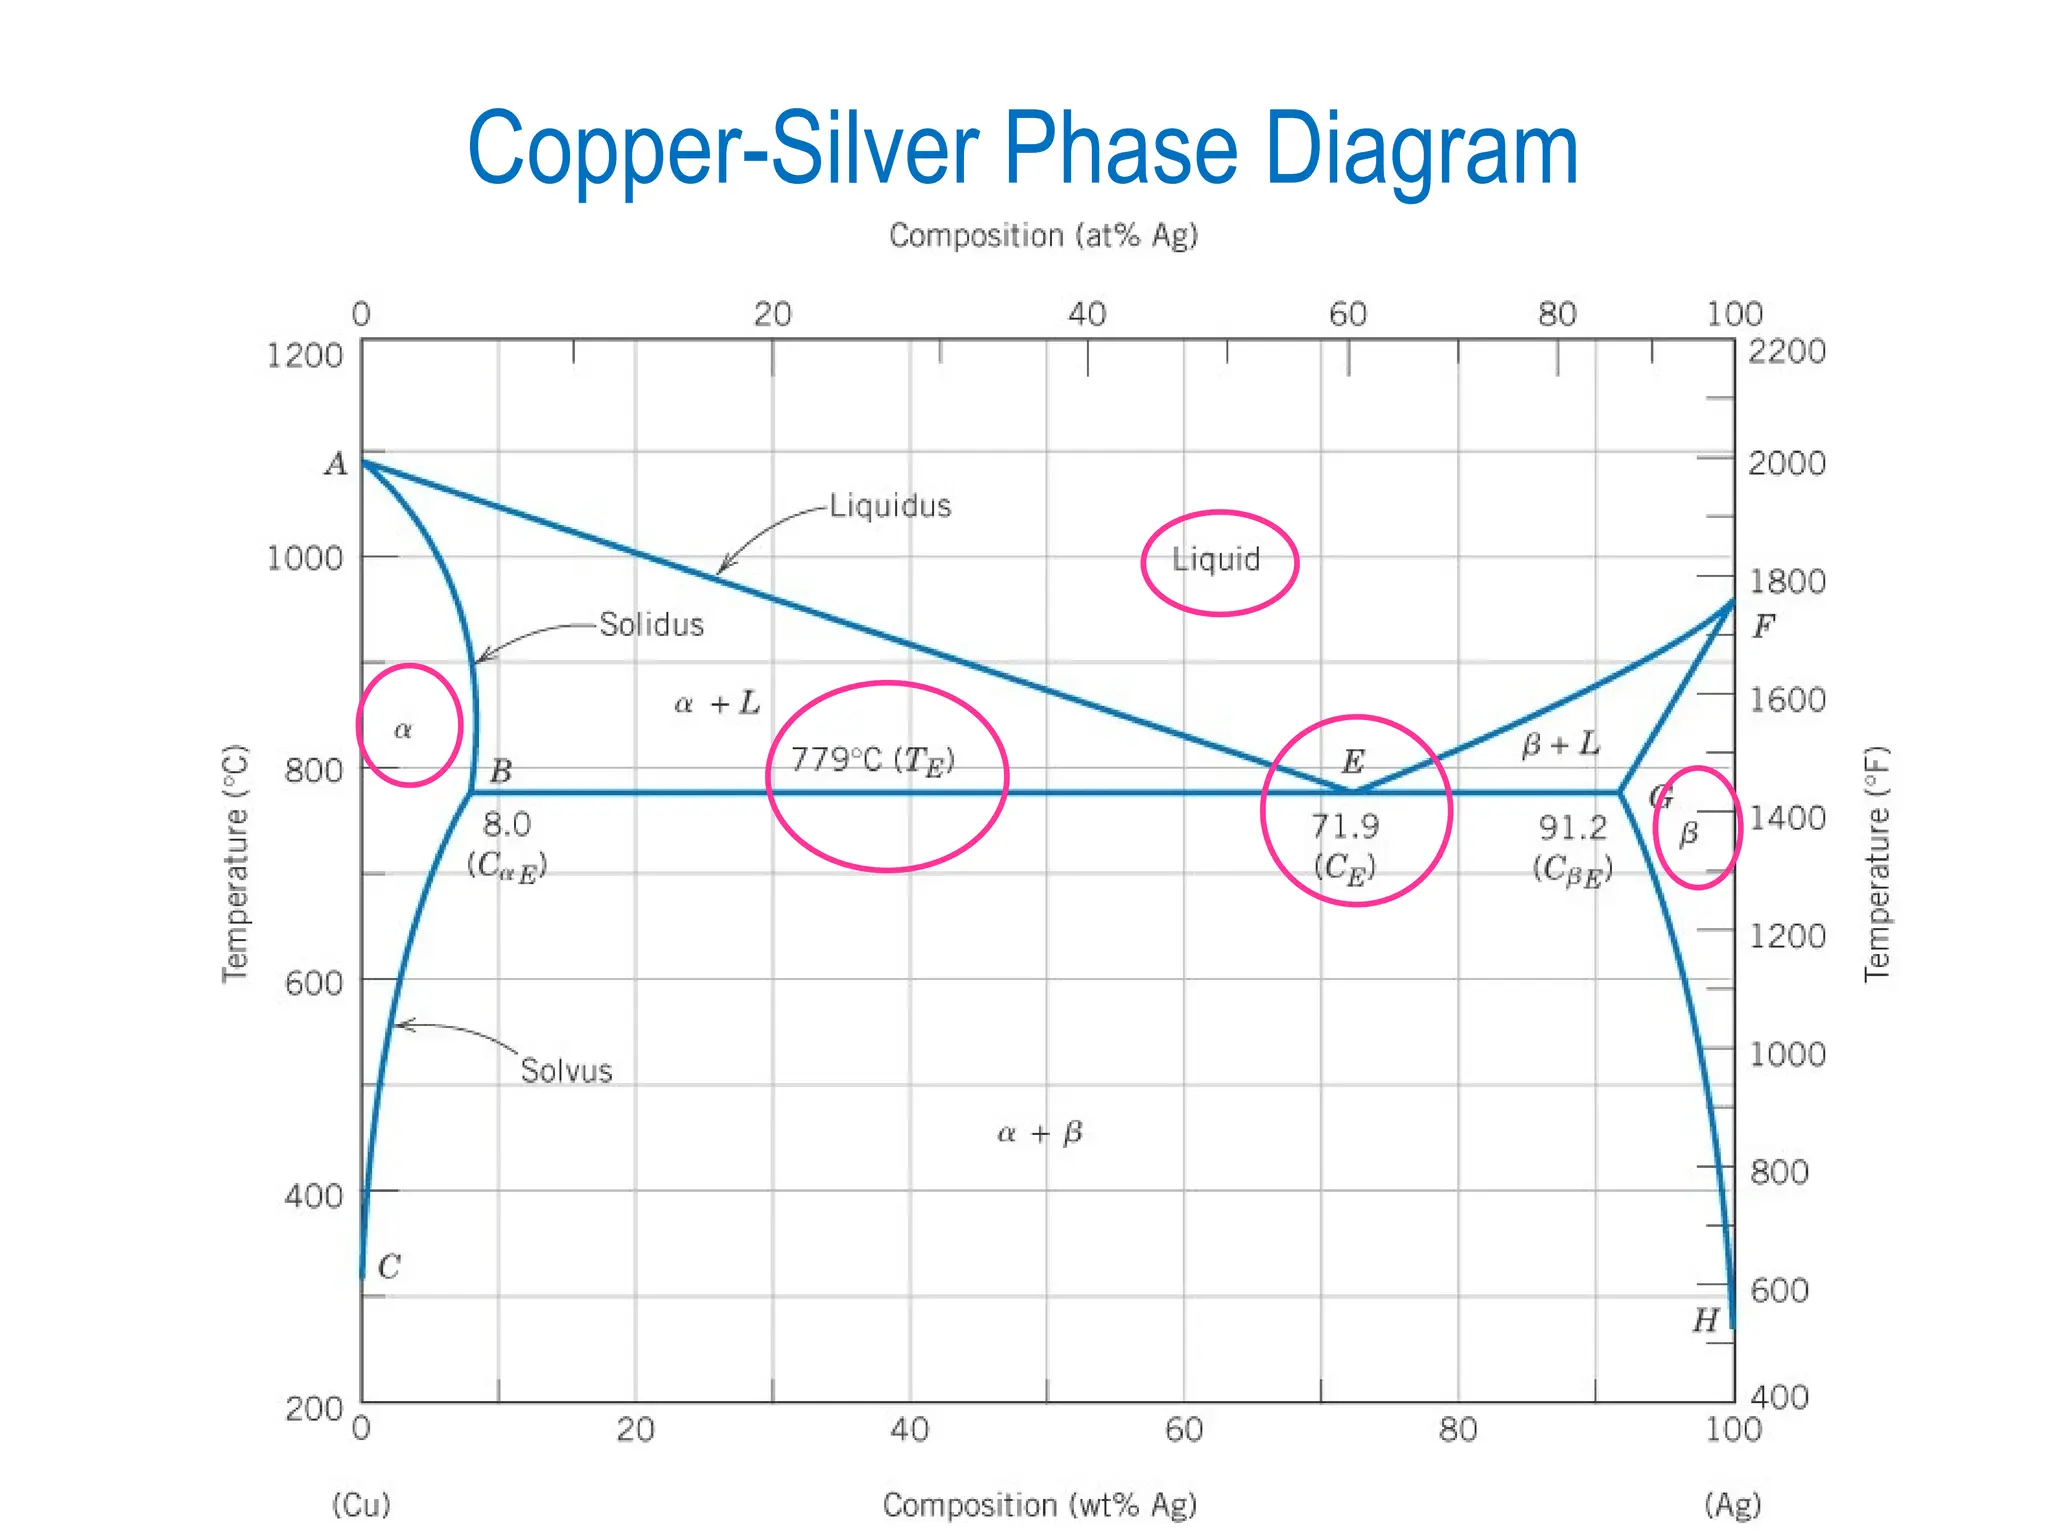
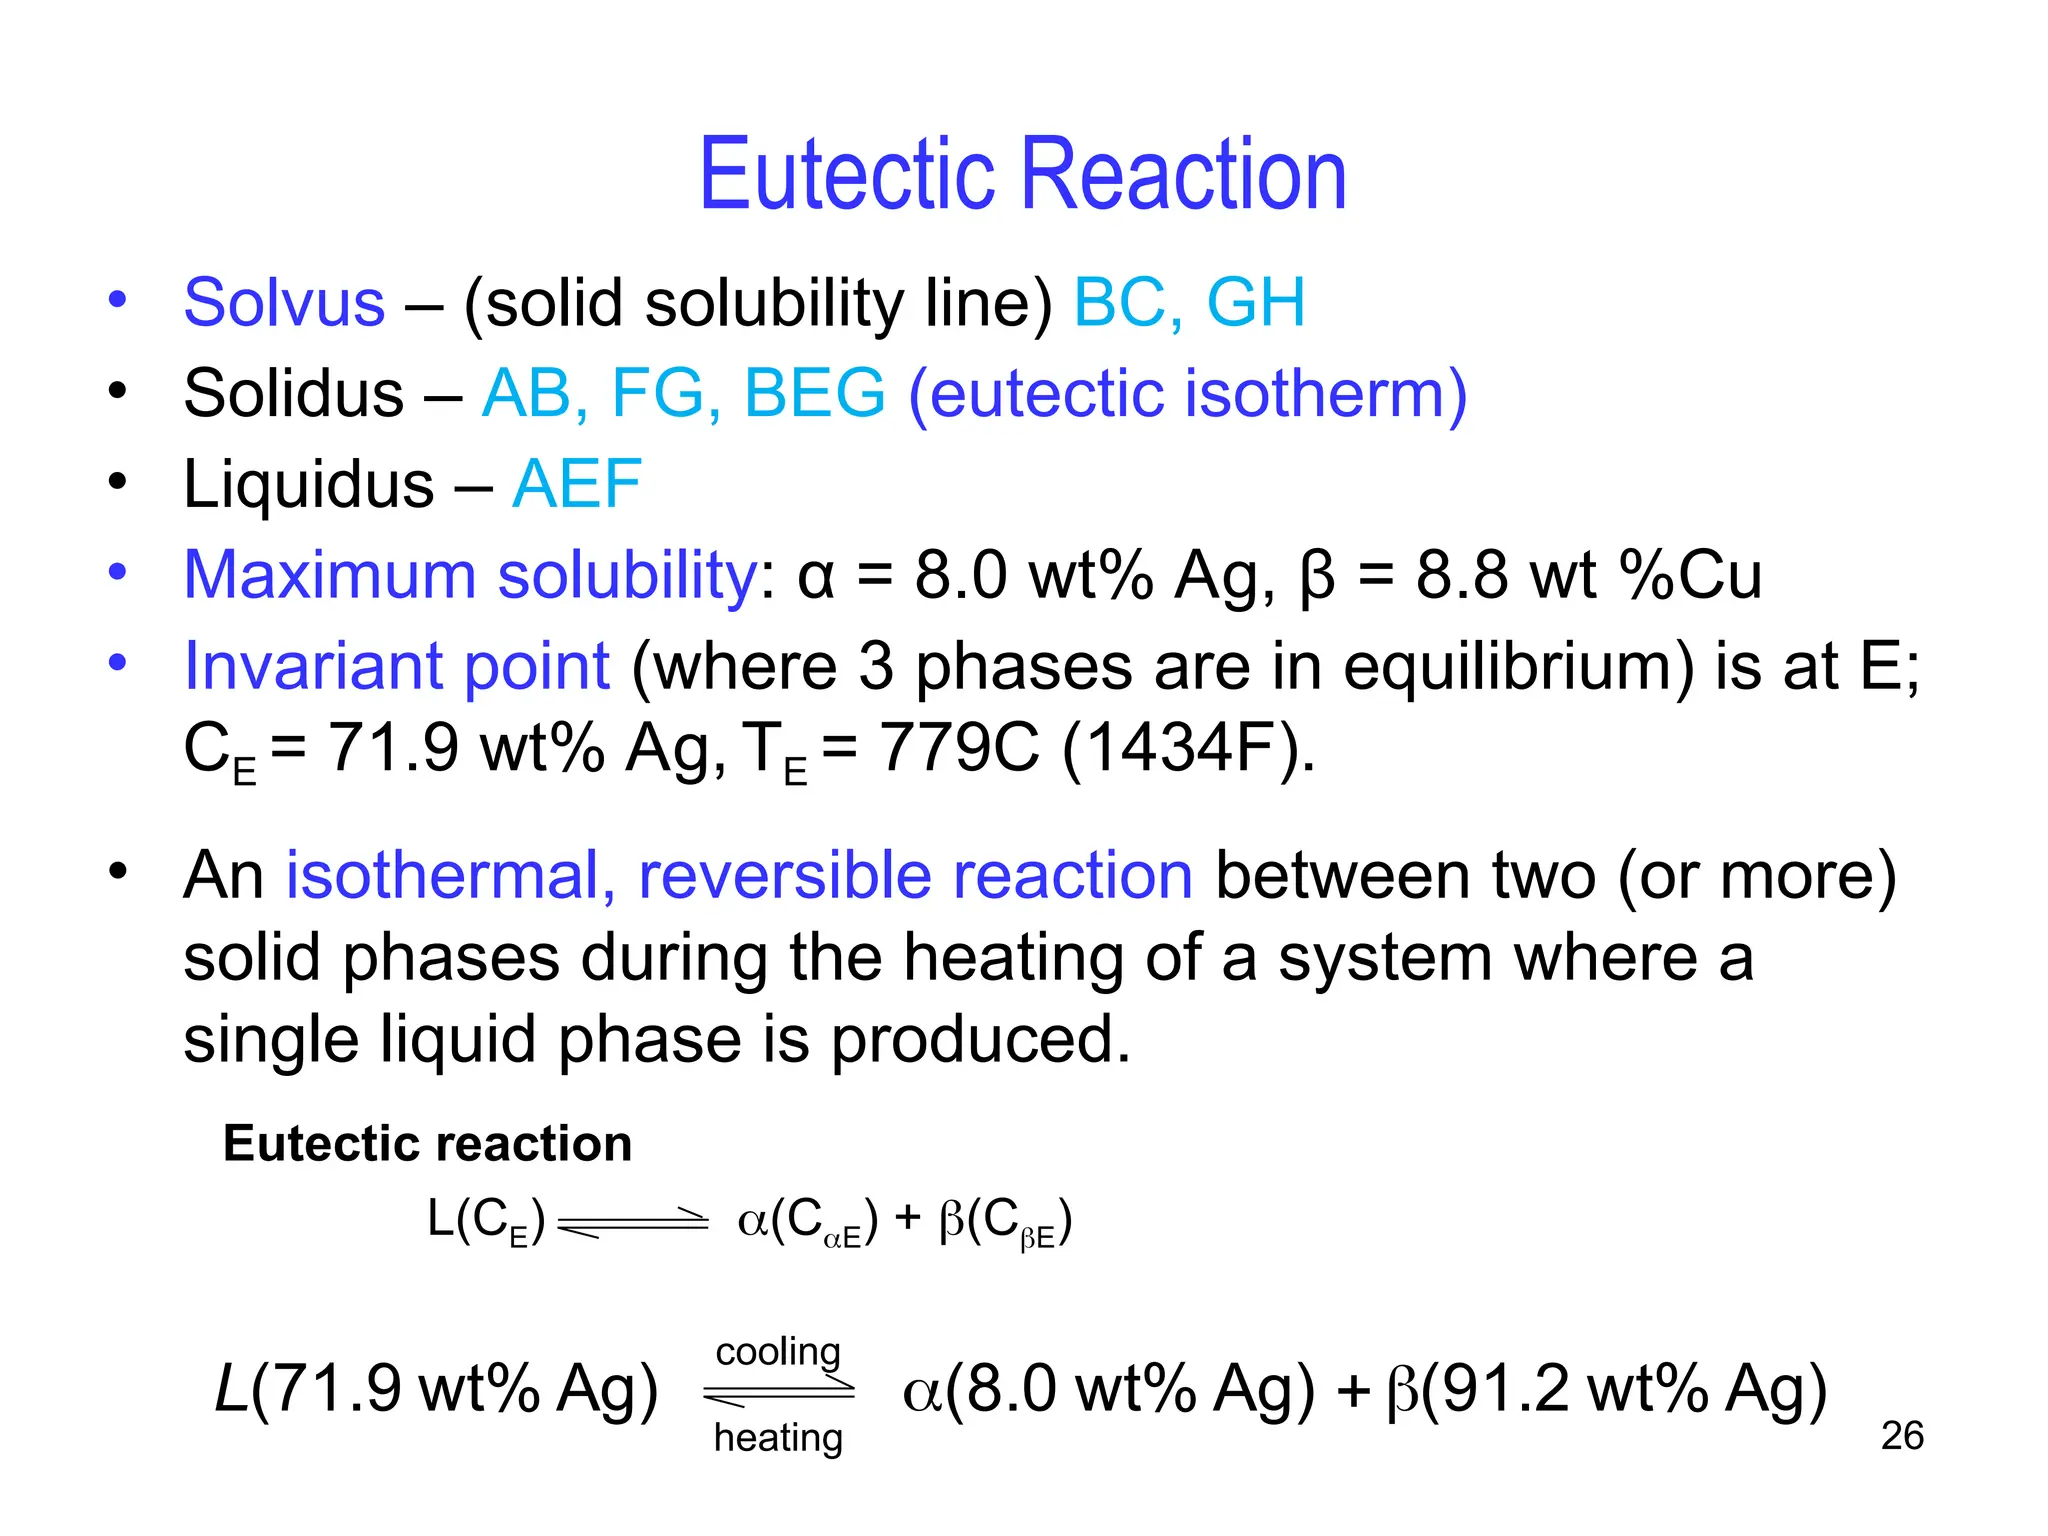
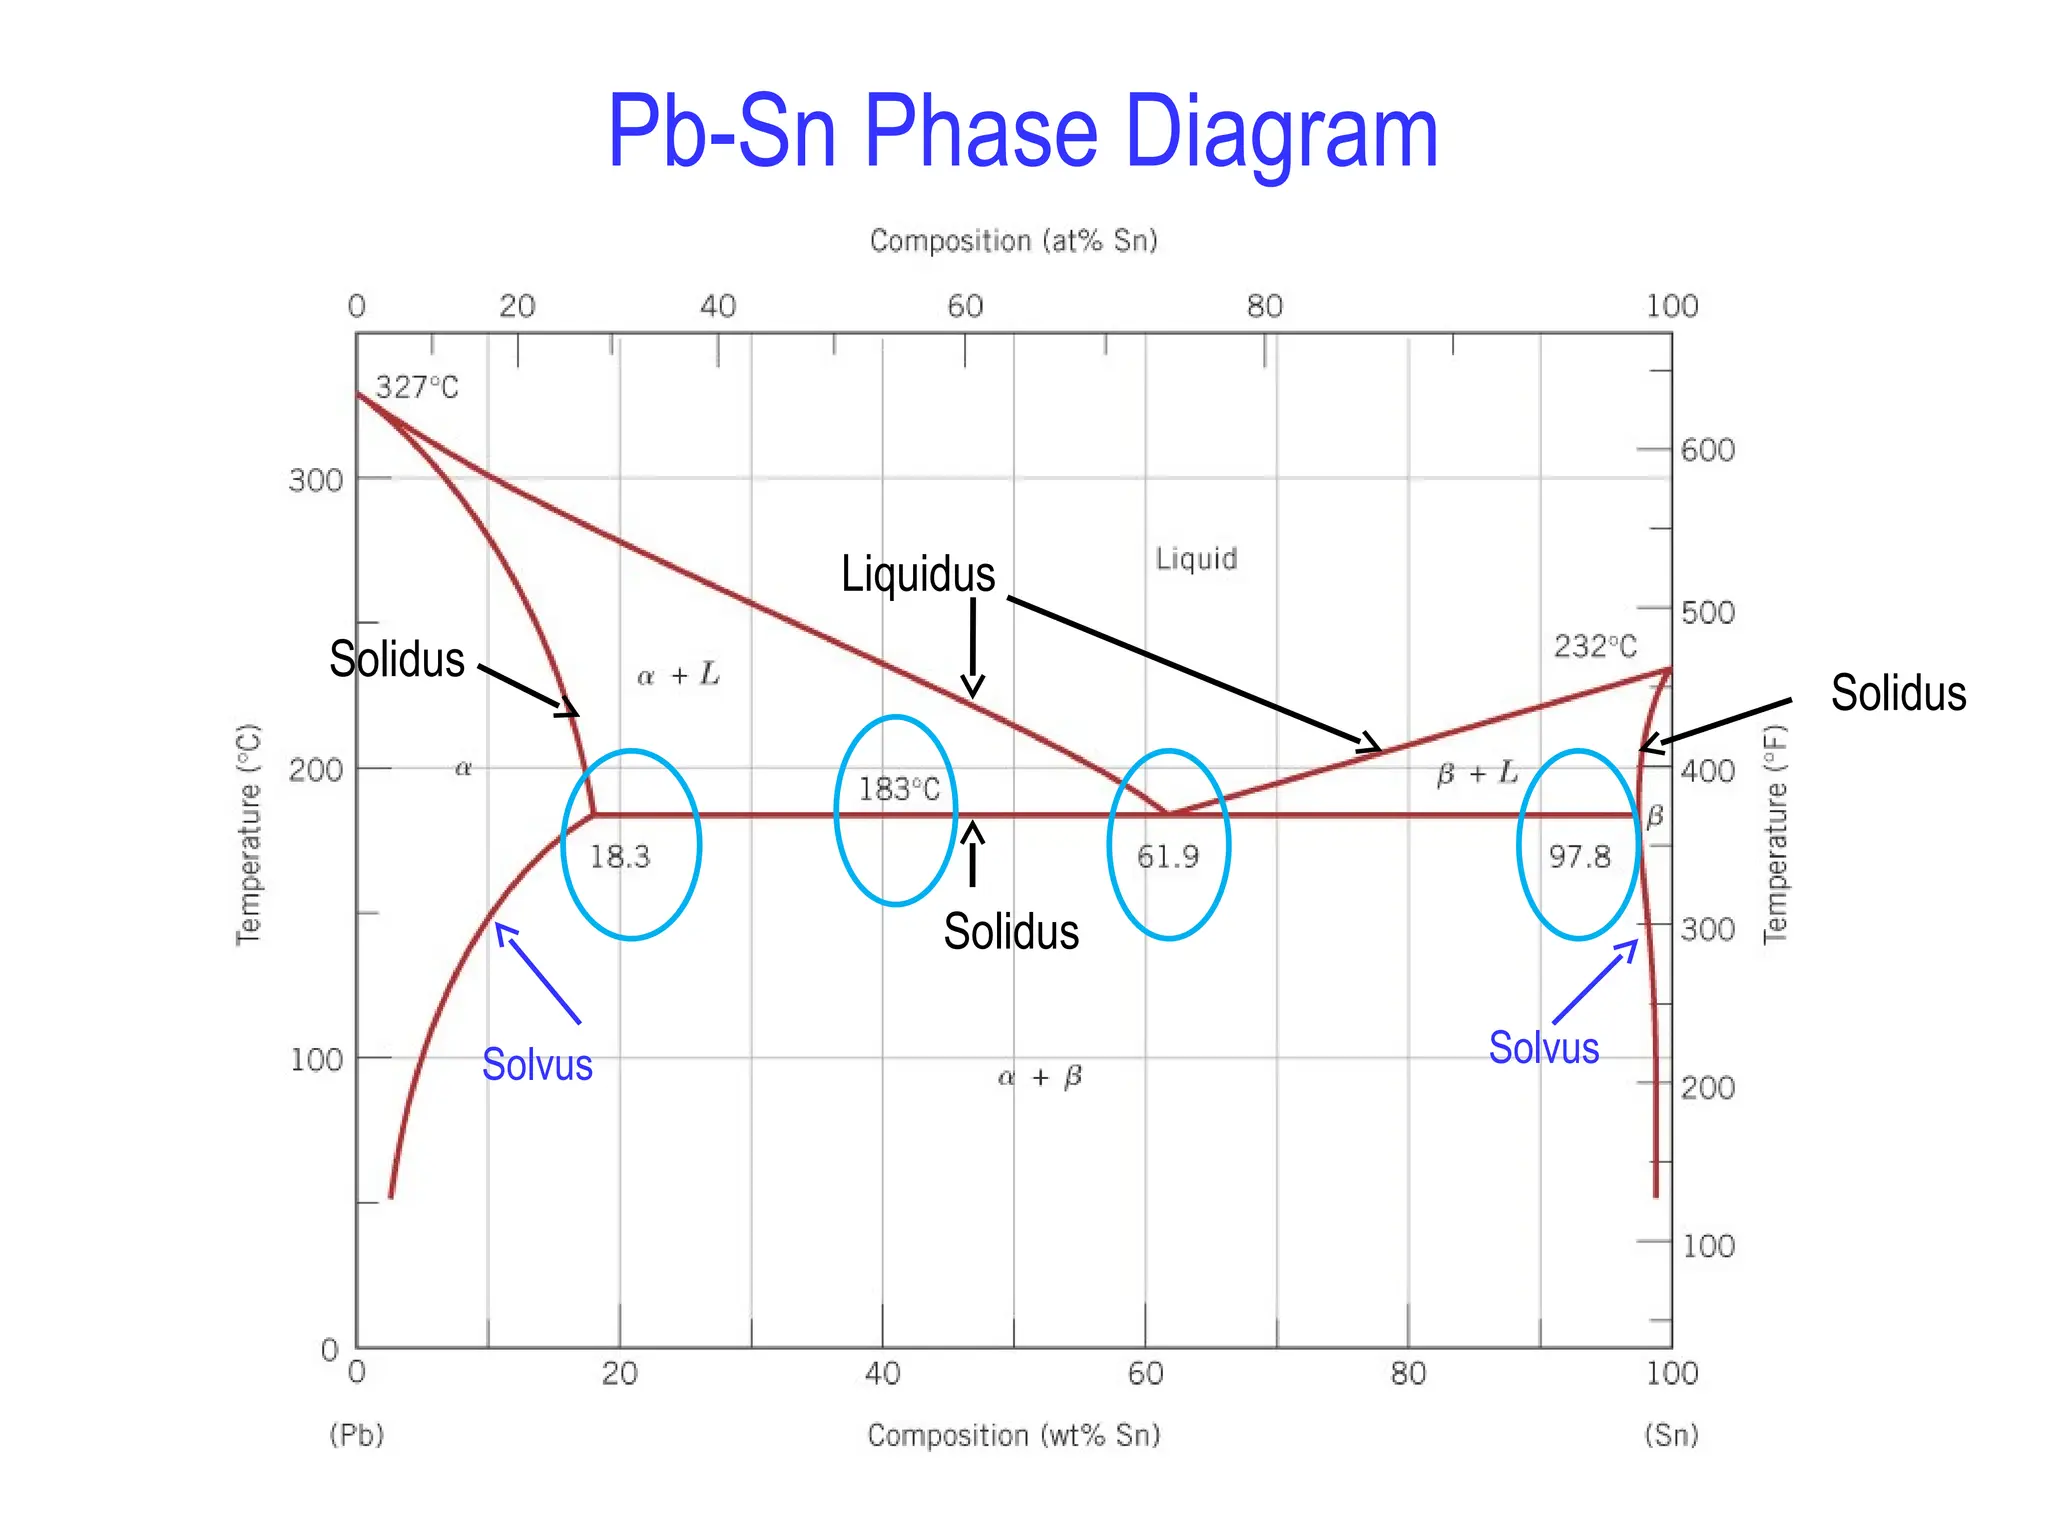
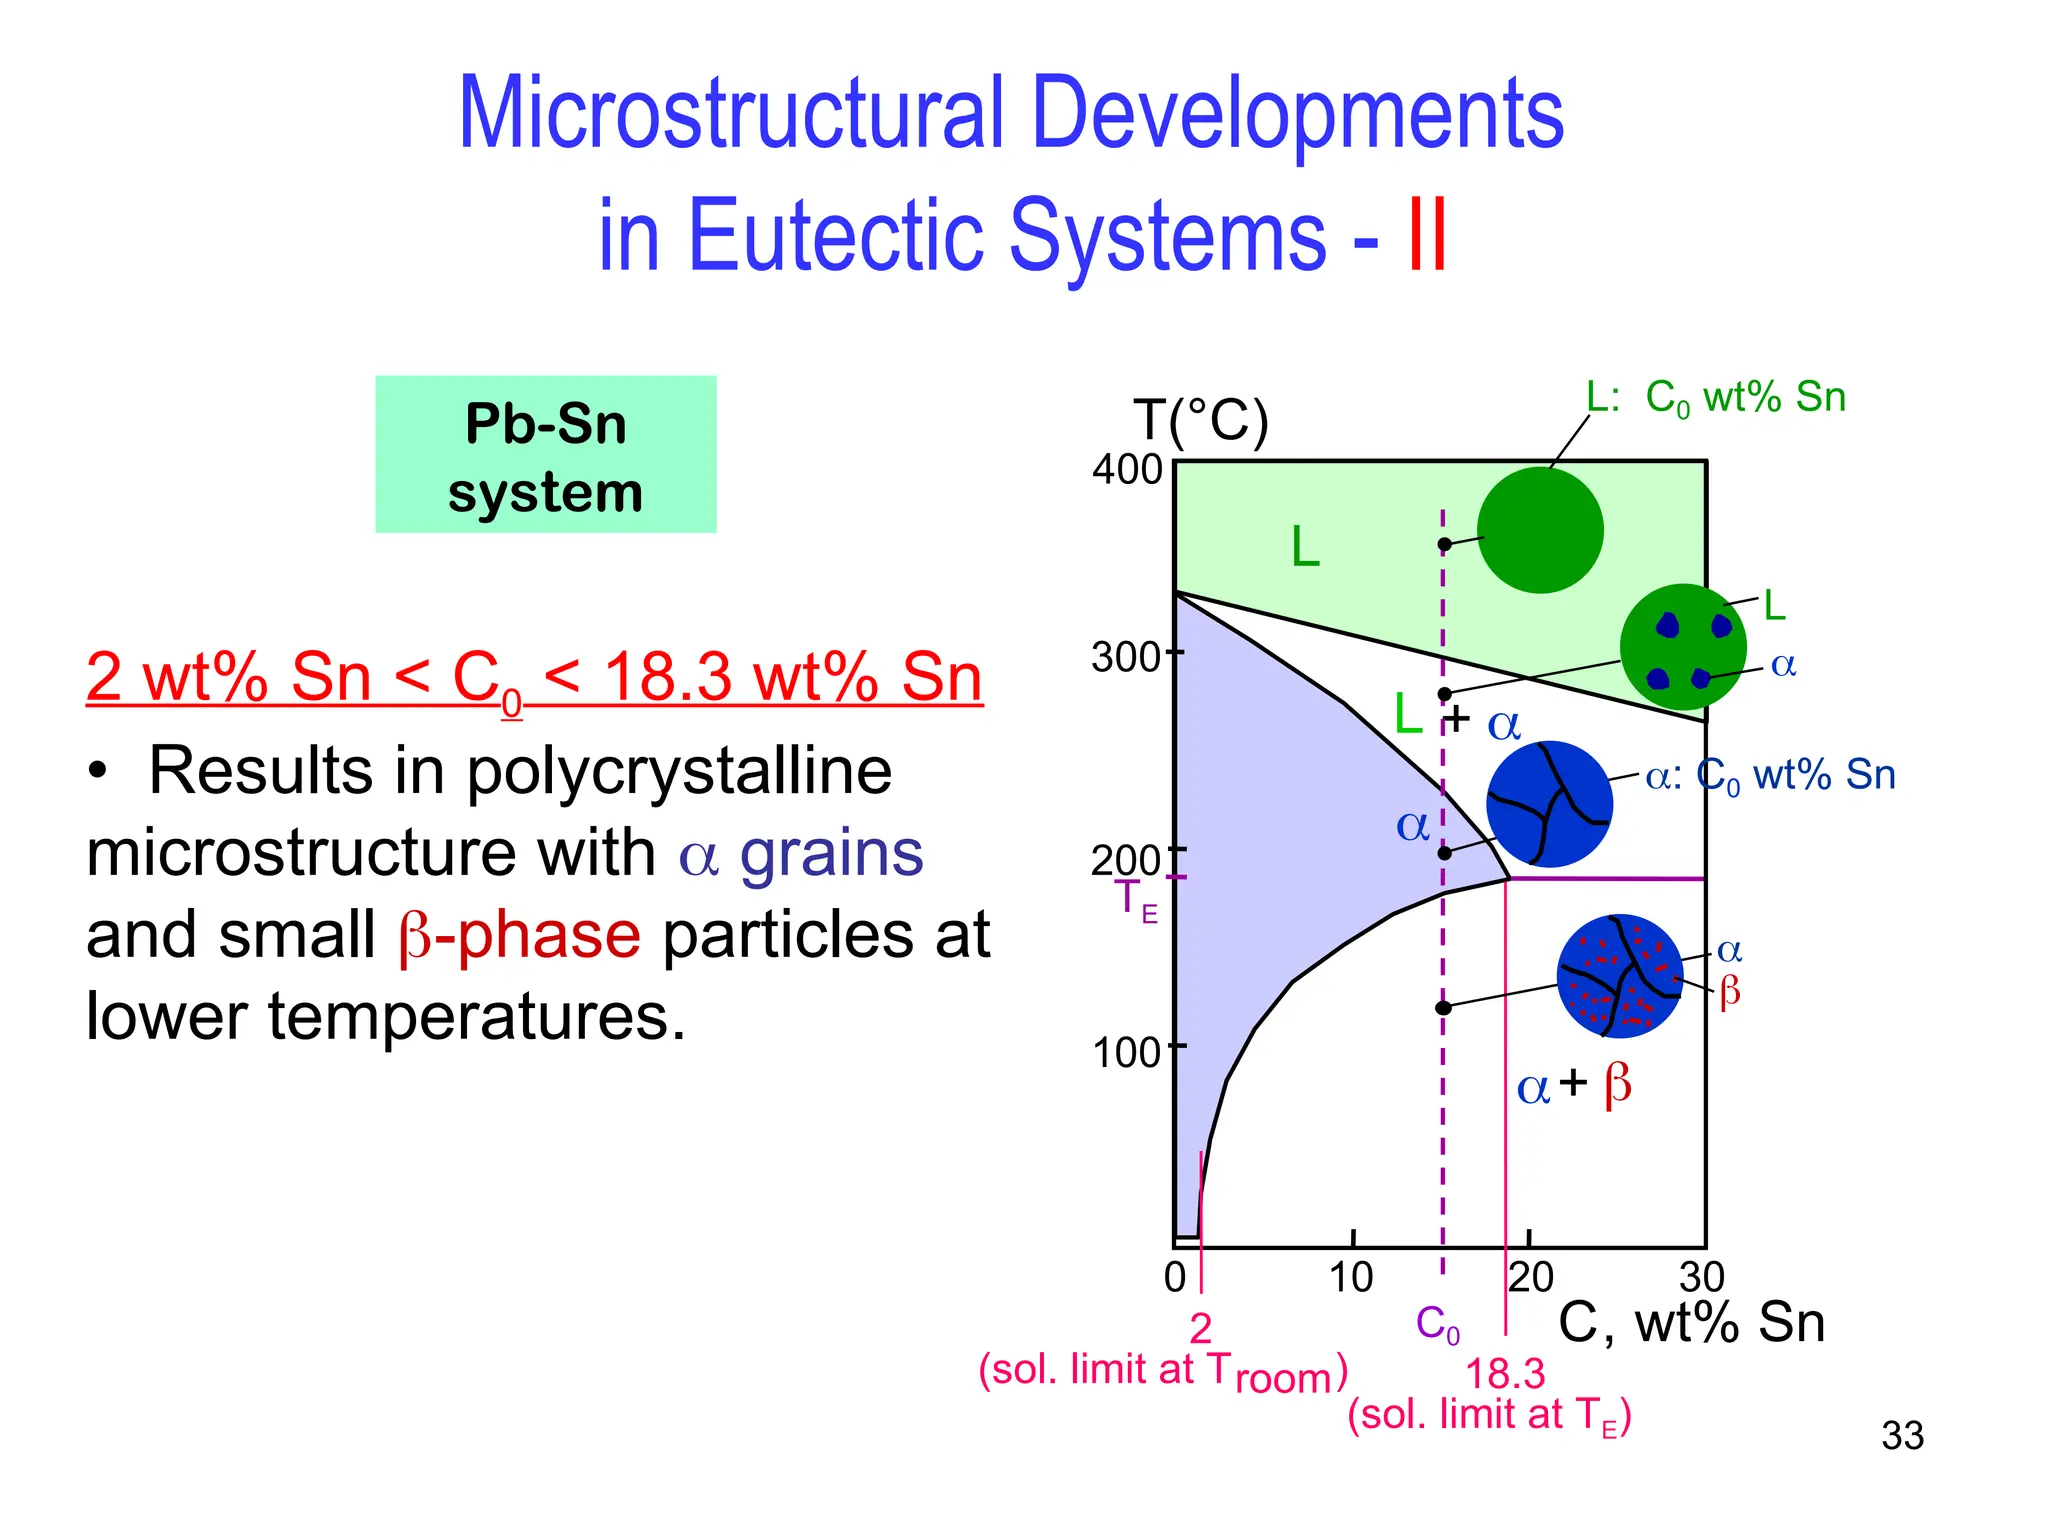
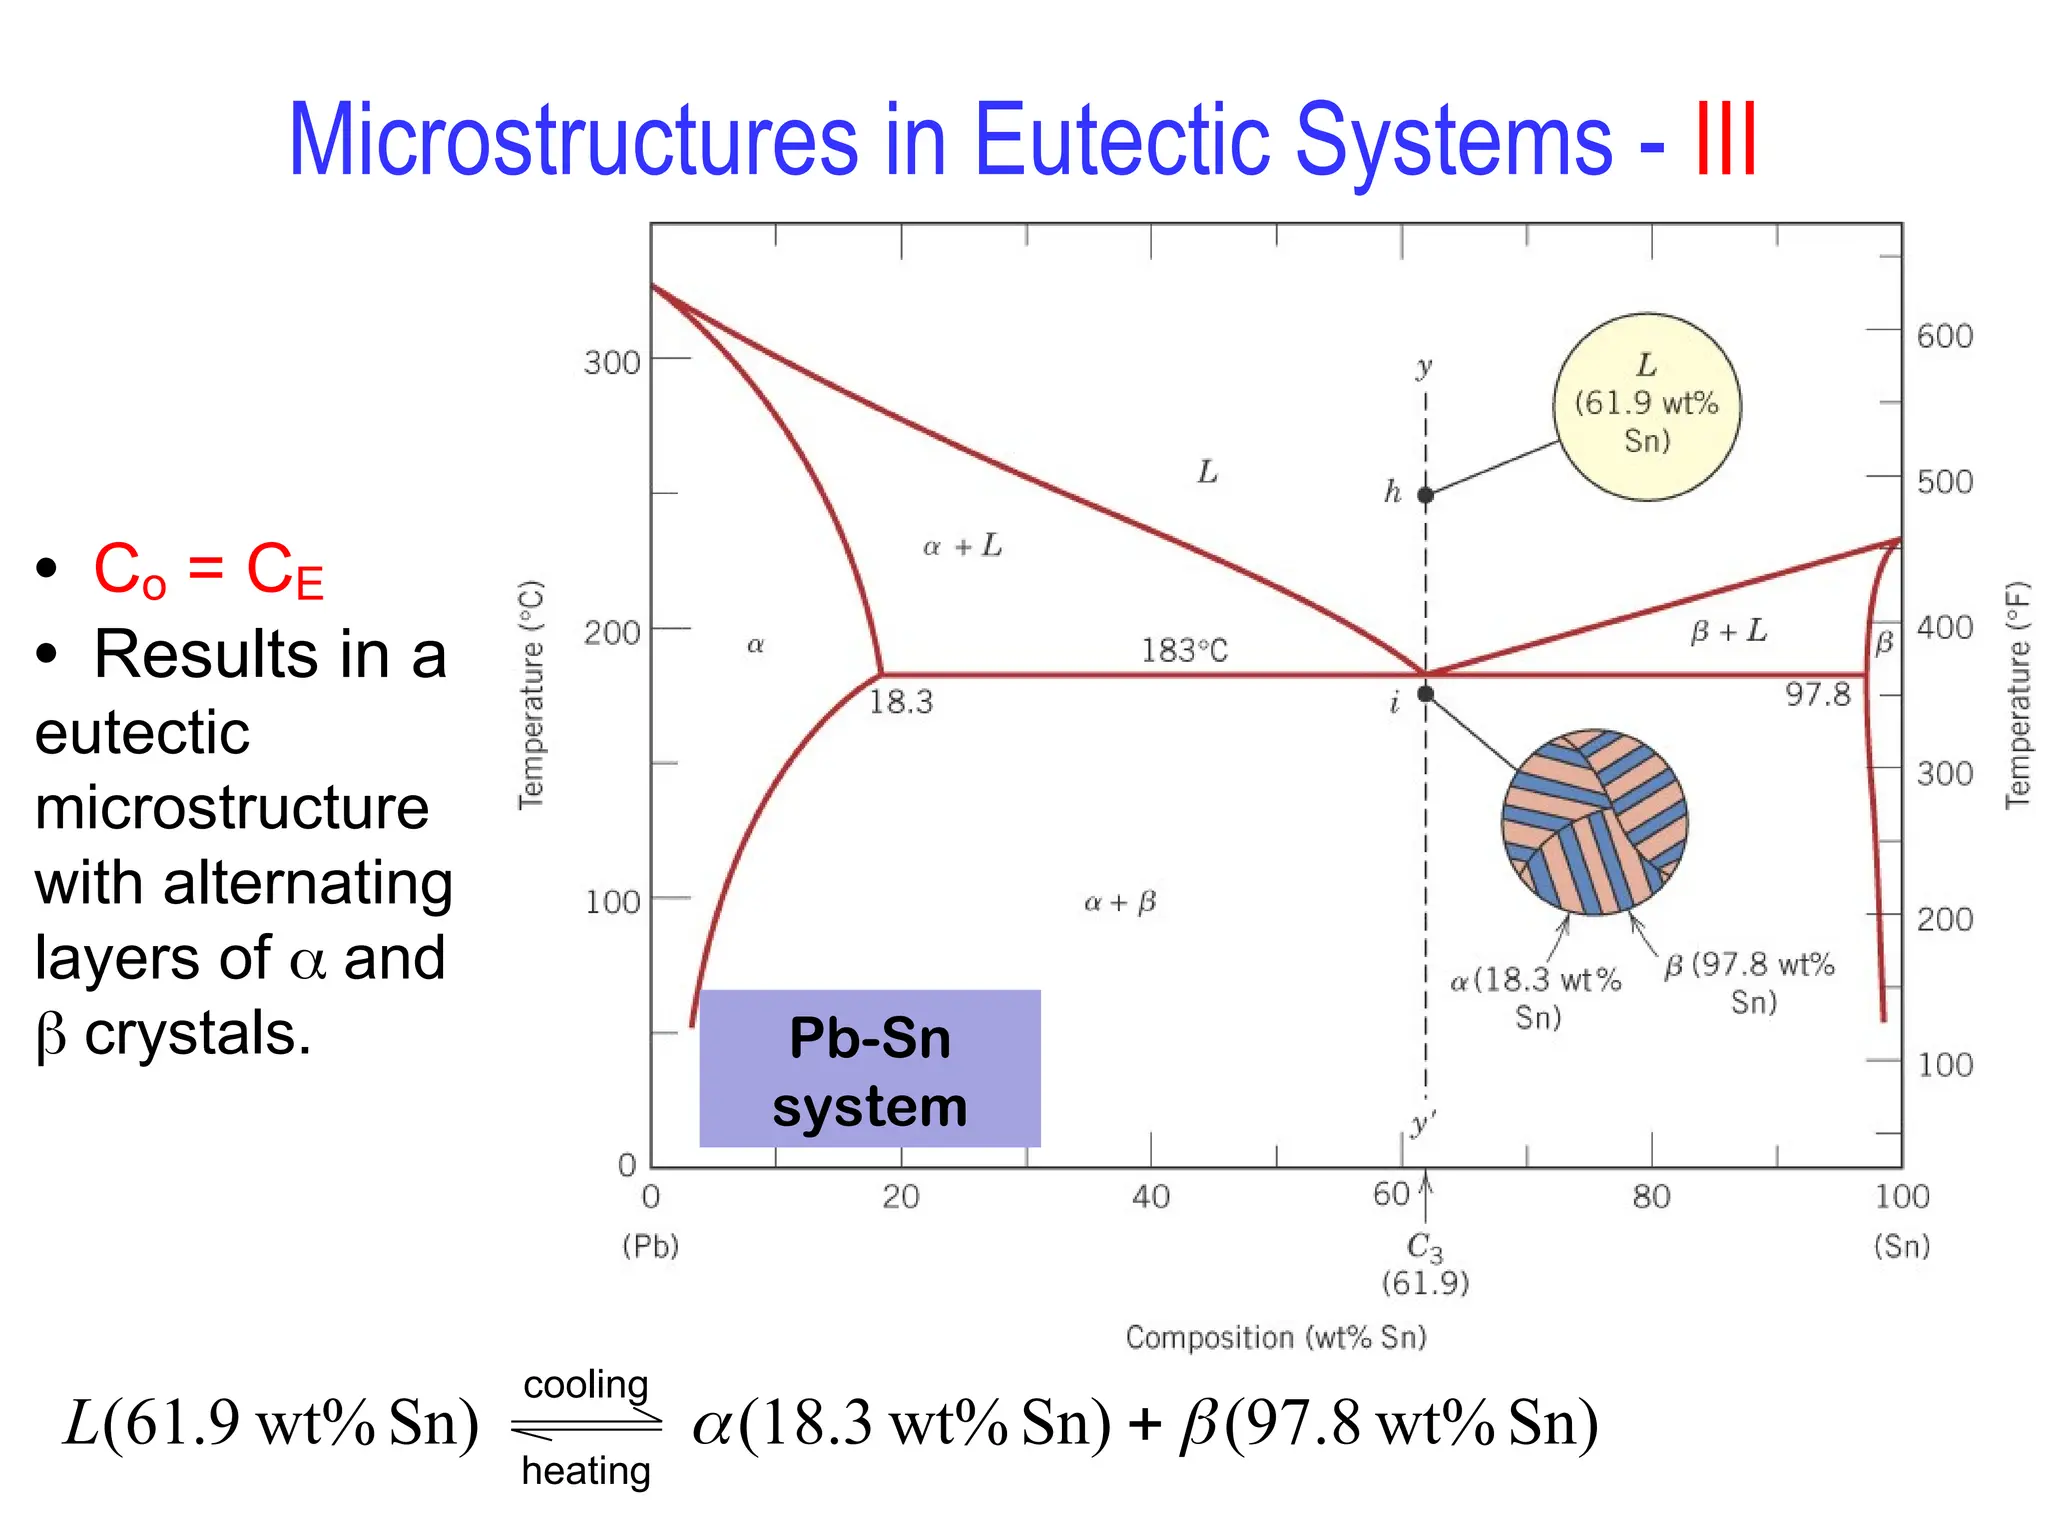
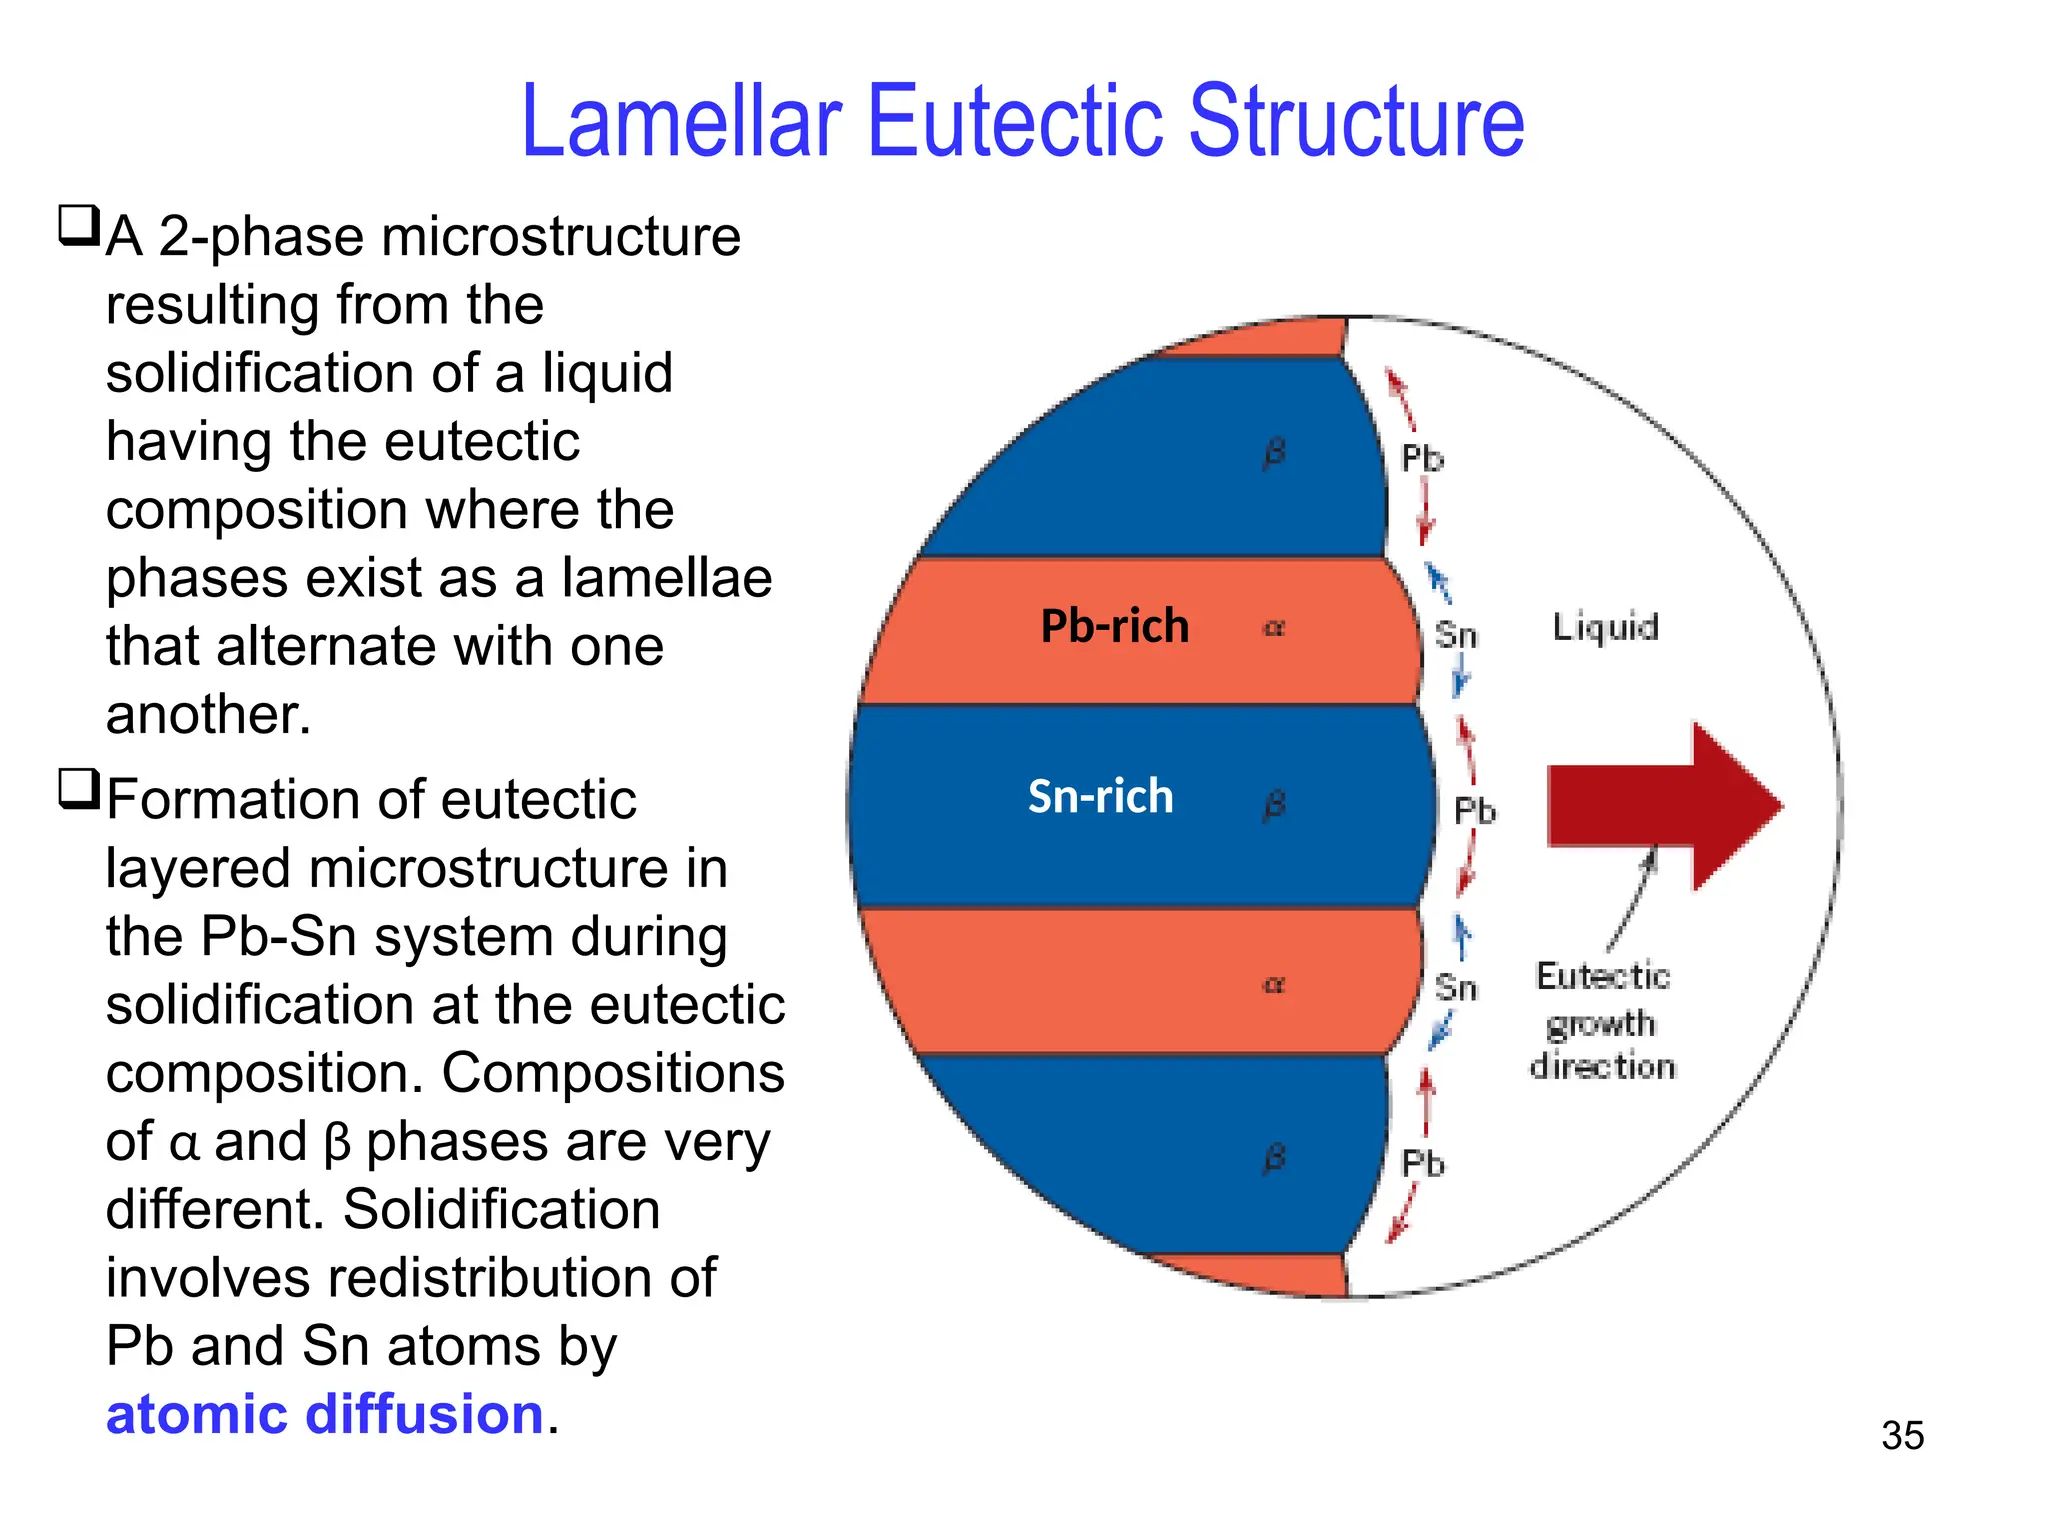
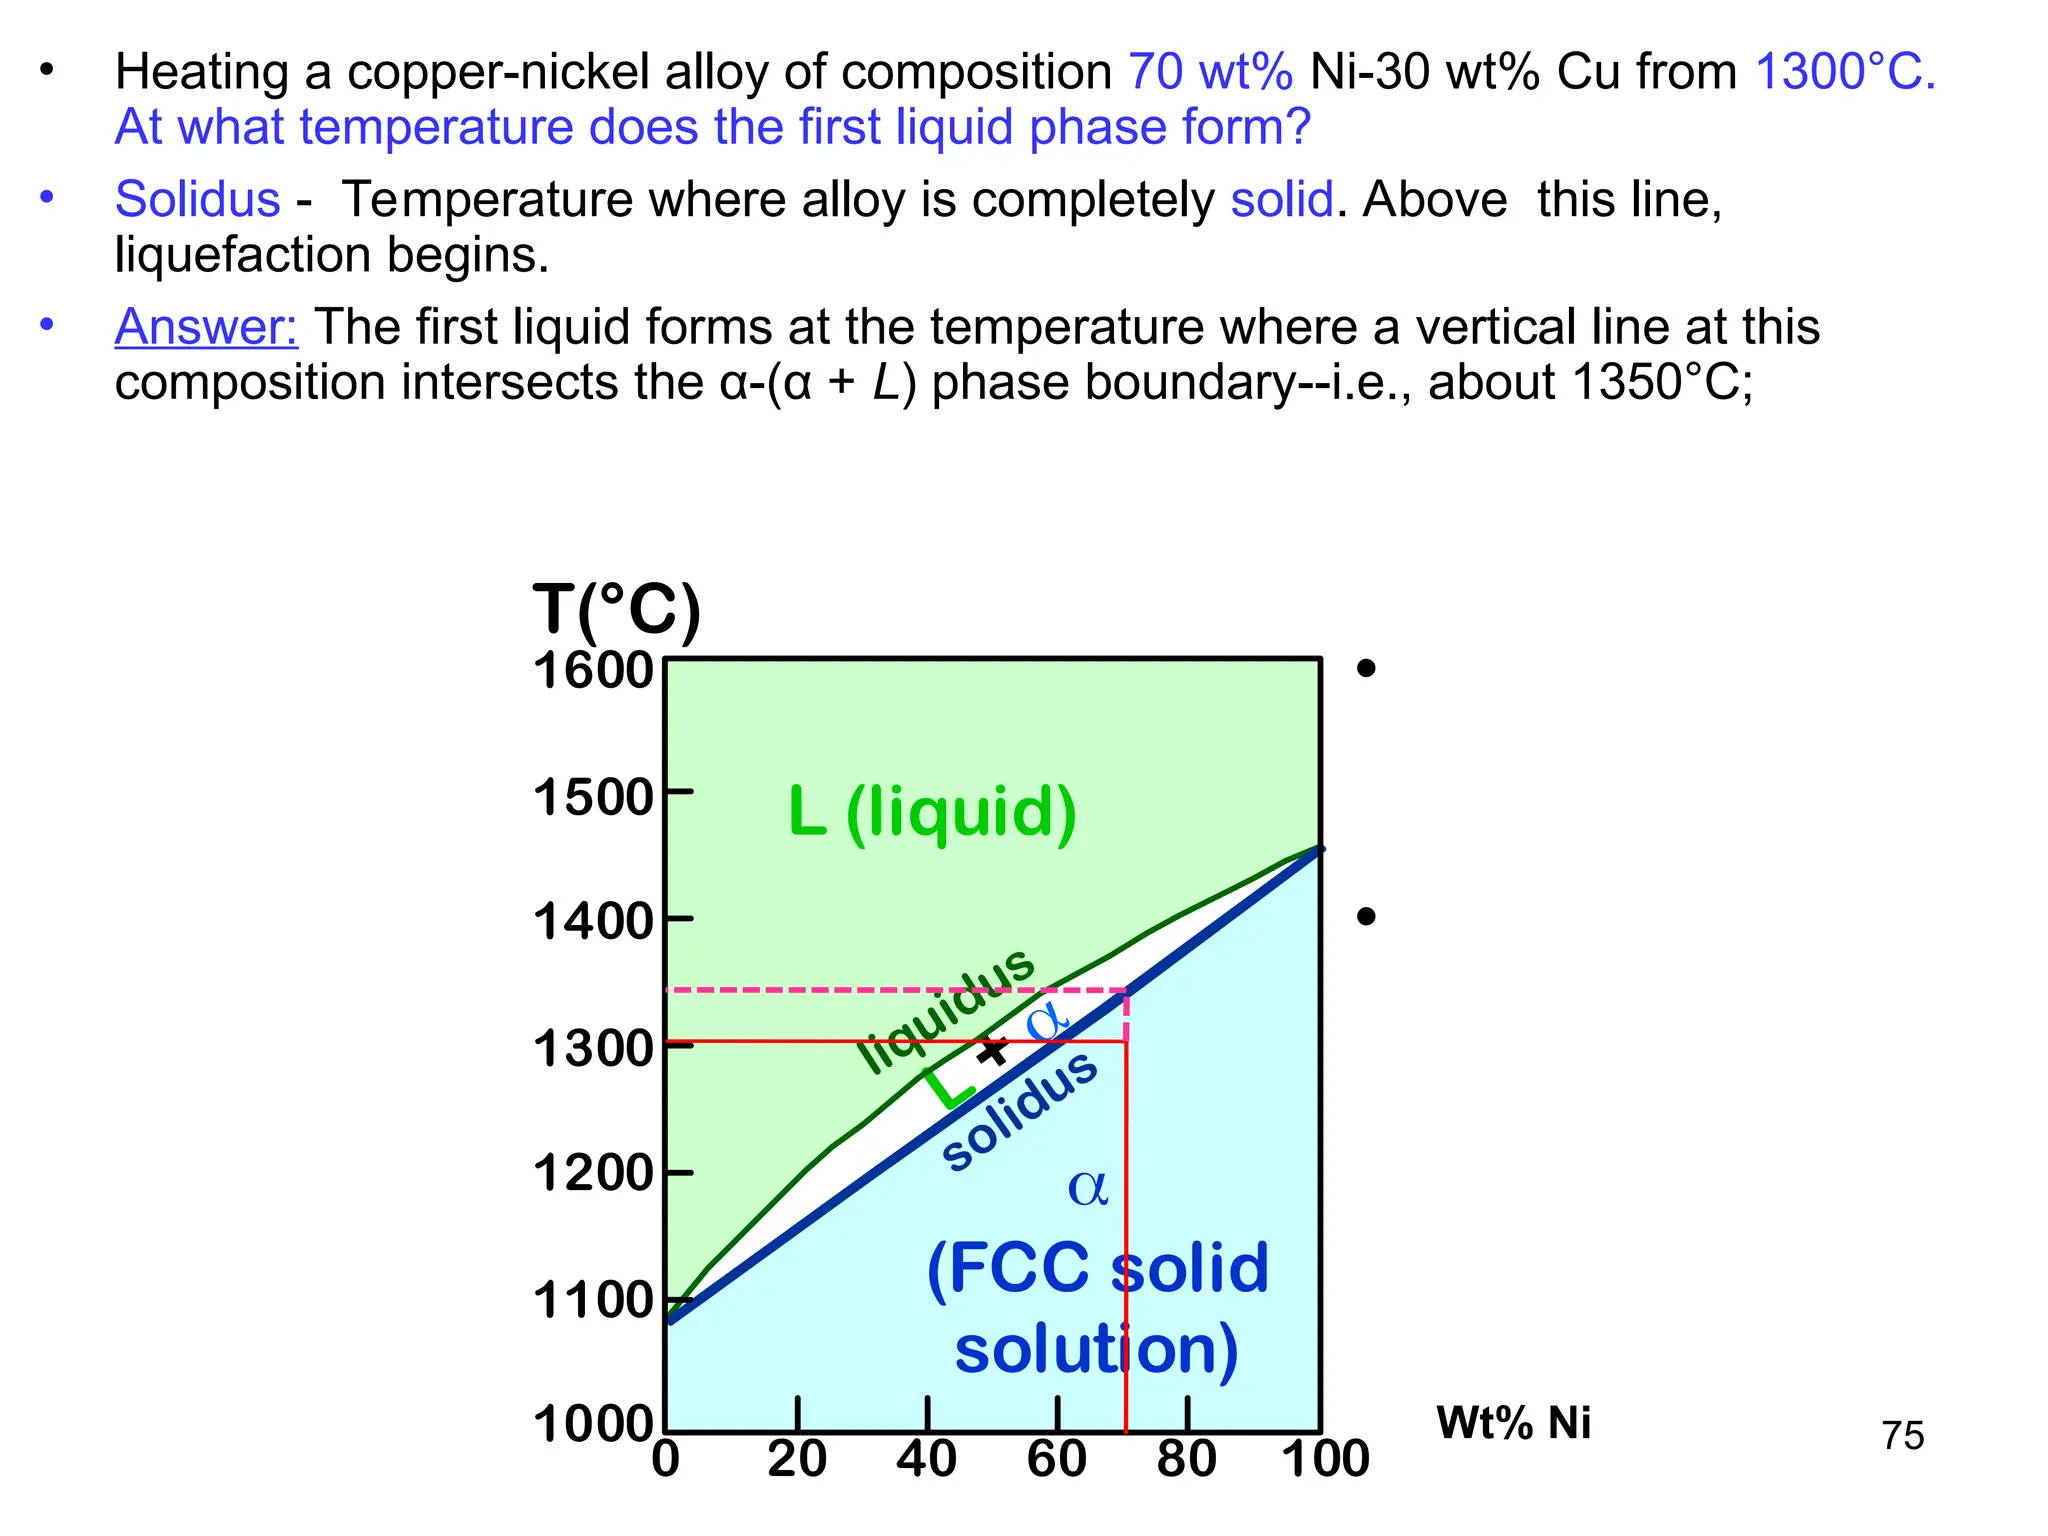
Phase Diagrams
Chapter 10
Chapter 10 (part 1)
• Introduction
• Solubility Limits
• Phases
• Phase Equilibrium
• Interpretation of Phase Diagrams
• Binary Isomorphous Systems (Cu-Ni)
• Development of Microstructure
• Mechanical Properties
• Binary Eutectic Systems
• Development of Eutectic Alloy Microstructure
3
• Components:
The elements or compounds that are mixed initially (Al and Cu).
• Phases:
A phase is a homogenous, physically distinct and mechanically
separable portion of the material with a given chemical composition
and structure ( and ).

(darker
phase)
 (lighter
phase)
Components and Phases
Aluminum-
Copper
Alloy
Phase Equilibria: Solubility Limit
• Solution – solid, liquid, or gas solutions, single phase
• Mixture – more than one phase
Question: What is the
solubility limit for sugar in
water at 20°C?
Answer: 65 wt% sugar.
At 20°C, if C < 65 wt% sugar: syrup
At 20°C, if C > 65 wt% sugar: syrup + sugar
65
• Solubility Limit:
Maximum concentration for
which only a single phase
solution exists.
Sugar/Water Phase Diagram
Sugar
Temperature
(°C)
0 20 40 60 80 100
C = Composition (wt% sugar)
L
(liquid solution
i.e., syrup)
Solubility
Limit L
(liquid)
+
S
(solid
sugar)
20
40
60
80
100
Water
5
Equilibrium
• A system is at equilibrium if its free energy is at
a minimum, given a specified combination of
temperature, pressure and composition.
• The (macroscopic) characteristics of the system
do not change with time — the system is stable.
• A change in T, P or C for the system will result in
an increase in the free energy and possible
changes to another state whereby the free
energy is lowered.
One Component Phase Diagram
6
7
Phase Diagrams
• Indicate phases as a function of Temp, Comp and Pressure.
• Focus on:
- binary systems: 2 components.
- independent variables: T and C (P = 1 atm is almost always used).
Cu-Ni
system
• 2 phases:
L (liquid)
 (FCC solid solution)
• 3 different phase fields:
L
L + 

wt% Ni
20 40 60 80 100
0
1000
1100
1200
1300
1400
1500
1600
T(°C)
L (liquid)

(FCC solid
solution)
L
+

liquidus
solidus
8
• Changing T can change # of phases: path A to B.
• Changing Co can change # of phases: path B to D.
Effect of Temperature & Composition (Co)
wt% Ni
20 40 60 80 100
0
1000
1100
1200
1300
1400
1500
1600
T(°C)
L (liquid)

(FCC solid solution)
L
+
liquidus
solidus
A
B D
Cu
Cu-Ni
system
9
• Rule 1: If we know T and Co, then we know:
--how many phases and which phases are present.
• Examples:
wt% Ni
20 40 60 80 100
0
1000
1100
1200
1300
1400
1500
1600
T(°C)
L (liquid)

(FCC solid
solution)
L + 
liquidus
solidus
A(1100,60)
B(1250,35)
Cu-Ni
phase
diagram
A(1100, 60):
1 phase: 
B(1250, 35):
2 phases: L + 
Determination of phase(s) present
Melting points: Cu =
1085°C, Ni = 1453 °C
Solidus - Temperature where alloy is completely solid. Above this line, liquefaction begins.
Liquidus - Temperature where alloy is completely liquid. Below this line, solidification
begins.
10
• Rule 2: If we know T and Co, then we know:
--the composition of each phase.
• Examples:
wt% Ni
20
1200
1300
T(°C)
L (liquid)

(solid)
L + 
liquidus
solidus
30 40 50
TA
A
D
TD
TB
B
tie line
L + 
43
35
32
Co
CL C
Cu-Ni
system
Phase Diagrams: composition of phases
At TA
= 1320°C:
Only Liquid (L) present
CL = C0
( = 35 wt% Ni)
At TB
= 1250°C:
Both

and L present
At TD
= 1190°C:
Only Solid () present
C = C0 ( = 35 wt% Ni)
CL
= Cliquidus ( = 32 wt% Ni)
C = Csolidus ( = 43 wt% Ni)
11
• Rule 3: If we know T and Co, then we know:
--the amount of each phase (given in wt%).
Cu-Ni system
• Examples:
At TB: Both  and L
At TA: Only Liquid (L)
WL = 100wt%, W = 0
At TD: Only Solid ()
WL = 0, W = 100wt%
Co = 35wt%Ni
wt% Ni
20
1200
1300
T(°C)
L (liquid)

(solid)
L + 
liquidus
solidus
30 40 50
TA
A
D
TD
TB
B
tie line
L + 
43
35
32
Co
CL C
R S
Phase Diagrams: weight fractions of phases
WL 
S
R S
W 
R
R S

43  35
43  32
73wt%  R
R S
 S
R  S
WL
C  Co
C  CL
= 27wt %
 R
R S
W 
Co  CL
C  CL
WL 
S
R S
W 
R
R S
12
wt% Ni
20
1200
1300
30 40 50
1100
L (liquid)

(solid)
L +

L +

T(°C)
A
35
C0
L: 35wt%Ni
Cu-Ni
system
• Phase diagram:
Cu-Ni system.
• Consider
microstuctural
changes that
accompany the
cooling of a
C0 = 35 wt% Ni alloy
Ex: Equilibrium Cooling of a Cu-Ni Alloy
46
35
43
32
: 43 wt% Ni
L: 32 wt% Ni
B
: 46 wt% Ni
L: 35 wt% Ni
C
E
L: 24 wt% Ni
: 36 wt% Ni
24 36
D
• Development of
microstructure during
the non-equilibrium
solidification of a 35 wt
% Ni-65 wt% Cu alloy
outcome:
• Segregation-
nonuniform distribution
of elements within
grains.
• Weaker grain
boundaries if alloy is
reheated.
• C changes as it solidifies.
• Cu-Ni case:
• Fast rate of cooling:
Cored structure
• Slow rate of cooling:
Equilibrium structure
First  to solidify has C = 46wt%Ni.
Last  to solidify has C = 35wt%Ni.
First  to solidfy:
46wt%Ni
Uniform C:
35wt%Ni
Last to solidfy:
< 35wt%Ni
Cored vs Equilibrium Phases
• Coring can be eliminated by means of a homogenization heat treatment carried out at
temperatures below the alloy’s solidus. During the process, atomic diffusion produces grains
that are compositionally homogeneous.
15
• Effect of solid solution strengthening on:
--Tensile strength (TS) --Ductility (%EL,%AR)
--Peak as a function of Co --Min. as a function of Co
Mechanical Properties: Cu-Ni System
Elongation
(%EL) Composition, wt%Ni
Cu Ni
0 20 40 60 80 100
20
30
40
50
60
%EL for
pure Ni
%EL for pure Cu
Tensile
Strength
(MPa)
Composition, wt%Ni
Cu Ni
0 20 40 60 80 100
200
300
400
TS for
pure Ni
TS for pure Cu
16
Binary Isomorphous Systems
Cu-Ni system:
• The liquid L is a homogeneous liquid solution composed of
Cu and Ni.
• The α phase is a substitutional solid solution consisting of
Cu and Ni atoms with an FCC crystal structure.
• At temperatures below 1080 C, Cu and Ni are mutually
soluble in each other in the solid state for all compositions.
• The complete solubility is explained by their FCC structure,
nearly identical atomic radii and electro-negativities, and
similar valences.
• The Cu-Ni system is termed isomorphous because of this
complete liquid and solid solubility of the 2 components.
17
18
Criteria for Solid Solubility
Crystal
Structure electroneg r (nm)
Ni FCC 1.9 0.1246
Cu FCC 1.8 0.1278
• Both have the same crystal structure (FCC) and have
similar electronegativities and atomic radii (W. Hume –
Rothery rules) suggesting high mutual solubility.
Simple system (e.g., Ni-Cu solution)
• Ni and Cu are totally soluble in one another for all proportions.
19
Cu-Ni
phase
diagram
Isomorphous Binary Phase Diagram
• Phase diagram:
Cu-Ni system.
• System is:
-- binary
2 components:
Cu and Ni.
-- isomorphous
i.e., complete
solubility of one
component in
another;  phase
field extends from
0 to 100 wt% Ni.
wt% Ni
20 40 60 80 100
0
1000
1100
1200
1300
1400
1500
1600
T(°C)
L (liquid)

(FCC solid
solution)
L
+

liquidus
solidus
20
Importance of Phase Diagrams
• There is a strong correlation between
microstructure and mechanical properties,
and the development of alloy
microstructure is related to the
characteristics of its phase diagram.
• Phase diagrams provide valuable
information about melting, casting,
crystallization and other phenomena.
21
Microstructure
• In metal alloys, microstructure is
characterized by the number of phases,
their proportions, and the way they are
arranged.
• The microstructure depends on:
– Alloying elements
– Concentration
– Heat treatment (temperature, time, rate of
cooling)
22
Eutectic
• A eutectic or eutectic mixture is a mixture of two or
more phases at a composition that has the lowest
melting point.
• It is where the phases simultaneously crystallize from
molten solution.
• The proper ratios of phases to obtain a eutectic is
identified by the eutectic point on a binary phase
diagram.
• The term comes from the Greek 'eutektos', meaning
'easily melted.‘
23
• The phase diagram displays a simple binary system composed of two components, A and B,
which has a eutectic point.
• The phase diagram plots relative concentrations of A and B along the X-axis, and
temperature along the Y-axis. The eutectic point is the point where the liquid phase
borders directly on the solid α + β phase; it represents the minimum melting temperature
of any possible A B alloy.
• The temperature that corresponds to this point is known as the eutectic temperature.
• Not all binary system alloys have a eutectic point: those that form a solid solution at all
concentrations, such as the gold-silver system, have no eutectic. An alloy system that has a
eutectic is often referred to as a eutectic system, or eutectic alloy.
• Solid products of a eutectic transformation can often be identified by their lamellar structure,
as opposed to the dendritic structures commonly seen in non-eutectic solidification. The
same conditions that force the material to form lamellae can instead form an amorphous solid
if pushed to an extreme.
24
2 components
has a special composition
with a min. melting T.
Binary-Eutectic Systems
• 3 single phase regions
(L, , )
• Limited solubility:
: mostly Cu
: mostly Ag
• TE : No liquid below TE
: Composition at
temperature TE
• CE
Cu-Ag system
L (liquid)
 L + 
L+


C , wt% Ag
20 40 60 80 100
0
200
1200
T(°C)
400
600
800
1000
CE
TE
8.0 71.9 91.2
779°C
Ag)
wt%
1.2
9
(
Ag)
wt%
.0
8
(
Ag)
wt%
9
.
71
( 


L
cooling
heating
• Eutectic reaction
L(CE) (CE) + (CE)
Copper-Silver Phase Diagram
26
Eutectic Reaction
• An isothermal, reversible reaction between two (or more)
solid phases during the heating of a system where a
single liquid phase is produced.
Eutectic reaction
L(CE) (CE) + (CE)
Ag)
wt%
1.2
9
(
Ag)
wt%
.0
8
(
Ag)
wt%
9
.
71
( 


L
cooling
heating
• Solvus – (solid solubility line) BC, GH
• Solidus – AB, FG, BEG (eutectic isotherm)
• Liquidus – AEF
• Maximum solubility: α = 8.0 wt% Ag, β = 8.8 wt %Cu
• Invariant point (where 3 phases are in equilibrium) is at E;
CE = 71.9 wt% Ag, TE = 779C (1434F).
Pb-Sn Phase Diagram
Liquidus
Solidus
Solidus
Solidus
Solvus Solvus
28
Solidification of Eutectic Mixtures
• Mixtures of some metals, such as copper & nickel, are completely
soluble in both liquid and solid states for all concentrations of both
metals. Copper & nickel have the same crystal structure (FCC) and
have nearly the same atomic radii. The solid formed by cooling can
have any proportion of copper & nickel. Such completely miscible
mixtures of metals are called isomorphous.
• By contrast, a mixture of lead & tin that is eutectic is only partially
soluble when in the solid state. Lead & tin have different crystal
structures (FCC versus BCT) and lead atoms are much larger. No
more than 18.3 weight % solid tin can dissolve in solid lead and no
more than 2.2% of solid lead can dissolve in solid tin (according to
previous phase diagram).
• The solid lead-tin alloy consists of a mixture of two solid phases,
one consisting of a maximum of 18.3 wt% tin (the alpha phase) and
one consisting of a maximum of 2.2 wt% lead (the beta phase).
29
L + 
L+
 + 
200
T(°C)
18.3
C, wt% Sn
20 60 80 100
0
300
100
L (liquid)

183°C
61.9 97.8

• For a 40 wt% Sn-60 wt% Pb alloy at 150°C, determine:
-- the phases present Pb-Sn
system
(Ex 1) Pb-Sn Eutectic System
Answer: +
 -- the phase compositions
-- the relative amount
of each phase
150
40
C0
11
C
99
C
Answer: C = 11 wt% Sn
C = 99 wt% Sn
W

=
C - C0
C - C
=
99 - 40
99 - 11
=
59
88
= 0.67
W

C0 - C
C - C
=
=
29
88
= 0.33
=
40 - 11
99 - 11
Answer:
30
Answer: C = 17 wt% Sn
-- the phase compositions
L+
 + 
200
T(°C)
C, wt% Sn
20 60 80 100
0
300
100
L (liquid)


L + 
183°C
• For a 40 wt% Sn-60 wt% Pb alloy at 220°C, determine:
-- the phases present:
(Ex 2) Pb-Sn Eutectic System
-- the relative amount
of each phase
W =
CL - C0
CL - C
=
46 - 40
46 - 17
=
6
29
= 0.21
WL =
C0 - C
CL - C
=
23
29
= 0.79
40
C0
46
CL
17
C
220
Answer: + L
CL = 46 wt% Sn
Answer:
31
Pb-Sn
• For lead & tin the eutectic composition is
61.9 wt% tin and the eutectic temperature
is 183ºC -- which makes this mixture
useful as solder.
• At 183ºC, compositions of greater than
61.9 wt% tin result in precipitation of a tin-
rich solid in the liquid mixture, whereas
compositions of less than 61.9 wt% tin
result in precipitation of lead-rich solid.
32
• For alloys where
C0 < 2 wt% Sn
• Result at room temperature is
a polycrystalline with grains of 
phase having composition C0
Microstructural Developments
in Eutectic Systems - I
0
L+ 
200
T(°C)
C, wt% Sn
10
2
20
C0
300
100
L

30
+
400
(room T solubility limit)
TE

L
L: C0 wt% Sn
: C0 wt% Sn
Pb-Sn
system
33
2 wt% Sn < C0 < 18.3 wt% Sn
• Results in polycrystalline
microstructure with  grains
and small -phase particles at
lower temperatures.
Microstructural Developments
in Eutectic Systems - II
L + 
200
T(°C)
C, wt% Sn
10
18.3
20
0
C0
300
100
L

30
+ 
400
(sol. limit at TE)
TE
2
(sol. limit at Troom)
L

L: C0 wt% Sn


: C0 wt% Sn
Pb-Sn
system
Microstructures in Eutectic Systems - III
Pb-Sn
system
• Co = CE
• Results in a
eutectic
microstructure
with alternating
layers of  and
 crystals.
Sn)
wt%
7.8
9
(
Sn)
wt%
.3
8
(1
Sn)
wt%
9
.
61
( 
 
L
cooling
heating
35
Lamellar Eutectic Structure
A 2-phase microstructure
resulting from the
solidification of a liquid
having the eutectic
composition where the
phases exist as a lamellae
that alternate with one
another.
Formation of eutectic
layered microstructure in
the Pb-Sn system during
solidification at the eutectic
composition. Compositions
of α and β phases are very
different. Solidification
involves redistribution of
Pb and Sn atoms by
atomic diffusion.
Pb-rich
Sn-rich
36
Pb-Sn Microstructures
The dark layers are Pb-rich α
phase, the light layers are the Sn-
rich β phase.
37/57
Ni-Al
Pb-Sn
Copper phosphorus eutectic
20mol% CeO2-80mol% CoO.
Ir-Si
38
• For alloys with18.3 wt% Sn < C0 < 61.9 wt% Sn
• Result:  phase particles and a eutectic microconstituent
Microstructures in Eutectic Systems - IV
18.3 61.9 97.8
eutectic 
eutectic 
WL = (1- W) = 0.50
C = 18.3 wt% Sn
CL = 61.9 wt% Sn
W = = 0.50
• Just above TE :
• Just below TE :
C

= 18.3 wt% Sn
C

= 97.8 wt% Sn
W

= = 0.727
W

= 0.273 wt% Sn
Pb-Sn
system
L+

200
T(°C)
C, wt% Sn
20 60 80 100
0
300
100
L
 
L+

40

+

TE
L: C0
wt% Sn L

L

CL - C0
CL - C
Cβ - C0
Cβ - C
Primary α
39
Chapter 10 (part 2)
• Equilibrium Diagrams with Intermediate Phases
or Compounds
• Eutectoid and Peritectic Reactions
• Ceramic Phase Diagrams
• The Gibbs Phase Rule
• The Iron-Iron Carbide Phase Diagram
• Development of Microstructures in Iron-Carbon
Alloys
• Hypoeutectoid Alloys
• Hypereutectoid Alloys
• Influence of Other Alloying Elements
40
Intermetallic Compounds
Mg2Pb
Note: intermetallic compounds exist as a line on the diagram - not a
phase region. The composition of a compound has a distinct chemical
formula.
19 wt% Mg-81 wt% Pb
Cu-Zn System (Brass)
Cartridge brass:
70 wt% Cu
42
Eutectoid & Peritectic
Cu-Zn Phase diagram
Eutectoid transformation   + 
Peritectic transformation  + L 
43
• Eutectoid – one solid phase transforms to two other solid phases
Solid1 ↔ Solid2 + Solid3
  + Fe3C (For Fe-C, 727C, 0.76 wt% C)
Eutectic, Eutectoid, & Peritectic
• Eutectic - liquid transforms to two solid phases
L  +  (For Pb-Sn, 183C, 61.9 wt% Sn)
cool
heat
• Peritectic - liquid and one solid phase transform to a 2nd solid phase
Solid1 + Liquid ↔ Solid2
 + L ε (For Cu-Zn, 598°C, 78.6 wt% Zn)
cool
heat
cool
heat
44
45
Ceramic Phase Diagrams
MgO-Al2O3 diagram:

46
• Need a material to use in high temperature furnaces.
• Consider Silica (SiO2) - Alumina (Al2O3) system.
• Phase diagram shows: mullite, alumina and crystobalite (made up
of SiO2) are candidate refractories.
Composition (wt% alumina)
T(°C)
1400
1600
1800
2000
2200
20 40 60 80 100
0
alumina
+
mullite
mullite
+ L
mullite
Liquid
(L)
mullite
+ crystobalite
crystobalite
+ L
alumina + L
3Al2O3-2SiO2
APPLICATION: REFRACTORIES
47
Ceramic Phases and Cements
48
Gibbs Phase Rule
• Phase diagrams and phase equilibria are subject to the laws of thermodynamics.
• Gibbs phase rule is a criterion that determines how many phases can coexist within a
system at equilibrium.
P + F = C + N
P: # of phases present
F: degrees of freedom (temperature, pressure, composition)
C: components or compounds
N: noncompositional variables
For the Cu-Ag system @ 1 atm for a single phase P:
N=1 (temperature), C = 2 (Cu-Ag), P= 1 (, L)
F = 2 + 1 – 1= 2
This means that to characterize the alloy within a single phase
field, 2 parameters must be given: temperature and composition.
If 2 phases coexist, for example, L L, then according to GPR, we have 1
degree of freedom: F = 2 + 1 – 2= 1. So, if we have Temp or composition, then we can
completely define the system.
If 3 phases exist (for a binary system), there are 0 degrees of freedom. This means the
composition and Temp are fixed. This condition is met for a eutectic system by the
eutectic isotherm.
49
Iron-Carbon System
• Pure iron when heated experiences 2
changes in crystal structure before it
melts.
• At room temperature the stable form,
ferrite ( iron) has a BCC crystal
structure.
• Ferrite experiences a polymorphic
transformation to FCC austenite ( iron)
at 912 ˚C (1674 ˚F).
• At 1394˚C (2541˚F) austenite reverts
back to BCC phase  ferrite and melts at
1538 ˚C (2800 ˚F).
• Iron carbide (cementite or Fe3C) an
intermediate compound is formed at 6.7
wt% C.
• Typically, all steels and cast irons have
carbon contents less than 6.7 wt% C.
• Carbon is an interstitial impurity in iron
and forms a solid solution with the
phases
Iron-Carbon System
Though carbon is present in relatively low concentrations, it
significantly influences the mechanical properties of ferrite: (a) α
ferrite, (b) austenite.
4 Solid Phases
Iron carbide (Cementite or Fe3C)
• Forms when the solubility limit of carbon in 
ferrite is exceeded at temperatures below
727 ˚C.
• Mechanically, cementite is very hard and
brittle.
• For ferrous alloys there are 3 basic types,
based on carbon content:
 Iron (ferrite phase): <0.008 wt% C room temp
 Steel ( + Fe3C phase): 0.008 to 2.14 wt% C
 Cast iron: 2.14 to 6.70 wt% C
53
54
Iron-Carbon (Fe-C) Phase Diagram
• 2 important points
- Eutectoid (B):
  +Fe3C
- Eutectic (A):
L ↔
+Fe3C
Fe
3
C
(cementite)
1600
1400
1200
1000
800
600
400
0 1 2 3 4 5 6 6.7
L

(austenite)
+L
+Fe3C
+Fe3C

+


(Fe) C, wt% C
1148°C
T(°C)
 727°C = Teutectoid
4.30
Result: Pearlite =
alternating layers of
 and Fe3C phases,
not a separate phase.
120 m
0.76
B
 


A
L+Fe3C
Fe3C (cementite-hard)
 (ferrite-soft)
↔
Pearlite
Eutectoid reaction:

↔
 + Fe3C
Austenite – 0.76 wt% C
Ferrite - 0.022 wt% C
Cementite - 6.70 wt% C
Redistribution of carbon by diffusion
Fe
3
C
(cementite)
1600
1400
1200
1000
800
600
400
0 1 2 3 4 5 6 6.7
L

(austenite)
 +L
 + Fe3C
 + Fe3C
L+Fe3C

(Fe) C, wt% C
1148°C
T(°C)

727°C
C0
0.76
Hypoeutectoid Steel

 




W =
W =(1 - W)

pearlite
pearlite =  + Fe3C
W’ =
W = (1 – W’)
pearlite
Microstructures for iron-iron carbide alloys that are below
the eutectoid with compositions between 0.022 and 0.76
wt% Carbon are hypoeutectoid.
C - C0
C - C
CFe3C - C0
CFe3C - C
57
Fe
3
C
(cementite)
1600
1400
1200
1000
800
600
400
0 1 2 3 4 5 6 6.7
L

(austenite)
+L
 + Fe3C
+ Fe3C
L+Fe3C

(Fe) C, wt% C
1148°C
T(°C)

727°C
C0
0.76
Hypoeutectoid Steel

pearlite

 






 
 


58
Proeutectoid
• Formed before the eutectoid
• Ferrite that is present in the pearlite is called eutectoid ferrite.
• The ferrite that is formed above the Teutectoid (727°C) is proeutectoid.
59
Fe
3
C
(cementite)
1600
1400
1200
1000
800
600
400
0 1 2 3 4 5 6 6.7
L

(austenite)
+L
 +Fe3C
 +Fe3C
L+Fe3C

(Fe) C, wt%C
1148°C
T(°C)

Hypereutectoid Steel
0.76
C0
pearlite
Fe3C


 
x
v
V X
Wpearlite = W
W = X/(V +X)
W =(1 - W)
Fe3C’
W =(1-W)
W =x/(v + x)
Fe3C
Microstructures for iron-iron carbide alloys that have
compositions between 0.76 and 2.14 wt% carbon are
hypereutectoid (more than eutectoid).
61
Hypereutectoid Steel
Fe
3
C
(cementite)
1600
1400
1200
1000
800
600
400
0 1 2 3 4 5 6 6.7
L

(austenite)
+L
 +Fe3C
 +Fe3C
L+Fe3C

(Fe) C, wt%C
1148°C
T(°C)

0.76
C0
Fe3C


 


 


 
pearlite
Hypereutectoid Steel (1.2 wt% C)
Proeutectoid: formed above the Teutectoid (727°C)
pearlite
63
L+
L+
 + 
200
C, wt% Sn
20 60 80 100
0
300
100
L
 
TE
40
(Pb-Sn
System)
Hypoeutectic & Hypereutectic
160 m
eutectic micro-constituent
hypereutectic: (illustration only)






175 m






hypoeutectic: C0 = 50 wt% Sn
T(°C)
61.9
eutectic
eutectic: C0 =61.9wt% Sn
64
65
Example Problem
For a 99.6 wt% Fe-0.40 wt
% C steel at a
temperature just below
the eutectoid,
determine the
following:
a) The compositions of
Fe3C and ferrite ().
b) The amount of
cementite (in grams)
that forms in 100 g of
steel.
66
Solution to Example Problem
WFe3C 
R
R S

C0  C
CFe3C  C

0.40  0.022
6.70  0.022
0.057
b) Using the lever rule with
the tie line shown
a) Using the RS tie line just below the eutectoid
C = 0.022 wt% C
CFe3C = 6.70 wt% C
Fe
3
C
(cementite)
1600
1400
1200
1000
800
600
400
0 1 2 3 4 5 6 6.7
L

(austenite)
+L
 + Fe3C
 + Fe3C
L+Fe3C

C, wt% C
1148°C
T(°C)
727°C
C0
R S
CFe C
3
C
Amount of Fe3C in 100 g
= (100 g)WFe3C
= (100 g)(0.057) = 5.7 g
67
Alloying steel with other elements changes the Eutectoid
Temperature, Position of phase boundaries and relative
Amounts of each phase
68
69
Cooling Curves
70
71
72
73
• Phase diagrams are useful tools to determine:
-- the number and types of phases present,
-- the composition of each phase,
-- and the weight fraction of each phase
For a given temperature and composition of the system.
• The microstructure of an alloy depends on
-- its composition, and
-- rate of cooling equilibrium
Summary
74
Review
75
• Heating a copper-nickel alloy of composition 70 wt% Ni-30 wt% Cu from 1300°C.
At what temperature does the first liquid phase form?
• Solidus - Temperature where alloy is completely solid. Above this line,
liquefaction begins.
• Answer: The first liquid forms at the temperature where a vertical line at this
composition intersects the α-(α + L) phase boundary--i.e., about 1350°C;
• 2 phases:
L (liquid)
 (FCC solid solution)
• 3 phase fields:
L
L + 

wt% Ni
20 40 60 80 100
0
1000
1100
1200
1300
1400
1500
1600
T(°C)
L (liquid)

(FCC solid
solution)
L + 
liquidus
solidus
Wt% Ni
76
• (b) What is the composition of this liquid phase?
• Answer: The composition of this liquid phase corresponds to the
intersection with the (α + L)-L phase boundary, of a tie line
constructed across the α + L phase region at 1350°C, 59 wt% Ni;
Wt% Ni
• 2 phases:
L (liquid)
 (FCC solid solution)
• 3 phase fields:
L
L + 

wt% Ni
20 40 60 80 100
0
1000
1100
1200
1300
1400
1500
1600
T(°C)
L (liquid)

(FCC solid
solution)
L + 
liquidus
solidus
77
• (c) At what temperature does complete melting of the alloy occur?
• Liquidus - Temperature where alloy is completely liquid. Below this line, solidification
begins.
• Answer: Complete melting of the alloy occurs at the intersection of this same vertical line
at 70 wt% Ni with the (α + L)-L phase boundary--i.e., about 1380°C;
• 2 phases:
L (liquid)
 (FCC solid solution)
• 3 phase fields:
L
L + 

wt% Ni
20 40 60 80 100
0
1000
1100
1200
1300
1400
1500
1600
T(°C)
L (liquid)

(FCC solid
solution)
Wt% Ni
78
• (d) What is the composition of the last solid remaining prior to complete melting?
• Answer: The composition of the last solid remaining prior to complete melting
corresponds to the intersection with α-(α + L) phase boundary, of the tie line
constructed across the α + L phase region at 1380°C--i.e., about 78 wt% Ni.
• 2 phases:
L (liquid)
 (FCC solid solution)
• 3 phase fields:
L
L + 

wt% Ni
20 40 60 80 100
0
1000
1100
1200
1300
1400
1500
1600
T(°C)
L (liquid)

(FCC solid
solution)
Wt% Ni
• Sum of weight fractions:
9
• Conservation of mass (Ni):
• Combine above equations:
WL  W 1
Co WLCL  WC
 R
R S
W 
Co  CL
C  CL
 S
R  S
WL
C  Co
C  CL
• A geometric interpretation:
Co
R S
W
WL
CL C
moment equilibrium:
1 W
solving gives Lever Rule
WLR WS
THE LEVER RULE: A PROOF

ch10-Phase_Diagramsbsnsbbbsbsbsbbwbwbwb.ppt

  • 1.
  • 2.
    Chapter 10 (part1) • Introduction • Solubility Limits • Phases • Phase Equilibrium • Interpretation of Phase Diagrams • Binary Isomorphous Systems (Cu-Ni) • Development of Microstructure • Mechanical Properties • Binary Eutectic Systems • Development of Eutectic Alloy Microstructure
  • 3.
    3 • Components: The elementsor compounds that are mixed initially (Al and Cu). • Phases: A phase is a homogenous, physically distinct and mechanically separable portion of the material with a given chemical composition and structure ( and ).  (darker phase)  (lighter phase) Components and Phases Aluminum- Copper Alloy
  • 4.
    Phase Equilibria: SolubilityLimit • Solution – solid, liquid, or gas solutions, single phase • Mixture – more than one phase Question: What is the solubility limit for sugar in water at 20°C? Answer: 65 wt% sugar. At 20°C, if C < 65 wt% sugar: syrup At 20°C, if C > 65 wt% sugar: syrup + sugar 65 • Solubility Limit: Maximum concentration for which only a single phase solution exists. Sugar/Water Phase Diagram Sugar Temperature (°C) 0 20 40 60 80 100 C = Composition (wt% sugar) L (liquid solution i.e., syrup) Solubility Limit L (liquid) + S (solid sugar) 20 40 60 80 100 Water
  • 5.
    5 Equilibrium • A systemis at equilibrium if its free energy is at a minimum, given a specified combination of temperature, pressure and composition. • The (macroscopic) characteristics of the system do not change with time — the system is stable. • A change in T, P or C for the system will result in an increase in the free energy and possible changes to another state whereby the free energy is lowered.
  • 6.
  • 7.
    7 Phase Diagrams • Indicatephases as a function of Temp, Comp and Pressure. • Focus on: - binary systems: 2 components. - independent variables: T and C (P = 1 atm is almost always used). Cu-Ni system • 2 phases: L (liquid)  (FCC solid solution) • 3 different phase fields: L L +   wt% Ni 20 40 60 80 100 0 1000 1100 1200 1300 1400 1500 1600 T(°C) L (liquid)  (FCC solid solution) L +  liquidus solidus
  • 8.
    8 • Changing Tcan change # of phases: path A to B. • Changing Co can change # of phases: path B to D. Effect of Temperature & Composition (Co) wt% Ni 20 40 60 80 100 0 1000 1100 1200 1300 1400 1500 1600 T(°C) L (liquid)  (FCC solid solution) L + liquidus solidus A B D Cu Cu-Ni system
  • 9.
    9 • Rule 1:If we know T and Co, then we know: --how many phases and which phases are present. • Examples: wt% Ni 20 40 60 80 100 0 1000 1100 1200 1300 1400 1500 1600 T(°C) L (liquid)  (FCC solid solution) L +  liquidus solidus A(1100,60) B(1250,35) Cu-Ni phase diagram A(1100, 60): 1 phase:  B(1250, 35): 2 phases: L +  Determination of phase(s) present Melting points: Cu = 1085°C, Ni = 1453 °C Solidus - Temperature where alloy is completely solid. Above this line, liquefaction begins. Liquidus - Temperature where alloy is completely liquid. Below this line, solidification begins.
  • 10.
    10 • Rule 2:If we know T and Co, then we know: --the composition of each phase. • Examples: wt% Ni 20 1200 1300 T(°C) L (liquid)  (solid) L +  liquidus solidus 30 40 50 TA A D TD TB B tie line L +  43 35 32 Co CL C Cu-Ni system Phase Diagrams: composition of phases At TA = 1320°C: Only Liquid (L) present CL = C0 ( = 35 wt% Ni) At TB = 1250°C: Both  and L present At TD = 1190°C: Only Solid () present C = C0 ( = 35 wt% Ni) CL = Cliquidus ( = 32 wt% Ni) C = Csolidus ( = 43 wt% Ni)
  • 11.
    11 • Rule 3:If we know T and Co, then we know: --the amount of each phase (given in wt%). Cu-Ni system • Examples: At TB: Both  and L At TA: Only Liquid (L) WL = 100wt%, W = 0 At TD: Only Solid () WL = 0, W = 100wt% Co = 35wt%Ni wt% Ni 20 1200 1300 T(°C) L (liquid)  (solid) L +  liquidus solidus 30 40 50 TA A D TD TB B tie line L +  43 35 32 Co CL C R S Phase Diagrams: weight fractions of phases WL  S R S W  R R S  43  35 43  32 73wt%  R R S  S R  S WL C  Co C  CL = 27wt %  R R S W  Co  CL C  CL WL  S R S W  R R S
  • 12.
    12 wt% Ni 20 1200 1300 30 4050 1100 L (liquid)  (solid) L +  L +  T(°C) A 35 C0 L: 35wt%Ni Cu-Ni system • Phase diagram: Cu-Ni system. • Consider microstuctural changes that accompany the cooling of a C0 = 35 wt% Ni alloy Ex: Equilibrium Cooling of a Cu-Ni Alloy 46 35 43 32 : 43 wt% Ni L: 32 wt% Ni B : 46 wt% Ni L: 35 wt% Ni C E L: 24 wt% Ni : 36 wt% Ni 24 36 D
  • 13.
    • Development of microstructureduring the non-equilibrium solidification of a 35 wt % Ni-65 wt% Cu alloy outcome: • Segregation- nonuniform distribution of elements within grains. • Weaker grain boundaries if alloy is reheated.
  • 14.
    • C changesas it solidifies. • Cu-Ni case: • Fast rate of cooling: Cored structure • Slow rate of cooling: Equilibrium structure First  to solidify has C = 46wt%Ni. Last  to solidify has C = 35wt%Ni. First  to solidfy: 46wt%Ni Uniform C: 35wt%Ni Last to solidfy: < 35wt%Ni Cored vs Equilibrium Phases • Coring can be eliminated by means of a homogenization heat treatment carried out at temperatures below the alloy’s solidus. During the process, atomic diffusion produces grains that are compositionally homogeneous.
  • 15.
    15 • Effect ofsolid solution strengthening on: --Tensile strength (TS) --Ductility (%EL,%AR) --Peak as a function of Co --Min. as a function of Co Mechanical Properties: Cu-Ni System Elongation (%EL) Composition, wt%Ni Cu Ni 0 20 40 60 80 100 20 30 40 50 60 %EL for pure Ni %EL for pure Cu Tensile Strength (MPa) Composition, wt%Ni Cu Ni 0 20 40 60 80 100 200 300 400 TS for pure Ni TS for pure Cu
  • 16.
    16 Binary Isomorphous Systems Cu-Nisystem: • The liquid L is a homogeneous liquid solution composed of Cu and Ni. • The α phase is a substitutional solid solution consisting of Cu and Ni atoms with an FCC crystal structure. • At temperatures below 1080 C, Cu and Ni are mutually soluble in each other in the solid state for all compositions. • The complete solubility is explained by their FCC structure, nearly identical atomic radii and electro-negativities, and similar valences. • The Cu-Ni system is termed isomorphous because of this complete liquid and solid solubility of the 2 components.
  • 17.
  • 18.
    18 Criteria for SolidSolubility Crystal Structure electroneg r (nm) Ni FCC 1.9 0.1246 Cu FCC 1.8 0.1278 • Both have the same crystal structure (FCC) and have similar electronegativities and atomic radii (W. Hume – Rothery rules) suggesting high mutual solubility. Simple system (e.g., Ni-Cu solution) • Ni and Cu are totally soluble in one another for all proportions.
  • 19.
    19 Cu-Ni phase diagram Isomorphous Binary PhaseDiagram • Phase diagram: Cu-Ni system. • System is: -- binary 2 components: Cu and Ni. -- isomorphous i.e., complete solubility of one component in another;  phase field extends from 0 to 100 wt% Ni. wt% Ni 20 40 60 80 100 0 1000 1100 1200 1300 1400 1500 1600 T(°C) L (liquid)  (FCC solid solution) L +  liquidus solidus
  • 20.
    20 Importance of PhaseDiagrams • There is a strong correlation between microstructure and mechanical properties, and the development of alloy microstructure is related to the characteristics of its phase diagram. • Phase diagrams provide valuable information about melting, casting, crystallization and other phenomena.
  • 21.
    21 Microstructure • In metalalloys, microstructure is characterized by the number of phases, their proportions, and the way they are arranged. • The microstructure depends on: – Alloying elements – Concentration – Heat treatment (temperature, time, rate of cooling)
  • 22.
    22 Eutectic • A eutecticor eutectic mixture is a mixture of two or more phases at a composition that has the lowest melting point. • It is where the phases simultaneously crystallize from molten solution. • The proper ratios of phases to obtain a eutectic is identified by the eutectic point on a binary phase diagram. • The term comes from the Greek 'eutektos', meaning 'easily melted.‘
  • 23.
    23 • The phasediagram displays a simple binary system composed of two components, A and B, which has a eutectic point. • The phase diagram plots relative concentrations of A and B along the X-axis, and temperature along the Y-axis. The eutectic point is the point where the liquid phase borders directly on the solid α + β phase; it represents the minimum melting temperature of any possible A B alloy. • The temperature that corresponds to this point is known as the eutectic temperature. • Not all binary system alloys have a eutectic point: those that form a solid solution at all concentrations, such as the gold-silver system, have no eutectic. An alloy system that has a eutectic is often referred to as a eutectic system, or eutectic alloy. • Solid products of a eutectic transformation can often be identified by their lamellar structure, as opposed to the dendritic structures commonly seen in non-eutectic solidification. The same conditions that force the material to form lamellae can instead form an amorphous solid if pushed to an extreme.
  • 24.
    24 2 components has aspecial composition with a min. melting T. Binary-Eutectic Systems • 3 single phase regions (L, , ) • Limited solubility: : mostly Cu : mostly Ag • TE : No liquid below TE : Composition at temperature TE • CE Cu-Ag system L (liquid)  L +  L+   C , wt% Ag 20 40 60 80 100 0 200 1200 T(°C) 400 600 800 1000 CE TE 8.0 71.9 91.2 779°C Ag) wt% 1.2 9 ( Ag) wt% .0 8 ( Ag) wt% 9 . 71 (    L cooling heating • Eutectic reaction L(CE) (CE) + (CE)
  • 25.
  • 26.
    26 Eutectic Reaction • Anisothermal, reversible reaction between two (or more) solid phases during the heating of a system where a single liquid phase is produced. Eutectic reaction L(CE) (CE) + (CE) Ag) wt% 1.2 9 ( Ag) wt% .0 8 ( Ag) wt% 9 . 71 (    L cooling heating • Solvus – (solid solubility line) BC, GH • Solidus – AB, FG, BEG (eutectic isotherm) • Liquidus – AEF • Maximum solubility: α = 8.0 wt% Ag, β = 8.8 wt %Cu • Invariant point (where 3 phases are in equilibrium) is at E; CE = 71.9 wt% Ag, TE = 779C (1434F).
  • 27.
  • 28.
    28 Solidification of EutecticMixtures • Mixtures of some metals, such as copper & nickel, are completely soluble in both liquid and solid states for all concentrations of both metals. Copper & nickel have the same crystal structure (FCC) and have nearly the same atomic radii. The solid formed by cooling can have any proportion of copper & nickel. Such completely miscible mixtures of metals are called isomorphous. • By contrast, a mixture of lead & tin that is eutectic is only partially soluble when in the solid state. Lead & tin have different crystal structures (FCC versus BCT) and lead atoms are much larger. No more than 18.3 weight % solid tin can dissolve in solid lead and no more than 2.2% of solid lead can dissolve in solid tin (according to previous phase diagram). • The solid lead-tin alloy consists of a mixture of two solid phases, one consisting of a maximum of 18.3 wt% tin (the alpha phase) and one consisting of a maximum of 2.2 wt% lead (the beta phase).
  • 29.
    29 L +  L+ +  200 T(°C) 18.3 C, wt% Sn 20 60 80 100 0 300 100 L (liquid)  183°C 61.9 97.8  • For a 40 wt% Sn-60 wt% Pb alloy at 150°C, determine: -- the phases present Pb-Sn system (Ex 1) Pb-Sn Eutectic System Answer: +  -- the phase compositions -- the relative amount of each phase 150 40 C0 11 C 99 C Answer: C = 11 wt% Sn C = 99 wt% Sn W  = C - C0 C - C = 99 - 40 99 - 11 = 59 88 = 0.67 W  C0 - C C - C = = 29 88 = 0.33 = 40 - 11 99 - 11 Answer:
  • 30.
    30 Answer: C =17 wt% Sn -- the phase compositions L+  +  200 T(°C) C, wt% Sn 20 60 80 100 0 300 100 L (liquid)   L +  183°C • For a 40 wt% Sn-60 wt% Pb alloy at 220°C, determine: -- the phases present: (Ex 2) Pb-Sn Eutectic System -- the relative amount of each phase W = CL - C0 CL - C = 46 - 40 46 - 17 = 6 29 = 0.21 WL = C0 - C CL - C = 23 29 = 0.79 40 C0 46 CL 17 C 220 Answer: + L CL = 46 wt% Sn Answer:
  • 31.
    31 Pb-Sn • For lead& tin the eutectic composition is 61.9 wt% tin and the eutectic temperature is 183ºC -- which makes this mixture useful as solder. • At 183ºC, compositions of greater than 61.9 wt% tin result in precipitation of a tin- rich solid in the liquid mixture, whereas compositions of less than 61.9 wt% tin result in precipitation of lead-rich solid.
  • 32.
    32 • For alloyswhere C0 < 2 wt% Sn • Result at room temperature is a polycrystalline with grains of  phase having composition C0 Microstructural Developments in Eutectic Systems - I 0 L+  200 T(°C) C, wt% Sn 10 2 20 C0 300 100 L  30 + 400 (room T solubility limit) TE  L L: C0 wt% Sn : C0 wt% Sn Pb-Sn system
  • 33.
    33 2 wt% Sn< C0 < 18.3 wt% Sn • Results in polycrystalline microstructure with  grains and small -phase particles at lower temperatures. Microstructural Developments in Eutectic Systems - II L +  200 T(°C) C, wt% Sn 10 18.3 20 0 C0 300 100 L  30 +  400 (sol. limit at TE) TE 2 (sol. limit at Troom) L  L: C0 wt% Sn   : C0 wt% Sn Pb-Sn system
  • 34.
    Microstructures in EutecticSystems - III Pb-Sn system • Co = CE • Results in a eutectic microstructure with alternating layers of  and  crystals. Sn) wt% 7.8 9 ( Sn) wt% .3 8 (1 Sn) wt% 9 . 61 (    L cooling heating
  • 35.
    35 Lamellar Eutectic Structure A2-phase microstructure resulting from the solidification of a liquid having the eutectic composition where the phases exist as a lamellae that alternate with one another. Formation of eutectic layered microstructure in the Pb-Sn system during solidification at the eutectic composition. Compositions of α and β phases are very different. Solidification involves redistribution of Pb and Sn atoms by atomic diffusion. Pb-rich Sn-rich
  • 36.
    36 Pb-Sn Microstructures The darklayers are Pb-rich α phase, the light layers are the Sn- rich β phase.
  • 37.
  • 38.
    38 • For alloyswith18.3 wt% Sn < C0 < 61.9 wt% Sn • Result:  phase particles and a eutectic microconstituent Microstructures in Eutectic Systems - IV 18.3 61.9 97.8 eutectic  eutectic  WL = (1- W) = 0.50 C = 18.3 wt% Sn CL = 61.9 wt% Sn W = = 0.50 • Just above TE : • Just below TE : C  = 18.3 wt% Sn C  = 97.8 wt% Sn W  = = 0.727 W  = 0.273 wt% Sn Pb-Sn system L+  200 T(°C) C, wt% Sn 20 60 80 100 0 300 100 L   L+  40  +  TE L: C0 wt% Sn L  L  CL - C0 CL - C Cβ - C0 Cβ - C Primary α
  • 39.
    39 Chapter 10 (part2) • Equilibrium Diagrams with Intermediate Phases or Compounds • Eutectoid and Peritectic Reactions • Ceramic Phase Diagrams • The Gibbs Phase Rule • The Iron-Iron Carbide Phase Diagram • Development of Microstructures in Iron-Carbon Alloys • Hypoeutectoid Alloys • Hypereutectoid Alloys • Influence of Other Alloying Elements
  • 40.
    40 Intermetallic Compounds Mg2Pb Note: intermetalliccompounds exist as a line on the diagram - not a phase region. The composition of a compound has a distinct chemical formula. 19 wt% Mg-81 wt% Pb
  • 41.
  • 42.
    42 Eutectoid & Peritectic Cu-ZnPhase diagram Eutectoid transformation   +  Peritectic transformation  + L 
  • 43.
    43 • Eutectoid –one solid phase transforms to two other solid phases Solid1 ↔ Solid2 + Solid3   + Fe3C (For Fe-C, 727C, 0.76 wt% C) Eutectic, Eutectoid, & Peritectic • Eutectic - liquid transforms to two solid phases L  +  (For Pb-Sn, 183C, 61.9 wt% Sn) cool heat • Peritectic - liquid and one solid phase transform to a 2nd solid phase Solid1 + Liquid ↔ Solid2  + L ε (For Cu-Zn, 598°C, 78.6 wt% Zn) cool heat cool heat
  • 44.
  • 45.
  • 46.
    46 • Need amaterial to use in high temperature furnaces. • Consider Silica (SiO2) - Alumina (Al2O3) system. • Phase diagram shows: mullite, alumina and crystobalite (made up of SiO2) are candidate refractories. Composition (wt% alumina) T(°C) 1400 1600 1800 2000 2200 20 40 60 80 100 0 alumina + mullite mullite + L mullite Liquid (L) mullite + crystobalite crystobalite + L alumina + L 3Al2O3-2SiO2 APPLICATION: REFRACTORIES
  • 47.
  • 48.
    48 Gibbs Phase Rule •Phase diagrams and phase equilibria are subject to the laws of thermodynamics. • Gibbs phase rule is a criterion that determines how many phases can coexist within a system at equilibrium. P + F = C + N P: # of phases present F: degrees of freedom (temperature, pressure, composition) C: components or compounds N: noncompositional variables For the Cu-Ag system @ 1 atm for a single phase P: N=1 (temperature), C = 2 (Cu-Ag), P= 1 (, L) F = 2 + 1 – 1= 2 This means that to characterize the alloy within a single phase field, 2 parameters must be given: temperature and composition. If 2 phases coexist, for example, L L, then according to GPR, we have 1 degree of freedom: F = 2 + 1 – 2= 1. So, if we have Temp or composition, then we can completely define the system. If 3 phases exist (for a binary system), there are 0 degrees of freedom. This means the composition and Temp are fixed. This condition is met for a eutectic system by the eutectic isotherm.
  • 49.
    49 Iron-Carbon System • Pureiron when heated experiences 2 changes in crystal structure before it melts. • At room temperature the stable form, ferrite ( iron) has a BCC crystal structure. • Ferrite experiences a polymorphic transformation to FCC austenite ( iron) at 912 ˚C (1674 ˚F). • At 1394˚C (2541˚F) austenite reverts back to BCC phase  ferrite and melts at 1538 ˚C (2800 ˚F). • Iron carbide (cementite or Fe3C) an intermediate compound is formed at 6.7 wt% C. • Typically, all steels and cast irons have carbon contents less than 6.7 wt% C. • Carbon is an interstitial impurity in iron and forms a solid solution with the phases
  • 50.
  • 51.
    Though carbon ispresent in relatively low concentrations, it significantly influences the mechanical properties of ferrite: (a) α ferrite, (b) austenite.
  • 52.
  • 53.
    Iron carbide (Cementiteor Fe3C) • Forms when the solubility limit of carbon in  ferrite is exceeded at temperatures below 727 ˚C. • Mechanically, cementite is very hard and brittle. • For ferrous alloys there are 3 basic types, based on carbon content:  Iron (ferrite phase): <0.008 wt% C room temp  Steel ( + Fe3C phase): 0.008 to 2.14 wt% C  Cast iron: 2.14 to 6.70 wt% C 53
  • 54.
    54 Iron-Carbon (Fe-C) PhaseDiagram • 2 important points - Eutectoid (B):   +Fe3C - Eutectic (A): L ↔ +Fe3C Fe 3 C (cementite) 1600 1400 1200 1000 800 600 400 0 1 2 3 4 5 6 6.7 L  (austenite) +L +Fe3C +Fe3C  +   (Fe) C, wt% C 1148°C T(°C)  727°C = Teutectoid 4.30 Result: Pearlite = alternating layers of  and Fe3C phases, not a separate phase. 120 m 0.76 B     A L+Fe3C Fe3C (cementite-hard)  (ferrite-soft) ↔
  • 55.
    Pearlite Eutectoid reaction:  ↔  +Fe3C Austenite – 0.76 wt% C Ferrite - 0.022 wt% C Cementite - 6.70 wt% C Redistribution of carbon by diffusion
  • 56.
    Fe 3 C (cementite) 1600 1400 1200 1000 800 600 400 0 1 23 4 5 6 6.7 L  (austenite)  +L  + Fe3C  + Fe3C L+Fe3C  (Fe) C, wt% C 1148°C T(°C)  727°C C0 0.76 Hypoeutectoid Steel        W = W =(1 - W)  pearlite pearlite =  + Fe3C W’ = W = (1 – W’) pearlite Microstructures for iron-iron carbide alloys that are below the eutectoid with compositions between 0.022 and 0.76 wt% Carbon are hypoeutectoid. C - C0 C - C CFe3C - C0 CFe3C - C
  • 57.
    57 Fe 3 C (cementite) 1600 1400 1200 1000 800 600 400 0 1 23 4 5 6 6.7 L  (austenite) +L  + Fe3C + Fe3C L+Fe3C  (Fe) C, wt% C 1148°C T(°C)  727°C C0 0.76 Hypoeutectoid Steel  pearlite               
  • 58.
    58 Proeutectoid • Formed beforethe eutectoid • Ferrite that is present in the pearlite is called eutectoid ferrite. • The ferrite that is formed above the Teutectoid (727°C) is proeutectoid.
  • 59.
  • 60.
    Fe 3 C (cementite) 1600 1400 1200 1000 800 600 400 0 1 23 4 5 6 6.7 L  (austenite) +L  +Fe3C  +Fe3C L+Fe3C  (Fe) C, wt%C 1148°C T(°C)  Hypereutectoid Steel 0.76 C0 pearlite Fe3C     x v V X Wpearlite = W W = X/(V +X) W =(1 - W) Fe3C’ W =(1-W) W =x/(v + x) Fe3C Microstructures for iron-iron carbide alloys that have compositions between 0.76 and 2.14 wt% carbon are hypereutectoid (more than eutectoid).
  • 61.
    61 Hypereutectoid Steel Fe 3 C (cementite) 1600 1400 1200 1000 800 600 400 0 12 3 4 5 6 6.7 L  (austenite) +L  +Fe3C  +Fe3C L+Fe3C  (Fe) C, wt%C 1148°C T(°C)  0.76 C0 Fe3C             pearlite
  • 62.
    Hypereutectoid Steel (1.2wt% C) Proeutectoid: formed above the Teutectoid (727°C) pearlite
  • 63.
    63 L+ L+  +  200 C,wt% Sn 20 60 80 100 0 300 100 L   TE 40 (Pb-Sn System) Hypoeutectic & Hypereutectic 160 m eutectic micro-constituent hypereutectic: (illustration only)       175 m       hypoeutectic: C0 = 50 wt% Sn T(°C) 61.9 eutectic eutectic: C0 =61.9wt% Sn
  • 64.
  • 65.
    65 Example Problem For a99.6 wt% Fe-0.40 wt % C steel at a temperature just below the eutectoid, determine the following: a) The compositions of Fe3C and ferrite (). b) The amount of cementite (in grams) that forms in 100 g of steel.
  • 66.
    66 Solution to ExampleProblem WFe3C  R R S  C0  C CFe3C  C  0.40  0.022 6.70  0.022 0.057 b) Using the lever rule with the tie line shown a) Using the RS tie line just below the eutectoid C = 0.022 wt% C CFe3C = 6.70 wt% C Fe 3 C (cementite) 1600 1400 1200 1000 800 600 400 0 1 2 3 4 5 6 6.7 L  (austenite) +L  + Fe3C  + Fe3C L+Fe3C  C, wt% C 1148°C T(°C) 727°C C0 R S CFe C 3 C Amount of Fe3C in 100 g = (100 g)WFe3C = (100 g)(0.057) = 5.7 g
  • 67.
    67 Alloying steel withother elements changes the Eutectoid Temperature, Position of phase boundaries and relative Amounts of each phase
  • 68.
  • 69.
  • 70.
  • 71.
  • 72.
  • 73.
    73 • Phase diagramsare useful tools to determine: -- the number and types of phases present, -- the composition of each phase, -- and the weight fraction of each phase For a given temperature and composition of the system. • The microstructure of an alloy depends on -- its composition, and -- rate of cooling equilibrium Summary
  • 74.
  • 75.
    75 • Heating acopper-nickel alloy of composition 70 wt% Ni-30 wt% Cu from 1300°C. At what temperature does the first liquid phase form? • Solidus - Temperature where alloy is completely solid. Above this line, liquefaction begins. • Answer: The first liquid forms at the temperature where a vertical line at this composition intersects the α-(α + L) phase boundary--i.e., about 1350°C; • 2 phases: L (liquid)  (FCC solid solution) • 3 phase fields: L L +   wt% Ni 20 40 60 80 100 0 1000 1100 1200 1300 1400 1500 1600 T(°C) L (liquid)  (FCC solid solution) L +  liquidus solidus Wt% Ni
  • 76.
    76 • (b) Whatis the composition of this liquid phase? • Answer: The composition of this liquid phase corresponds to the intersection with the (α + L)-L phase boundary, of a tie line constructed across the α + L phase region at 1350°C, 59 wt% Ni; Wt% Ni • 2 phases: L (liquid)  (FCC solid solution) • 3 phase fields: L L +   wt% Ni 20 40 60 80 100 0 1000 1100 1200 1300 1400 1500 1600 T(°C) L (liquid)  (FCC solid solution) L +  liquidus solidus
  • 77.
    77 • (c) Atwhat temperature does complete melting of the alloy occur? • Liquidus - Temperature where alloy is completely liquid. Below this line, solidification begins. • Answer: Complete melting of the alloy occurs at the intersection of this same vertical line at 70 wt% Ni with the (α + L)-L phase boundary--i.e., about 1380°C; • 2 phases: L (liquid)  (FCC solid solution) • 3 phase fields: L L +   wt% Ni 20 40 60 80 100 0 1000 1100 1200 1300 1400 1500 1600 T(°C) L (liquid)  (FCC solid solution) Wt% Ni
  • 78.
    78 • (d) Whatis the composition of the last solid remaining prior to complete melting? • Answer: The composition of the last solid remaining prior to complete melting corresponds to the intersection with α-(α + L) phase boundary, of the tie line constructed across the α + L phase region at 1380°C--i.e., about 78 wt% Ni. • 2 phases: L (liquid)  (FCC solid solution) • 3 phase fields: L L +   wt% Ni 20 40 60 80 100 0 1000 1100 1200 1300 1400 1500 1600 T(°C) L (liquid)  (FCC solid solution) Wt% Ni
  • 79.
    • Sum ofweight fractions: 9 • Conservation of mass (Ni): • Combine above equations: WL  W 1 Co WLCL  WC  R R S W  Co  CL C  CL  S R  S WL C  Co C  CL • A geometric interpretation: Co R S W WL CL C moment equilibrium: 1 W solving gives Lever Rule WLR WS THE LEVER RULE: A PROOF