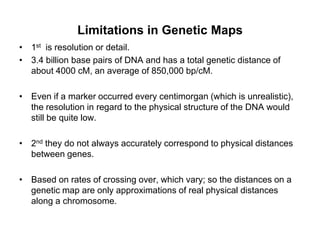
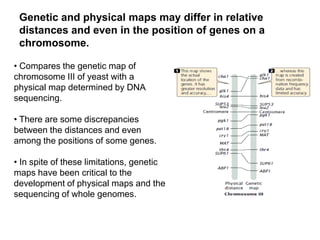
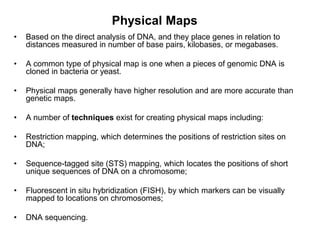
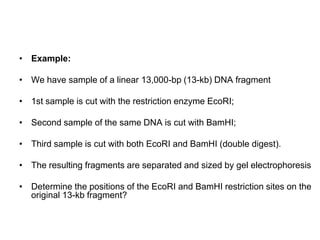
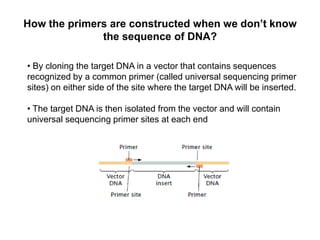
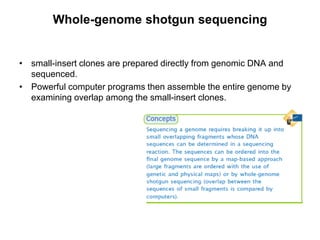
Structural genomics aims to understand genome content through sequencing and mapping genomes. Genetic maps show relative gene locations based on recombination rates, while physical maps use DNA analysis to place genes by base pair distance. Whole genome sequencing involves breaking genomes into fragments that are sequenced and reassembled using overlaps. Functional genomics seeks to identify all genes, RNAs, proteins and their functions through methods like homology searches, microarrays, and mutagenesis screens.
2. Structural Genomics
ā¢ Structural genomics is concerned with sequencing and understanding
the content of genomes.
ā¢ The first steps in characterizing a genome is to prepare its maps:
ā Genetic Maps
ā Physical Maps
These maps provide information about the:
ā relative locations of genes,
ā Molecular markers, and
ā chromosome segments,
3. Genetic Maps
ā¢ Genetic maps (also called linkage maps) provide a rough
approximation of the locations of genes relative to the locations of
other known genes.
ā¢ These maps are based on the genetic function of recombination
ā¢ Individuals heterozygous at two or more genetic loci are crossed,
and the frequency of recombination between loci is determined by
examining the progeny.
ā¢ Recombination frequency between two loci is 50%, then the loci are
located on different chromosomes or are far apart on the same
chromosome.
4. ā¢ Recombination frequency <50%, the loci are linked.
ā¢ For linked genes, the rate of recombination is proportional to the
physical distance between the loci.
ā¢ Distances on genetic maps are measured in percent recombination
(centimorgans, cM) or map units.
5. Limitations in Genetic Maps
ā¢ 1st is resolution or detail.
ā¢ 3.4 billion base pairs of DNA and has a total genetic distance of
about 4000 cM, an average of 850,000 bp/cM.
ā¢ Even if a marker occurred every centimorgan (which is unrealistic),
the resolution in regard to the physical structure of the DNA would
still be quite low.
ā¢ 2nd they do not always accurately correspond to physical distances
between genes.
ā¢ Based on rates of crossing over, which vary; so the distances on a
genetic map are only approximations of real physical distances
along a chromosome.
6. Genetic and physical maps may differ in relative
distances and even in the position of genes on a
chromosome.
ā¢ Compares the genetic map of
chromosome III of yeast with a
physical map determined by DNA
sequencing.
ā¢ There are some discrepancies
between the distances and even
among the positions of some genes.
ā¢ In spite of these limitations, genetic
maps have been critical to the
development of physical maps and the
sequencing of whole genomes.
7. Physical Maps
ā¢ Based on the direct analysis of DNA, and they place genes in relation to
distances measured in number of base pairs, kilobases, or megabases.
ā¢ A common type of physical map is one when a pieces of genomic DNA is
cloned in bacteria or yeast.
ā¢ Physical maps generally have higher resolution and are more accurate than
genetic maps.
ā¢ A number of techniques exist for creating physical maps including:
ā¢ Restriction mapping, which determines the positions of restriction sites on
DNA;
ā¢ Sequence-tagged site (STS) mapping, which locates the positions of short
unique sequences of DNA on a chromosome;
ā¢ Fluorescent in situ hybridization (FISH), by which markers can be visually
mapped to locations on chromosomes;
ā¢ DNA sequencing.
8. Restriction Mapping
ā¢ Restriction mapping determines the relative positions of restriction
sites on a piece of DNA.
ā¢ When a piece of DNA is cut with a restriction enzyme.
ā¢ The fragments are separated by gel electrophoresis.
ā¢ The number of restriction sites in the DNA and the distances
between them can be determined by the number and positions of
bands on the gel.
9. ā¢ Example:
ā¢ We have sample of a linear 13,000-bp (13-kb) DNA fragment
ā¢ 1st sample is cut with the restriction enzyme EcoRI;
ā¢ Second sample of the same DNA is cut with BamHI;
ā¢ Third sample is cut with both EcoRI and BamHI (double digest).
ā¢ The resulting fragments are separated and sized by gel electrophoresis
ā¢ Determine the positions of the EcoRI and BamHI restriction sites on the
original 13-kb fragment?
10.
11. ā¢ Most restriction mapping is done with several restriction enzymes,
used alone and in various combinations, producing many restriction
fragments.
ā¢ With long pieces of DNA (greater than 30 kb), computer programs
are used to determine the restriction maps.
ā¢ Restriction mapping may be facilitated by tagging one end of a large
DNA fragment with radioactivity or by identifying the end with the
use of a probe.
12. DNA-Sequencing Methods
ā¢ The most detailed physical maps are based on direct DNA sequence
information.
ā¢ 1975 and 1977 Frederick Sanger and his colleagues created the
dideoxy sequencing method based on the elongation of DNA;
ā¢ Allan Maxam and Walter Gilbert developed a second method based
on the chemical degradation of DNA.
13.
14. How the primers are constructed when we donāt know
the sequence of DNA?
ā¢ By cloning the target DNA in a vector that contains sequences
recognized by a common primer (called universal sequencing primer
sites) on either side of the site where the target DNA will be inserted.
ā¢ The target DNA is then isolated from the vector and will contain
universal sequencing primer sites at each end
16. Sequencing an Entire Genome
ā¢ The ultimate goal of structural genomics is to determine the ordered
nucleotide sequences of entire genomes of organisms.
ā¢ The main obstacle to this task is the immense size of most
genomes.
ā Bacterial genomes are usually at least several million base pairs long
ā Eukaryotic genomes are billions of base pairs long and are distributed
among dozens of chromosomes.
ā For technical reasons, it is not possible to begin sequencing at one end
of a chromosome and continue straight through to the other end;
ā Only small fragments of DNAāusually from 500 to 700 nucleotidesā
can be sequenced at one time.
17. ā¢ The DNA be broken into thousands or millions of smaller fragments
that can then be sequenced.
ā¢ Again a problem is there:
ā Putting these short sequences back together in the correct order.
ā¢ Two approaches are used to resolve this task.
ā Map-based sequencing
ā Whole-genome shotgun sequencing
18. Map-based approach
ā¢ Map-based approach, requires the initial creation of detailed genetic
and physical maps of the genome, which provide known locations of
genetic markers at regularly spaced intervals along each chromosome.
ā¢ These markers can later be used to help align the short, sequenced
fragments into their correct order.
ā¢ After the genetic and physical maps are available, chromosomes or
large pieces of chromosomes are separated by:
ā¢ PFGE -large molecules of DNA or whole chromosomes are separated
in a gel by periodically alternating the orientation of an electrical current.
ā¢ Flow cytometry: chromosomes are sorted optically by size
19. ā¢ Each chromosome (or sometimes the entire genome) is then cut up
by partial digestion with restriction enzymes.
ā¢ Thus partial digestion produces a set of large overlapping DNA
fragments.
ā¢ Which are then cloned by using cosmids, yeast artificial
chromosomes (YACs), or bacterial artificial chromosomes (BACs).
ā¢ Clones are screened with specific probe.
A set of two or more overlapping
DNA fragments that form a
contiguous stretch of DNA is called a
contig.
Thisapproach was used in 1993 to
create a contig of the human
Y chromosome consisting of 196
overlapping YAC clones
20. Each clone can be cut with a series of
restriction enzymes, and the resulting
fragments are then separated by gel
electrophoresis.
A computer program is then used to
examine the restriction patterns of all
the clones and look for areas of
overlap.
The overlap is then used to arrange
the clones in order
21. Whole-genome shotgun sequencing
ā¢ small-insert clones are prepared directly from genomic DNA and
sequenced.
ā¢ Powerful computer programs then assemble the entire genome by
examining overlap among the small-insert clones.
23. The Human Genome Project
ā¢ The Human Genome Project is an effort to sequence the entire
human genome.
ā¢ Begun in 1990, a rough draft of the
sequence was completed by two
competing teams:
ā¢ An international consortium of
publicly supported investigators
ā¢ Private company Celera Genomics,
both of which finished a rough draft
of the genome sequence in 2000.
24. Data Supporting Structural Genomics
ā¢ In addition to the DNA sequence of an entire genome, several other
types of data are useful for genomic projects and have been the
focus of sequencing efforts.
ā¢ Including:
- SNPs
- ESTs
25. Single-Nucleotide Polymorphisms
ā¢ Are single-base-pair differences in DNA sequence between
individual members of a species.
ā¢ Arising through mutation.
ā¢ Single-nucleotide polymorphisms are numerous and are present
throughout genomes.
ā¢ In a comparison of the same chromosome from two different people,
a SNP can be found approximately every 1000 bp.
ā¢ Because of their variability and widespread occurrence throughout
the genome, SNPs are valuable as markers in linkage studies.
26. Expressed-Sequence Tags
ā¢ Another type of data identified by sequencing projects consists of
databases of expressed-sequence tags (ESTs).
ā¢ In most eukaryotic organisms, only a small percentage of the DNA
actually encodes proteins; in humans, less than 2% of human DNA
encodes the amino acids of proteins.
ā¢ If only protein-encoding genes are of interest, it is often more
efficient to examine RNA than the entire DNA genomic sequence.
ā¢ RNA can be examined by using ESTsāmarkers associated with
DNA sequences that are expressed as RNA.
ā¢ RNA Reverse transciptase cDNA Short stretches of
cDNA fragments are then sequenced, and the sequence obtained
(called a tag) provides a marker that identifies the DNA fragment.
ā¢ Expressed-sequence tags can be used to find active genes in a
particular tissue or at a particular point in development.
28. Goals of functional genomics
ā¢ The goals of functional genomics include:
ā¢ Identifying all the RNA molecules transcribed from a genome (the
transcriptome)
ā¢ All the proteins encoded by the genome (the proteome).
ā¢ Functional genomics exploits both bioinformatics and laboratory-
based experimental approaches in its search to define the function
of DNA sequences.
29. ā¢Several methods for identifying genes and assessing
their functions are available including:
ā¢In situhybridization,
ā¢DNA footprinting,
ā¢Experimental mutagenesis,
ā¢Use of transgenic animals and knockouts.
30. Predicting Function from Sequence
ā¢ The nucleotide sequence of a gene can be used to predict the
amino acid sequence of the protein that it encodes.
ā¢The protein can then be synthesized or isolated and its properties
studied to determine its function.
ā¢This biochemical approach to understanding gene function is both
time consuming and expensive.
ā¢A major goal of functional genomics has been to develop
computational methods that allow gene function to be identified
from DNA sequence alone,
ā¢This will bypassing the laborious process of isolating and
characterizing individual proteins.
31. Homology searches
ļ¶Relies on comparing DNA and protein sequences from the same
and different organisms.
ļ¶Genes that are evolutionarily related are said to be homologous.
ļ¶Homologous genes found in different species that evolved from
the same gene in a common ancestor are called orthologs
ļ¶For example, both mouse and human genomes contain a gene
that encodes the alpha subunit of hemoglobin;
ļ¶The mouse and human alpha hemoglobin genes are said to be
orthologs, because both genes evolved from an alpha-hemoglobin
gene in a mammalian ancestor common to mice and humans.
32. ļ¶Homologous genes in the same organism are called paralogs
ļ¶ By duplication of a single gene in the evolutionary past
ļ¶Within the human genome is a gene that encodes the alpha subunit
of hemoglobin and another homologous gene that encodes the beta
subunit of hemoglobin.
ļ¶These two genes arose because an ancestral gene underwent
duplication and the resulting two genes diverged through evolutionary
time, giving rise to the alpha- and beta-subunit genes; these two genes
are paralogs.
ļ¶ Homologous genes (both orthologs and paralogs) often have the
same or related functions; so, after a function has been assigned to a
particular gene, it can provide a clue to the function of a homologous
gene.
33. Database Search for Orthologous
ļ¶Databases containing genes and proteins found in a wide array of
organisms are available for homology searches.
ļ¶Powerful computer programs have been developed for scanning
these databases to look for particular sequences.
ļ¶A commonly used homology search program is BLAST (Basic
Local Alignment Search Tool).
ļ¶Suppose a geneticist sequences a genome and locates a gene
that encodes a protein of unknown function.
ļ¶A homology search conducted on databases containing the DNA
or protein sequences of other organisms may identify one or more
orthologous sequences.
34. Database Search for Paralogous
ā¢ computer programs can search a single genome for paralogs.
ā¢ Eukaryotic organisms often contain families of genes that have
arisen by duplication of a single gene.
ā¢ If a paralog is found and its function has been previously assigned,
this function can provide information about a possible function of the
unknown gene.
35. Other sequence comparisons
ā¢ Complex proteins often have specific domains.
ā¢ Each domain has its characteristic amino acid arrangement
ā¢ For example, certain DNA-binding proteins attach to DNA in the same
way;
ā¢ All these proteins have a common DNA-binding domain
ā¢ Many protein domains have been characterized, and their molecular
functions have been determined.
ā¢ Newly identified gene can be scanned against a database of known
domains.
ā¢ If it encodes one or more domains of known function, the function of
the domain can provide important information about a possible
function of the new gene.
36. Phylogenetic Profile
ā¢ Another computational method for predicting protein function
ā¢ In this method, the presence- and-absence pattern of a particular
protein is examined across a set of organisms whose genomes have
been sequenced.
ā¢ If two proteins are either both present or both absent in all genomes
surveyed, the two proteins may be functionally related.
ā¢ Consider the following proteins in four bacterial species :
ā¢ E. coli: protein 1, protein 2, protein 3, protein 4, protein 5, protein 6
ā¢ Species A: protein 1, protein 2, protein 3, protein 6
ā¢ Species B: protein 1, protein 3, protein 4, protein 6
ā¢ Species C: protein 2, protein 4, protein 5
37. The phylogenetic profile reveals that
proteins 1, 3, and 6 are either all
present or all absent in all species; so
these proteins might be functionally
related.
38. Gene Neighbor Analysis
ā¢ Genes that encode functionally related proteins are often closely
linked in bacteria.
ā¢ For example, if two genes are
consistently linked in the genomes
of several bacteria, they might be
functionally related.
39. Gene Expression and Microarrays
ā¢ The development of microarrays has allowed the expression of
thousand of genes to be monitored simultaneously.
ā¢ Microarrays rely on nucleic acid hybridization, in which a known
DNA fragment is used as a probe to find complementary sequences
ā¢ The probe is usually fixed to some type of solid support, such as a
nylon filter or a glass slide.
ā¢ A solution containing a mixture of DNA or RNA is applied to the solid
support; any nucleic acid that is complementary to the probe will
bind to it.
ā¢ Nucleic acids in the mixture are labeled with a radioactive or
fluorescent tag so that molecules bound to the probe can be easily
detected.
40.
41. How can we examine changes in gene
expression?
ā¢ Let we have two types of cells:
Experimental cells
mRNA is converted into cDNA and
labeled with red fluorescent nucleotides
Control cells
cDNA, labeled with green
fluorescent nucleotides.
Labelled cDNA are mixed and
Hybridized to DNA chip, which contain DNA
Probes form different genes
Hybridization of the red (experimental) and green (control) cDNAs is
proportional to the relative amounts of mRNA in the samples.
42.
43. ā¢ Red indicates the over expression of a gene in the experimental
cells (more red-labeled cDNA ybridizes),
ā¢ Green indicates the under expression of a gene in the experimental
cells (more green-labeled cDNA hybridizes).
ā¢ Yellow indicates equal expression (equal hybridization of red- and
greenlabeled cDNAs.
ā¢ No or black color indicates no expression.
ā¢ Microarrays allow the expression of thousands of genes to be
monitored simultaneously,
ā¢ To study which genes are active in particular tissues.
ā¢ To investigate how gene expression changes in the course of
biological processes such as development or disease progression.
44. Genome wide Mutagenesis
ā¢ One of the best methods for determining the function of a gene is to
examine the phenotypes of individual organisms that possess a
mutation in the gene.
ā¢ To conduct a mutagenesis screen, random mutations are induced in a
population of organisms, creating new phenotypes.
ā¢ Random inducement of mutations on a genome wide basis and
mapping with molecular markersāare coupled and automated in a
mutagenesis screen.
ā¢ Mutagenesis screens can be used to search for specific genes
encoding a particular function or trait.