DR. VIBHA KHANNA
ASSO. PROF. (BOTANY)
S.P.C. GOVERNMENT COLLEGE
AJMER (RAJASTHAN)
CYTOGENETICS
• BLOCK 3: PHAGE GENETICS
• PRESENTATION 1:
MAPPING THE BACTERIOPHAGE GENOME
Bacteriophage Genome
• Bacteriophage genomes are enormously diverse.
• Enormous heterogeneity occurs in the nucleotide sequence of
bacteriophage genomes.
• Phage genome size varies enormously: ranging from the ~3,300
nucleotide ssRNA viruses of Escherichia coli to the almost 500 kbp
genome of Bacillus megaterium phage G
• The genome of a bacteriophage may consist of RNA or DNA; the
DNA may be single stranded but majority of bacteriophages are
double stranded DNA (dsDNA) tailed phages (Caudovirales)
• Bacteriophage genomes are ubiquitously mosaic
• In general, these genomes are packaged at similar densities into
their capsids and the size of the capsid varies as a function of
genome size.
• The infectivity of virion is influenced by the amount of DNA
packaged within any given capsid , hence, variations in the amount
of genetic material leads to loss of virion stability.
Bacteriophage Genome:
Core and Non-core Genes
• The phage genome consists of core and non-core genes.
• Core genes—the genes that are shared by all members of the group –
includes: head genes, tail genes, DNA replication genes and nucleotide
metabolism genes.
• Non-core genes are found in all tailed phage genomes; they are often in
small clusters of genes, interspersed among the clusters of core genes.
• In most cases the functions of the non-core genes are unknown, and may
be deleted without adverse effect on phage growth
• Non-core genes are not the disorganized “junk” DNA.
• These genes could serve as a “gene nursery”, where novel genetic
functions could be built by recombination and mutation among genetic
sequences that have no essential role in phage survival.
• The non-core genes may optimize the phage to occupy a certain ecological
niche, and that the changing repertoire of these genes gives the phage
population access to new niches.
• The description of core and non-core genes given here implies that the
non-core genes are moving in and out of the phage genomes on a much
faster time scale than the core genes.
GENOME MAPPING
• Genome mapping is used to identify and record the
location of genes and the distances between genes on
a chromosome.
• Genome map highlights the key landmarks in an
organism genome.
• The landmarks on a genome map include short DNA
sequences, regulatory sites for the genes themselves.
• There are two general types of genome mapping called
genetic mapping and
physical mapping
Genetic Mapping
• Gene mapping refers to the process of locating genes on a DNA
strand.
• A DNA strand is a long stretch of nucleotide sequences. Selective
short regions of these long stretch of nucleotides form genes and
are responsible for formation of functional and structural proteins.
• A single DNA strand usually has multiple genes, which can function
together or independently to form proteins which express
phenotypically.
• When a DNA is studied to figure out
 locus of different genes on it, and
 the respective distance between them,
the process is referred to as gene mapping.
• The first ever genetic map was created by Alfred Strutevant while
he worked on Drosophila melanogaster with Thomas Hunt Morgan.
• Centimorgan is the unit to define distance between two genes on a
locus.
Genetic Maps
• The genetic map which is also known as the
linkage map of the chromosome may is defined
as ‘a diagram of the order of genes in a
chromosome in which the distance between
adjacent genes is proportional to the rate of
recombination between them’
• Genetic maps are based on the recombination
(the exchange of DNA sequence between sister
chromatids during meiosis) frequency between
molecular markers.
• These maps are population specific.
Physical Maps
• Physical maps are an alignment of DNA
sequences, with distance between markers
measured in base pairs.
• Physical mapping uses Molecular Biology
techniques to examine DNA molecules directly, in
order to construct maps showing the position of
sequence features, including genes
• Unique DNA sequences called ‘molecular
markers’ are compared to each other to
determine correct marker order (genetic map)
and used to identify overlapping segments of
larger DNA pieces (physical map).
Mapping The Virus Genome
 Genetic (Recombination mapping) mapping technique
• Bacteriophage genomes also undergo recombination, although the process is
different from that in bacteria. Because phages themselves reproduce within
the cell and cannot recombine directly, crossing-over must occur inside a host
cell.
• In principle a virus recombination experiment is easy to carry out. If bacteria
are mixed with enough phages at least 2 viruses will infect each cell on an
average and genetic recombination should be observed.
• Phage progeny in the resulting lysate can be checked for alternate
combinations of the initial parental genotypes
 Physical mapping techniques (Heteroduplex Analysis, Restriction
mapping, ORF scanning,).
• Phage genomes are so small (the core genes, in particular) that often it is
convenient to map them without determining recombination frequencies.
• Some techniques actually generate physical maps which often are most used in
genetic engineering.
• Several of these methods require manipulation of the DNA with subsequent
examination in the electron microscope for example one can directly compare
wild-type and mutant viral chromosomes.
Mapping Genome by Genetic
Techniques
• When proposing the idea of crossing over, Morgan hypothesized
 that the frequency of recombination was related to the distance
between the genes on a chromosome, and
 that the interchange of genetic information broke the linkage between
genes.
• Morgan imagined that genes on chromosomes were similar to
beads on a string ; in other words, they were physical objects.
• Morgan proposed that the strength of linkage between two genes
depends upon the distance between the genes on the
chromosome. This proposition became the basis for construction of
the genetic maps.
• The closer two genes were to one another on a chromosome, the
greater their chance of being inherited together. In contrast, genes
located farther away from one another on the same chromosome
were more likely to be separated during recombination.
• The "proportion of crossovers could be used as an index of the
distance between any two factors"
Mapping Genome by Genetic
Techniques
• Linkage analysis is a technique in which the genome is scanned for
chromosomal loci showing co-segregation with the phenotype of
interest.
• The phenomenon known as incomplete linkage occurs when two
genes show linkage with a recombination level greater than 0% and
less than 50%. In incomplete linkage, all expected types of gametes
are formed, but the recombinant gametes occur less often than the
parental gametes.
• In addition, if two genes are on the same chromosome and are far
enough apart that they undergo recombination at least 50% of the
time, the genes are independently assorting and do not show
linkage. Genes independently assort at a distance of 50 cM or more
apart.
• Finally, linked genes that do not independently assort
show statistical linkage. Statistical linkage is detected as deviation
from independent assortment that favors the parental gametes.
Recombination Mapping
• To Summarize:
The rate of recombination between a specific pair
of genetic loci depends on the distance between
them and varies from less than 1 percent to
approximately 50 percent.
Measurement of the recombination frequencies
for different loci can be used to map the virus
genome.
In this type of genetic map, loci with high
recombination frequencies are far apart and loci
with low recombination frequencies are close
together.
Recombination of Bacteriophage Genes
• Recombination involves the exchange of genetic
material between two related viruses
• Viral recombination occurs when viruses of two
different parent strains coinfect the same host cell and
interact during replication to generate virus progeny
that have some genes from both parents.
• Genes that reside on the same piece of nucleic acid
may undergo recombination. The closer two genes are
together, the rarer is recombination between them
(partial linkage).
• As long as there are detectable phenotypes and
methods for carrying out the process, it is possible to
map phages in this way.
Recombination In The Phage:
Hershey’s Experiment
• Alfred Hershey initially demonstrated recombination in the
phage T2 using two strains with different phenotypes.
The gene h influences host range, when gene h changes
T2 infects different strains of E.coli.
Phages with the r+ genes have wild-type plaque
morphology while T2 with r genotype has a rapid lysis
phenotype and produces larger than normal plaques
with sharp edges.
• In one experiment Hershey infected E.coli with large
quantities of the h+ r+ and hr T2 strains.
• He then plated out the lysates with the mixture of two
different host strains and was able to detect a significant
number of h+r and hr+ recombinants as well as parental
type plaques.
https://www.slideshare.net/vibhakhanna1/genetic-recombination-in-phages
Recombination Mapping of Viral
Genome
• The lysate was spread over a bacterial lawn having the mixture of
strains 1 and 2, and analysed. Four types of plaques were recorded:
 clear and small plaques (h–r+),
 cloudy and large plaques (h+r–),
 cloudy and small plaques (h+r+), and
 clear and large plaques (h–r–).
• The former two types of plaques have parental phenotypes, while
the last two are the recombinants.
• Out of the four, the recombination frequency (RF) is calculated as
below:
 RF = {(h+r+) + (h–r–)/Total plaques} X 100
• The map unit (1 m.u.) is defined as a recombinant frequency of 1
percent.
• Thus genetic maps can be constructed, by determining the map
distance between the genes under consideration.
Physical Mapping Technique:
Heteroduplex mapping
• In heteroduplex mapping the two types of chromosomes
are denatured, mixed and allowed to rejoin or anneal.
When joined the homologous regions of the different DNA
molecules form a regular double helix.
• Several other direct techniques are used to map viral
genomes or parts of them. Restriction endonucleases are
employed together with electrophoresis to analyse DNA
fragments and locate deletions and other mutations that
affect electrophoretic mobility.
• Phage genomes also can be directly sequenced to locate
particular mutations and analyse the changes that have
taken place
• An electron microscopic technique compares sequence
relationships of two polynucleotides.
Preparation of the Heteroduplex
• Bacteriophage DNA occurs both as duplex DNA while
growing in the infected cell, and as single strands in the
mature viral particles.
• Separation of the strands of the duplex and reannealing
with an excess of single strand DNA from phage of a
different genotype yields heteroduplex.
• Another method is available for use with bacteriophage
lambda, which has two strands of different density.
• The separated linear single strands can be isolated
individually by density gradient centrifugation and then
annealed with complementary single strands of a different
genotype producing heteroduplex molecules.
Heteroduplex Analysis
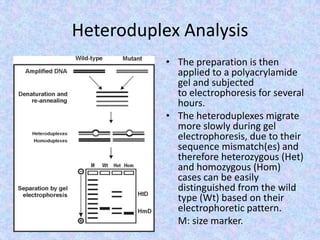
• Two different methods are applied under the
concept of heteroduplex analysis.
• With the molecular biological method, a standard
DNA and a DNA to be analyzed are amplified
separately, mixed, denatured, and slowly cooled
(approximately 1°C to 2°C [34°F to 37°F] per
minute) to permit the formation of both,
homoduplexes (HmD) and heteroduplexes (HtD).
Heteroduplexes are formed from standard and
sample DNA.
Heteroduplex Analysis
• The preparation is then
applied to a polyacrylamide
gel and subjected
to electrophoresis for several
hours.
• The heteroduplexes migrate
more slowly during gel
electrophoresis, due to their
sequence mismatch(es) and
therefore heterozygous (Het)
and homozygous (Hom)
cases can be easily
distinguished from the wild
type (Wt) based on their
electrophoretic pattern.
M: size marker.
Heteroduplex Analysis
• Another method for transcript mapping involves heteroduplex analysis. If
the DNA region being studied is cloned as a restriction fragment in an M13
vector then it can be obtained as single stranded DNA.
• When mixed with an appropriate RNA preparation the transcribed
sequence in the cloned DNA hybridizes with equivalent mRNA forming a
double stranded hetero duplex.
• In the example shown in figure, the start of this messenger RNA lies within
the cloned restriction fragment, so some of the cloned fragment
participates in the Heteroduplex but the rest does not. The single stranded
regions can be digested by treatment with a single strand specific nuclease
such as S1.
• The size of the heteroduplex is determined by degrading the RNA
component with alkali and electrophoresing the single stranded DNA in
agarose gel. This size measurement is then used to position the start of
the transcript relative to the restriction site at the end of the cloned
fragments.
S1 Nuclease Mapping
• A gene having two Sau3A restriction
sites, may be considered as an example
to understand S1 Nuclease Mapping.
• One of the restriction sites coincides
with the gene starting region, whereas
the other is present few base-pairs
upstream of the gene sequence.
• The starting point of the transcription is
never from the very first base-pair of
the gene; instead few base-pairs
upstream the gene.
• The DNA is cleaved, with the restriction
endonuclease and is inserted into the
M13 vector.
• M13 vector is single-stranded and
closed circular.
• To this vector, the mRNA of the gene
isolated from the cell is hybridized.
• The mRNA’s start sequence would bind
to the ssDNA where the complementary
sequence is present.
S1 Nuclease Mapping
• Now, S1 nuclease is added to
remove the single-stranded DNA.
Only the start sequence of mRNA
bounded to the DNA would be
protected.
• The size of the DNA is calculated by
gel electrophoresis after separating
the DNA and RNA by alkaline
treatment.
• Suppose the DNA fragment formed
due Sau3A was 400 base pairs and
consist both staring region of the
gene (100 bp) and few upstream
leader sequence (300 bp).
• If the length of the DNA was
calculated to be 150 basepairs, then
we can say that the start point of
the transcription is 50 bp upstream
to the gene sequence (150–100 =
50).
Physical Mapping Technique:
Restriction Mapping
• There are many different restriction enzymes with many different
target sequences, majority of these target sites are 4, 5 or 6
nucleotide sequence but there are examples that recognize
sequences of 7, 8 or more nucleotides.
• In restriction mapping, determination of nucleotide sequence of a
gene is achieved by cleavage of corresponding DNA, at specific sites,
with the help of restriction endonucleases.
• The data of digestion of a DNA molecule by more than one
endonucleases can be utilized to arrange the sites of breakage in a
definite order.
• These sites of cleavage can be identified and mapped to give a
restriction map.
• On a restriction map, is found a linear sequence of sites, each for a
specific enzyme and the distances between them are measured as
number of base pairs of DNA.
Restriction Mapping Technique
Restriction Mapping:
The Basic Methodology
• The simplest way to construct a restriction map is to
compare the fragment sizes produced when a DNA
molecule is digested with two different restriction enzymes
that recognize different target sequences; for example
using the restriction enzyme Eco R1 and Bam H1
• First the DNA molecule is digested with one of the two
enzymes and the sizes of the resulting fragments are
measured by agarose gel electrophoresis.
• Next the molecule is digested with the second enzyme and
the resulting fragment again sized in an agarose gel.
• The results of subsequent use of two enzymes give clear
picture about restriction sites creating a large number of
fragments but this method do not allow their relative
positions to be determined.
Restriction Mapping:
The Basic Methodology
• Next, to determine the relative positions of the restriction sites for
each enzymes, the DNA molecule is cut with both enzymes at once.
• In the given example this ‘double restriction’ enable three of the sites
to be mapped but a problem arises with the larger Eco R1 fragment as
this contains two Bam H1 sites and there are two alternative
possibilities for the map location of the outer one of these.
• The problem is solved by going back to the original DNA molecule and
treating it again with Bam H1 on its own but this time preventing the
digestion from going to completion by, say, incubating the reaction for
only a short time or using a sub-optimal incubation temperature. This
is called a ‘partial restriction’ and leads to a more complex set of
products.
• The complete restriction products now being supplemented with
partially restricted fragment that still contains one or more uncut Bam
H1 sites. In the example shown in the Fig., the size of one of the
partial restriction fragments is diagnostic and the correct map can be
identified
Restriction Mapping:
The Basic Methodology
• A partial restriction usually gives the information needed to
complete a map, but if there are many restriction sites then
this type of analysis becomes unwieldy, simply because
there are so many different fragments to consider.
• An alternative strategy is simpler because it enables the
majority of the fragments to be ignored.
• This is achieved by attaching a radioactive or other type of
marker to each end of the starting DNA molecule before
carrying out the partial digestion.
• The result is that many of the partial restriction products
become ‘invisible’ because they do not contain an end-
fragment and so do not show up when the agarose gel is
screened for labeled products.
• The sizes of the partial restriction products that are visible
enable unmapped sites to be positioned relative to the ends
of the starting molecule.
Restriction Mapping:
The Basic Methodology
• The scale of restriction mapping is limited by the sizes
of the restriction fragments.
• Restriction maps are easy to generate if there are
relatively few cut sites for the enzymes being used.
• Restriction mapping is therefore more applicable to
small molecules with the upper limit for the technique
dependent on the frequency of the restriction sites in
the molecule being mapped.
• Since the genome of bacteriophage lies within the
limit, this technique can be made use of, for mapping
it.
• Restriction mapping is rapid, easy and provides
detailed information.
Restriction Mapping:
The Basic Methodology
Physical Mapping Technique:
ORF Scan
• Physical mapping refers to locating genes in DNA sequences. The
techniques that can be used for bacteriophages includes:
 Gene location by sequence inspection i.e., ORF Scanning
 Specialist methods have been developed for mapping the
position of RNA molecules on-to DNA sequences to determine
the start and end points of transcription.
• In case of bacteriophages the size of the genome is comparatively
very small, hence sequence inspection can be used to locate genes.
• Genes that code for proteins comprise open reading frames
consisting of a series of codons that specify the amino acid sequence
of the protein that the gene codes for.
• The ORF begins with initiation codon while usually but not always
ATG and ends with the termination codon either TAA, TAG or TGA.
• Searching a DNA sequence for ORF that begin with an ATG and end
with the termination triplet is therefore one way of looking for
genes.
Physical Mapping Technique:
ORF Scan
• It has to be kept in mind that each DNA sequence has six
reading frames three in one direction and three in the
reverse direction on the complementary strand.
• The key to the success of ORF scanning is the frequency
with which termination triplets appear in the DNA
sequence.
• As there are three termination triplets and three reading
frames in either direction random DNA should not show
many ORF longer than 50 triplets in length especially if the
presence of a starting ATG is used as part of the definition
of an ORF
• With bacteriophage the analysis is further simplified by the
fact that there is relatively little non coding DNA in the
genes so if the non coding component (introns) of a gene is
small then there is a reduced chance of making mistakes in
interpreting the results of a simple ORF scan
Method for locating the precise start
and end points of gene transcripts:
RACE
• One possibility is a special type of PCR which uses RNA rather than
DNA as the starting material.
• The first step in this type of PCR is to convert the RNA into
complementary DNA with reverse transcriptase after which the
complementary DNA is amplified with taq polymerase in the same
way as in the normal PCR. This method is known as RT-PCR (reverse
transcriptase PCR).
• RACE (rapid amplification of cDNA ends) based on RT-PCR is used
for mapping.
RACE- Rapid Amplication of cDNA Ends
• In the simplest form of this method one of the primers is specific
for an internal region close to the beginning of the gene being
studied.
• This primer attaches to the messenger-RNA for the gene and directs
the first reverse transcriptase catalyzed stage of the process during
which a complementary DNA corresponding to the start of the
messenger-RNA is made.
• Because only a small segment of the messenger-RNA is being
copied the expectation is that the cDNA synthesis will not terminate
prematurely, so one end of the cDNA will correspond exactly with
the start of the messenger-RNA.
• Once the cDNA has been made a short linker is attached to its 3’
end. The second primer anneals to this linker and during the first
round of normal PCR converts the single-stranded cDNA into a
double stranded molecule which is subsequently amplified as the
PCR proceeds. The sequence of this amplified molecules will reveal
the precise position of the start of the transcript.
RACE- Rapid Amplication of cDNA Ends

Mapping the bacteriophage genome

  • 1.
    DR. VIBHA KHANNA ASSO.PROF. (BOTANY) S.P.C. GOVERNMENT COLLEGE AJMER (RAJASTHAN)
  • 2.
    CYTOGENETICS • BLOCK 3:PHAGE GENETICS • PRESENTATION 1: MAPPING THE BACTERIOPHAGE GENOME
  • 3.
    Bacteriophage Genome • Bacteriophagegenomes are enormously diverse. • Enormous heterogeneity occurs in the nucleotide sequence of bacteriophage genomes. • Phage genome size varies enormously: ranging from the ~3,300 nucleotide ssRNA viruses of Escherichia coli to the almost 500 kbp genome of Bacillus megaterium phage G • The genome of a bacteriophage may consist of RNA or DNA; the DNA may be single stranded but majority of bacteriophages are double stranded DNA (dsDNA) tailed phages (Caudovirales) • Bacteriophage genomes are ubiquitously mosaic • In general, these genomes are packaged at similar densities into their capsids and the size of the capsid varies as a function of genome size. • The infectivity of virion is influenced by the amount of DNA packaged within any given capsid , hence, variations in the amount of genetic material leads to loss of virion stability.
  • 4.
    Bacteriophage Genome: Core andNon-core Genes • The phage genome consists of core and non-core genes. • Core genes—the genes that are shared by all members of the group – includes: head genes, tail genes, DNA replication genes and nucleotide metabolism genes. • Non-core genes are found in all tailed phage genomes; they are often in small clusters of genes, interspersed among the clusters of core genes. • In most cases the functions of the non-core genes are unknown, and may be deleted without adverse effect on phage growth • Non-core genes are not the disorganized “junk” DNA. • These genes could serve as a “gene nursery”, where novel genetic functions could be built by recombination and mutation among genetic sequences that have no essential role in phage survival. • The non-core genes may optimize the phage to occupy a certain ecological niche, and that the changing repertoire of these genes gives the phage population access to new niches. • The description of core and non-core genes given here implies that the non-core genes are moving in and out of the phage genomes on a much faster time scale than the core genes.
  • 5.
    GENOME MAPPING • Genomemapping is used to identify and record the location of genes and the distances between genes on a chromosome. • Genome map highlights the key landmarks in an organism genome. • The landmarks on a genome map include short DNA sequences, regulatory sites for the genes themselves. • There are two general types of genome mapping called genetic mapping and physical mapping
  • 6.
    Genetic Mapping • Genemapping refers to the process of locating genes on a DNA strand. • A DNA strand is a long stretch of nucleotide sequences. Selective short regions of these long stretch of nucleotides form genes and are responsible for formation of functional and structural proteins. • A single DNA strand usually has multiple genes, which can function together or independently to form proteins which express phenotypically. • When a DNA is studied to figure out  locus of different genes on it, and  the respective distance between them, the process is referred to as gene mapping. • The first ever genetic map was created by Alfred Strutevant while he worked on Drosophila melanogaster with Thomas Hunt Morgan. • Centimorgan is the unit to define distance between two genes on a locus.
  • 7.
    Genetic Maps • Thegenetic map which is also known as the linkage map of the chromosome may is defined as ‘a diagram of the order of genes in a chromosome in which the distance between adjacent genes is proportional to the rate of recombination between them’ • Genetic maps are based on the recombination (the exchange of DNA sequence between sister chromatids during meiosis) frequency between molecular markers. • These maps are population specific.
  • 8.
    Physical Maps • Physicalmaps are an alignment of DNA sequences, with distance between markers measured in base pairs. • Physical mapping uses Molecular Biology techniques to examine DNA molecules directly, in order to construct maps showing the position of sequence features, including genes • Unique DNA sequences called ‘molecular markers’ are compared to each other to determine correct marker order (genetic map) and used to identify overlapping segments of larger DNA pieces (physical map).
  • 9.
    Mapping The VirusGenome  Genetic (Recombination mapping) mapping technique • Bacteriophage genomes also undergo recombination, although the process is different from that in bacteria. Because phages themselves reproduce within the cell and cannot recombine directly, crossing-over must occur inside a host cell. • In principle a virus recombination experiment is easy to carry out. If bacteria are mixed with enough phages at least 2 viruses will infect each cell on an average and genetic recombination should be observed. • Phage progeny in the resulting lysate can be checked for alternate combinations of the initial parental genotypes  Physical mapping techniques (Heteroduplex Analysis, Restriction mapping, ORF scanning,). • Phage genomes are so small (the core genes, in particular) that often it is convenient to map them without determining recombination frequencies. • Some techniques actually generate physical maps which often are most used in genetic engineering. • Several of these methods require manipulation of the DNA with subsequent examination in the electron microscope for example one can directly compare wild-type and mutant viral chromosomes.
  • 10.
    Mapping Genome byGenetic Techniques • When proposing the idea of crossing over, Morgan hypothesized  that the frequency of recombination was related to the distance between the genes on a chromosome, and  that the interchange of genetic information broke the linkage between genes. • Morgan imagined that genes on chromosomes were similar to beads on a string ; in other words, they were physical objects. • Morgan proposed that the strength of linkage between two genes depends upon the distance between the genes on the chromosome. This proposition became the basis for construction of the genetic maps. • The closer two genes were to one another on a chromosome, the greater their chance of being inherited together. In contrast, genes located farther away from one another on the same chromosome were more likely to be separated during recombination. • The "proportion of crossovers could be used as an index of the distance between any two factors"
  • 11.
    Mapping Genome byGenetic Techniques • Linkage analysis is a technique in which the genome is scanned for chromosomal loci showing co-segregation with the phenotype of interest. • The phenomenon known as incomplete linkage occurs when two genes show linkage with a recombination level greater than 0% and less than 50%. In incomplete linkage, all expected types of gametes are formed, but the recombinant gametes occur less often than the parental gametes. • In addition, if two genes are on the same chromosome and are far enough apart that they undergo recombination at least 50% of the time, the genes are independently assorting and do not show linkage. Genes independently assort at a distance of 50 cM or more apart. • Finally, linked genes that do not independently assort show statistical linkage. Statistical linkage is detected as deviation from independent assortment that favors the parental gametes.
  • 12.
    Recombination Mapping • ToSummarize: The rate of recombination between a specific pair of genetic loci depends on the distance between them and varies from less than 1 percent to approximately 50 percent. Measurement of the recombination frequencies for different loci can be used to map the virus genome. In this type of genetic map, loci with high recombination frequencies are far apart and loci with low recombination frequencies are close together.
  • 13.
    Recombination of BacteriophageGenes • Recombination involves the exchange of genetic material between two related viruses • Viral recombination occurs when viruses of two different parent strains coinfect the same host cell and interact during replication to generate virus progeny that have some genes from both parents. • Genes that reside on the same piece of nucleic acid may undergo recombination. The closer two genes are together, the rarer is recombination between them (partial linkage). • As long as there are detectable phenotypes and methods for carrying out the process, it is possible to map phages in this way.
  • 14.
    Recombination In ThePhage: Hershey’s Experiment • Alfred Hershey initially demonstrated recombination in the phage T2 using two strains with different phenotypes. The gene h influences host range, when gene h changes T2 infects different strains of E.coli. Phages with the r+ genes have wild-type plaque morphology while T2 with r genotype has a rapid lysis phenotype and produces larger than normal plaques with sharp edges. • In one experiment Hershey infected E.coli with large quantities of the h+ r+ and hr T2 strains. • He then plated out the lysates with the mixture of two different host strains and was able to detect a significant number of h+r and hr+ recombinants as well as parental type plaques. https://www.slideshare.net/vibhakhanna1/genetic-recombination-in-phages
  • 15.
    Recombination Mapping ofViral Genome • The lysate was spread over a bacterial lawn having the mixture of strains 1 and 2, and analysed. Four types of plaques were recorded:  clear and small plaques (h–r+),  cloudy and large plaques (h+r–),  cloudy and small plaques (h+r+), and  clear and large plaques (h–r–). • The former two types of plaques have parental phenotypes, while the last two are the recombinants. • Out of the four, the recombination frequency (RF) is calculated as below:  RF = {(h+r+) + (h–r–)/Total plaques} X 100 • The map unit (1 m.u.) is defined as a recombinant frequency of 1 percent. • Thus genetic maps can be constructed, by determining the map distance between the genes under consideration.
  • 16.
    Physical Mapping Technique: Heteroduplexmapping • In heteroduplex mapping the two types of chromosomes are denatured, mixed and allowed to rejoin or anneal. When joined the homologous regions of the different DNA molecules form a regular double helix. • Several other direct techniques are used to map viral genomes or parts of them. Restriction endonucleases are employed together with electrophoresis to analyse DNA fragments and locate deletions and other mutations that affect electrophoretic mobility. • Phage genomes also can be directly sequenced to locate particular mutations and analyse the changes that have taken place • An electron microscopic technique compares sequence relationships of two polynucleotides.
  • 17.
    Preparation of theHeteroduplex • Bacteriophage DNA occurs both as duplex DNA while growing in the infected cell, and as single strands in the mature viral particles. • Separation of the strands of the duplex and reannealing with an excess of single strand DNA from phage of a different genotype yields heteroduplex. • Another method is available for use with bacteriophage lambda, which has two strands of different density. • The separated linear single strands can be isolated individually by density gradient centrifugation and then annealed with complementary single strands of a different genotype producing heteroduplex molecules.
  • 18.
    Heteroduplex Analysis • Twodifferent methods are applied under the concept of heteroduplex analysis. • With the molecular biological method, a standard DNA and a DNA to be analyzed are amplified separately, mixed, denatured, and slowly cooled (approximately 1°C to 2°C [34°F to 37°F] per minute) to permit the formation of both, homoduplexes (HmD) and heteroduplexes (HtD). Heteroduplexes are formed from standard and sample DNA.
  • 19.
    Heteroduplex Analysis • Thepreparation is then applied to a polyacrylamide gel and subjected to electrophoresis for several hours. • The heteroduplexes migrate more slowly during gel electrophoresis, due to their sequence mismatch(es) and therefore heterozygous (Het) and homozygous (Hom) cases can be easily distinguished from the wild type (Wt) based on their electrophoretic pattern. M: size marker.
  • 20.
    Heteroduplex Analysis • Anothermethod for transcript mapping involves heteroduplex analysis. If the DNA region being studied is cloned as a restriction fragment in an M13 vector then it can be obtained as single stranded DNA. • When mixed with an appropriate RNA preparation the transcribed sequence in the cloned DNA hybridizes with equivalent mRNA forming a double stranded hetero duplex. • In the example shown in figure, the start of this messenger RNA lies within the cloned restriction fragment, so some of the cloned fragment participates in the Heteroduplex but the rest does not. The single stranded regions can be digested by treatment with a single strand specific nuclease such as S1. • The size of the heteroduplex is determined by degrading the RNA component with alkali and electrophoresing the single stranded DNA in agarose gel. This size measurement is then used to position the start of the transcript relative to the restriction site at the end of the cloned fragments.
  • 21.
    S1 Nuclease Mapping •A gene having two Sau3A restriction sites, may be considered as an example to understand S1 Nuclease Mapping. • One of the restriction sites coincides with the gene starting region, whereas the other is present few base-pairs upstream of the gene sequence. • The starting point of the transcription is never from the very first base-pair of the gene; instead few base-pairs upstream the gene. • The DNA is cleaved, with the restriction endonuclease and is inserted into the M13 vector. • M13 vector is single-stranded and closed circular. • To this vector, the mRNA of the gene isolated from the cell is hybridized. • The mRNA’s start sequence would bind to the ssDNA where the complementary sequence is present.
  • 22.
    S1 Nuclease Mapping •Now, S1 nuclease is added to remove the single-stranded DNA. Only the start sequence of mRNA bounded to the DNA would be protected. • The size of the DNA is calculated by gel electrophoresis after separating the DNA and RNA by alkaline treatment. • Suppose the DNA fragment formed due Sau3A was 400 base pairs and consist both staring region of the gene (100 bp) and few upstream leader sequence (300 bp). • If the length of the DNA was calculated to be 150 basepairs, then we can say that the start point of the transcription is 50 bp upstream to the gene sequence (150–100 = 50).
  • 23.
    Physical Mapping Technique: RestrictionMapping • There are many different restriction enzymes with many different target sequences, majority of these target sites are 4, 5 or 6 nucleotide sequence but there are examples that recognize sequences of 7, 8 or more nucleotides. • In restriction mapping, determination of nucleotide sequence of a gene is achieved by cleavage of corresponding DNA, at specific sites, with the help of restriction endonucleases. • The data of digestion of a DNA molecule by more than one endonucleases can be utilized to arrange the sites of breakage in a definite order. • These sites of cleavage can be identified and mapped to give a restriction map. • On a restriction map, is found a linear sequence of sites, each for a specific enzyme and the distances between them are measured as number of base pairs of DNA.
  • 24.
  • 25.
    Restriction Mapping: The BasicMethodology • The simplest way to construct a restriction map is to compare the fragment sizes produced when a DNA molecule is digested with two different restriction enzymes that recognize different target sequences; for example using the restriction enzyme Eco R1 and Bam H1 • First the DNA molecule is digested with one of the two enzymes and the sizes of the resulting fragments are measured by agarose gel electrophoresis. • Next the molecule is digested with the second enzyme and the resulting fragment again sized in an agarose gel. • The results of subsequent use of two enzymes give clear picture about restriction sites creating a large number of fragments but this method do not allow their relative positions to be determined.
  • 26.
    Restriction Mapping: The BasicMethodology • Next, to determine the relative positions of the restriction sites for each enzymes, the DNA molecule is cut with both enzymes at once. • In the given example this ‘double restriction’ enable three of the sites to be mapped but a problem arises with the larger Eco R1 fragment as this contains two Bam H1 sites and there are two alternative possibilities for the map location of the outer one of these. • The problem is solved by going back to the original DNA molecule and treating it again with Bam H1 on its own but this time preventing the digestion from going to completion by, say, incubating the reaction for only a short time or using a sub-optimal incubation temperature. This is called a ‘partial restriction’ and leads to a more complex set of products. • The complete restriction products now being supplemented with partially restricted fragment that still contains one or more uncut Bam H1 sites. In the example shown in the Fig., the size of one of the partial restriction fragments is diagnostic and the correct map can be identified
  • 27.
    Restriction Mapping: The BasicMethodology • A partial restriction usually gives the information needed to complete a map, but if there are many restriction sites then this type of analysis becomes unwieldy, simply because there are so many different fragments to consider. • An alternative strategy is simpler because it enables the majority of the fragments to be ignored. • This is achieved by attaching a radioactive or other type of marker to each end of the starting DNA molecule before carrying out the partial digestion. • The result is that many of the partial restriction products become ‘invisible’ because they do not contain an end- fragment and so do not show up when the agarose gel is screened for labeled products. • The sizes of the partial restriction products that are visible enable unmapped sites to be positioned relative to the ends of the starting molecule.
  • 28.
    Restriction Mapping: The BasicMethodology • The scale of restriction mapping is limited by the sizes of the restriction fragments. • Restriction maps are easy to generate if there are relatively few cut sites for the enzymes being used. • Restriction mapping is therefore more applicable to small molecules with the upper limit for the technique dependent on the frequency of the restriction sites in the molecule being mapped. • Since the genome of bacteriophage lies within the limit, this technique can be made use of, for mapping it. • Restriction mapping is rapid, easy and provides detailed information.
  • 29.
  • 30.
    Physical Mapping Technique: ORFScan • Physical mapping refers to locating genes in DNA sequences. The techniques that can be used for bacteriophages includes:  Gene location by sequence inspection i.e., ORF Scanning  Specialist methods have been developed for mapping the position of RNA molecules on-to DNA sequences to determine the start and end points of transcription. • In case of bacteriophages the size of the genome is comparatively very small, hence sequence inspection can be used to locate genes. • Genes that code for proteins comprise open reading frames consisting of a series of codons that specify the amino acid sequence of the protein that the gene codes for. • The ORF begins with initiation codon while usually but not always ATG and ends with the termination codon either TAA, TAG or TGA. • Searching a DNA sequence for ORF that begin with an ATG and end with the termination triplet is therefore one way of looking for genes.
  • 31.
    Physical Mapping Technique: ORFScan • It has to be kept in mind that each DNA sequence has six reading frames three in one direction and three in the reverse direction on the complementary strand. • The key to the success of ORF scanning is the frequency with which termination triplets appear in the DNA sequence. • As there are three termination triplets and three reading frames in either direction random DNA should not show many ORF longer than 50 triplets in length especially if the presence of a starting ATG is used as part of the definition of an ORF • With bacteriophage the analysis is further simplified by the fact that there is relatively little non coding DNA in the genes so if the non coding component (introns) of a gene is small then there is a reduced chance of making mistakes in interpreting the results of a simple ORF scan
  • 32.
    Method for locatingthe precise start and end points of gene transcripts: RACE • One possibility is a special type of PCR which uses RNA rather than DNA as the starting material. • The first step in this type of PCR is to convert the RNA into complementary DNA with reverse transcriptase after which the complementary DNA is amplified with taq polymerase in the same way as in the normal PCR. This method is known as RT-PCR (reverse transcriptase PCR). • RACE (rapid amplification of cDNA ends) based on RT-PCR is used for mapping.
  • 33.
    RACE- Rapid Amplicationof cDNA Ends • In the simplest form of this method one of the primers is specific for an internal region close to the beginning of the gene being studied. • This primer attaches to the messenger-RNA for the gene and directs the first reverse transcriptase catalyzed stage of the process during which a complementary DNA corresponding to the start of the messenger-RNA is made. • Because only a small segment of the messenger-RNA is being copied the expectation is that the cDNA synthesis will not terminate prematurely, so one end of the cDNA will correspond exactly with the start of the messenger-RNA. • Once the cDNA has been made a short linker is attached to its 3’ end. The second primer anneals to this linker and during the first round of normal PCR converts the single-stranded cDNA into a double stranded molecule which is subsequently amplified as the PCR proceeds. The sequence of this amplified molecules will reveal the precise position of the start of the transcript.
  • 34.